Oklahoma County Investment Properties for Sale
Browse homes for sale and investment properties in Oklahoma County. Refine your search by price, property type, or more.
Best cash flowing properties in Oklahoma County
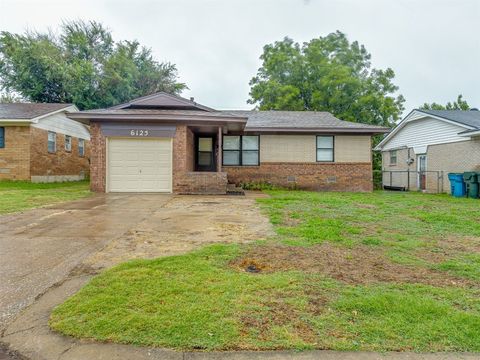
Active
$150,000
3
bds
|
1
ba
|
848
sqft
|
built
1964
6125 SE 11th St, Midwest City, OK 73110
$187
Cash flow
6.5%
Cash-on-Cash Return
7.2%
Cap rate
0.9%
Rent to Value Ratio
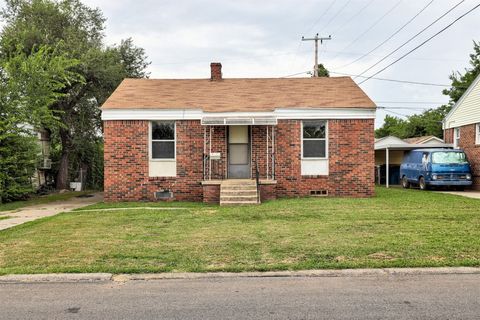
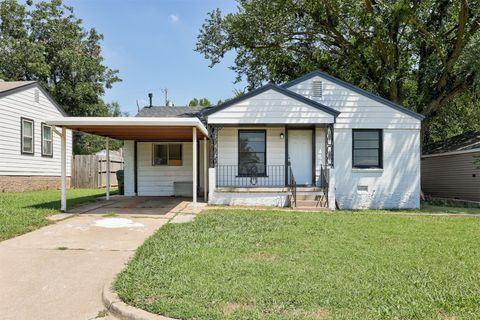
Active
$113,500
2
bds
|
1
ba
|
864
sqft
|
built
1944
517 E Boeing Dr, Midwest City, OK 73110
$153
Cash flow
7.0%
Cash-on-Cash Return
7.3%
Cap rate
0.9%
Rent to Value Ratio
26 out of 38 properties for sale in Oklahoma County
Limited Results Shown
Create a free account, or log in to reveal all property listings and enjoy the complete experience.

Active
$240,000
4
bds
|
3
ba
|
1,654
sqft
|
built
1950
2616 Norman Ave, Oklahoma City, OK 73127
$-226
Cash flow
-4.9%
Cash-on-Cash Return
4.6%
Cap rate
0.6%
Rent to Value Ratio
Active
$274,000
3
bds
|
4
ba
|
2,263
sqft
|
built
1990
15517 Juniper Dr, Edmond, OK 73013
$-88
Cash flow
-1.7%
Cash-on-Cash Return
5.3%
Cap rate
0.8%
Rent to Value Ratio
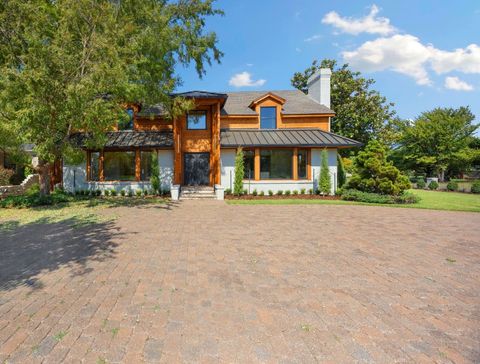
Active
$5,500,000
4
bds
|
7
ba
|
10,891
sqft
|
built
1987
2701 Twin Creek Dr, Oklahoma City, OK 73131
$-24,417
Cash flow
-23.2%
Cash-on-Cash Return
0.4%
Cap rate
0.1%
Rent to Value Ratio
Active
$259,000
3
bds
|
2
ba
|
1,897
sqft
|
built
1990
16304 Bandera, Edmond, OK 73013
$-192
Cash flow
-3.9%
Cash-on-Cash Return
4.8%
Cap rate
0.7%
Rent to Value Ratio
Active
$571,500
3
bds
|
5
ba
|
4,755
sqft
|
built
1980
2202 NW 45th St, Oklahoma City, OK 73112
$-1,439
Cash flow
-13.1%
Cash-on-Cash Return
2.7%
Cap rate
0.4%
Rent to Value Ratio
Active
$156,900
2
bds
|
1
ba
|
902
sqft
|
built
1950
1417 Downing St, Oklahoma City, OK 73120
$120
Cash flow
4.0%
Cash-on-Cash Return
6.6%
Cap rate
0.9%
Rent to Value Ratio
Active
$229,900
3
bds
|
2
ba
|
1,474
sqft
|
built
1949
2616 NW 33rd St, Oklahoma City, OK 73112
$-197
Cash flow
-4.5%
Cash-on-Cash Return
4.7%
Cap rate
0.7%
Rent to Value Ratio

Active
$262,500
4
bds
|
2
ba
|
1,766
sqft
|
built
2003
11014 Madison Ave, Midwest City, OK 73130
$0
Cash flow
0.0%
Cash-on-Cash Return
5.7%
Cap rate
0.7%
Rent to Value Ratio
Active
$1,150,000
5
bds
|
7
ba
|
4,345
sqft
|
built
1951
1725 Huntington Ave, Nichols Hills, OK 73116
$-1,923
Cash flow
-8.7%
Cash-on-Cash Return
3.7%
Cap rate
0.4%
Rent to Value Ratio
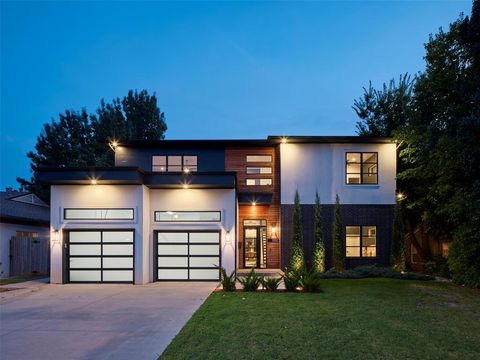
Active
$675,000
2
bds
|
3
ba
|
2,020
sqft
|
built
2020
14 NE 3rd St, Oklahoma City, OK 73104
$-1,134
Cash flow
-8.8%
Cash-on-Cash Return
3.7%
Cap rate
0.5%
Rent to Value Ratio
Active
$185,000
3
bds
|
2
ba
|
1,100
sqft
|
built
1951
509 E Kerr Dr, Midwest City, OK 73110
$-47
Cash flow
-1.3%
Cash-on-Cash Return
5.4%
Cap rate
0.6%
Rent to Value Ratio

Active
$270,000
3
bds
|
2
ba
|
2,044
sqft
|
built
1978
9901 Hummingbird Ln, Oklahoma City, OK 73162
$-36
Cash flow
-0.7%
Cash-on-Cash Return
5.5%
Cap rate
0.7%
Rent to Value Ratio

Active
$350,000
4
bds
|
3
ba
|
2,169
sqft
|
built
2013
16201 Royal Crest Ln, Edmond, OK 73013
$-265
Cash flow
-4.0%
Cash-on-Cash Return
4.8%
Cap rate
0.6%
Rent to Value Ratio

Active
$275,000
3
bds
|
2
ba
|
2,059
sqft
|
built
1991
1917 Goldenrod Ln, Midwest City, OK 73130
$-59
Cash flow
-1.1%
Cash-on-Cash Return
5.4%
Cap rate
0.7%
Rent to Value Ratio

Active
$415,000
4
bds
|
3
ba
|
2,000
sqft
|
built
2021
5813 NW 159th St, Edmond, OK 73013
$-239
Cash flow
-3.0%
Cash-on-Cash Return
5.0%
Cap rate
0.6%
Rent to Value Ratio
Active
$1,195,000
4
bds
|
3
ba
|
3,844
sqft
|
built
2019
1212 W Wilshire Blvd, Nichols Hills, OK 73116
$-2,136
Cash flow
-9.3%
Cash-on-Cash Return
3.5%
Cap rate
0.4%
Rent to Value Ratio
Active
$365,000
4
bds
|
3
ba
|
2,267
sqft
|
built
2002
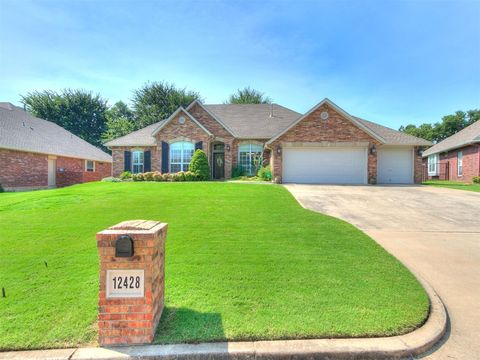
12428 Elizabeth Dr, Midwest City, OK 73130
$-209
Cash flow
-3.0%
Cash-on-Cash Return
5.0%
Cap rate
0.6%
Rent to Value Ratio

Active
$256,000
3
bds
|
2
ba
|
1,845
sqft
|
built
2008
8233 Greer Way, Oklahoma City, OK 73132
$31
Cash flow
0.6%
Cash-on-Cash Return
5.8%
Cap rate
0.7%
Rent to Value Ratio
Active
$310,000
2
bds
|
3
ba
|
1,248
sqft
|
built
1974
1110 Sherwood Ln, Nichols Hills, OK 73116
$-283
Cash flow
-4.8%
Cash-on-Cash Return
4.6%
Cap rate
0.6%
Rent to Value Ratio
Active
$219,900
3
bds
|
2
ba
|
1,338
sqft
|
built
1978
516 Ridgecrest Rd, Edmond, OK 73013
$63
Cash flow
1.5%
Cash-on-Cash Return
6.0%
Cap rate
0.7%
Rent to Value Ratio

Active
$150,000
4
bds
|
1
ba
|
1,128
sqft
|
built
1957
2233 SW 40th St, Oklahoma City, OK 73119
$49
Cash flow
1.7%
Cash-on-Cash Return
6.1%
Cap rate
0.7%
Rent to Value Ratio
Active
$1,275,000
4
bds
|
5
ba
|
4,131
sqft
|
built
2014
1422 Glenbrook Ter, Nichols Hills, OK 73116
$-2,515
Cash flow
-10.3%
Cash-on-Cash Return
3.3%
Cap rate
0.4%
Rent to Value Ratio

Active
$369,000
4
bds
|
3
ba
|
3,099
sqft
|
built
1970
10236 Bellmont Ave, Midwest City, OK 73130
$-21
Cash flow
-0.3%
Cash-on-Cash Return
5.6%
Cap rate
0.7%
Rent to Value Ratio
Active
$599,999
3
bds
|
3
ba
|
2,190
sqft
|
built
1939
1109 Bedford Dr, Nichols Hills, OK 73116
$-1,114
Cash flow
-9.7%
Cash-on-Cash Return
3.5%
Cap rate
0.4%
Rent to Value Ratio