Oklahoma County Investment Properties for Sale
Browse homes for sale and investment properties in Oklahoma County. Refine your search by price, property type, or more.
Best cash flowing properties in Oklahoma County
Active
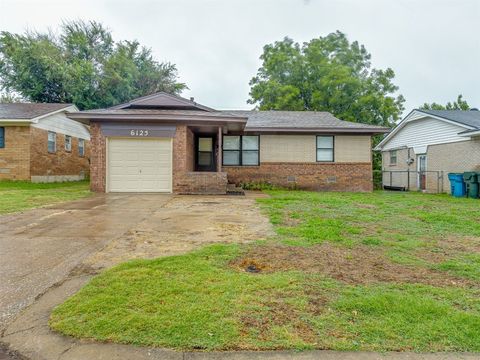
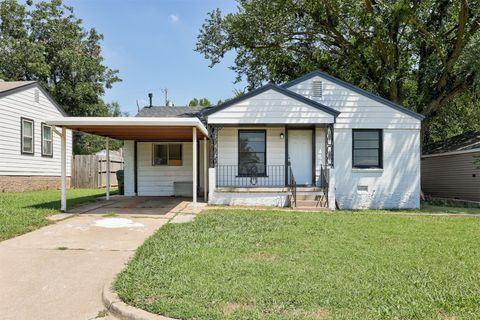
$150,000
3
bds
|
1
ba
|
848
sqft
|
built
1964
6125 SE 11th St, Midwest City, OK 73110
$187
Cash flow
6.5%
Cash-on-Cash Return
7.2%
Cap rate
0.9%
Rent to Value Ratio
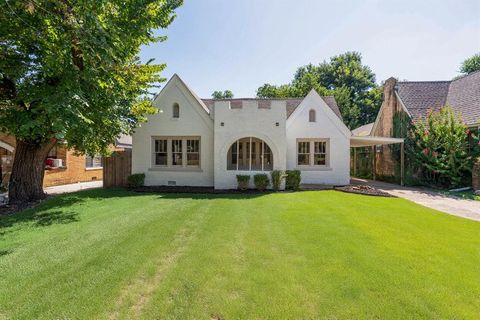
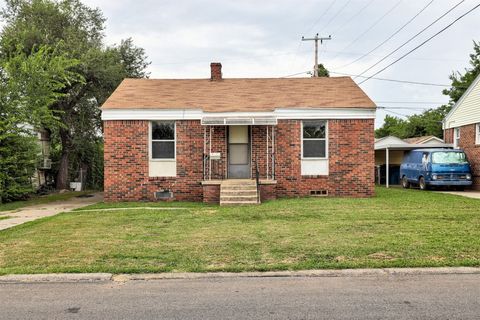
Active
$230,000
3
bds
|
2
ba
|
1,463
sqft
|
built
1929
2316 N Barnes Ave, Oklahoma City, OK 73107
$154
Cash flow
3.5%
Cash-on-Cash Return
6.5%
Cap rate
0.8%
Rent to Value Ratio
16 out of 20 properties for sale in Oklahoma County
Limited Results Shown
Create a free account, or log in to reveal all property listings and enjoy the complete experience.
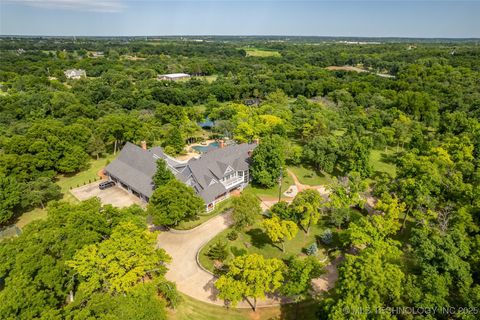
Active
$5,500,000
4
bds
|
7
ba
|
10,891
sqft
|
built
1987
2701 Twin Creek Dr, Oklahoma City, OK 73131
$-24,417
Cash flow
-23.2%
Cash-on-Cash Return
0.4%
Cap rate
0.1%
Rent to Value Ratio
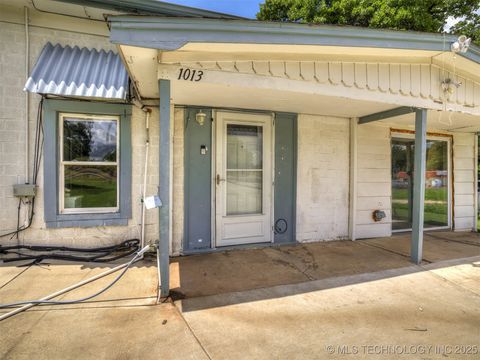
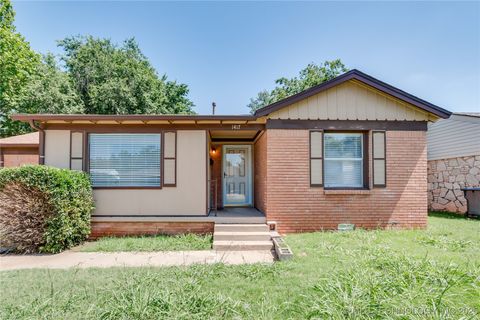
Active
$158,900
3
bds
|
1
ba
|
816
sqft
|
built
1942
1013 N Post Rd, Midwest City, OK 73130
$-77
Cash flow
-2.5%
Cash-on-Cash Return
5.1%
Cap rate
0.7%
Rent to Value Ratio
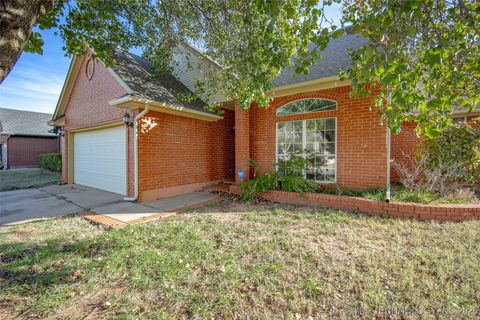
Active
$259,000
3
bds
|
2
ba
|
1,897
sqft
|
built
1990
16304 Bandera, Edmond, OK 73013
$-192
Cash flow
-3.9%
Cash-on-Cash Return
4.8%
Cap rate
0.7%
Rent to Value Ratio
Active
$571,500
3
bds
|
5
ba
|
4,755
sqft
|
built
1980
2202 NW 45th St, Oklahoma City, OK 73112
$-1,439
Cash flow
-13.1%
Cash-on-Cash Return
2.7%
Cap rate
0.4%
Rent to Value Ratio
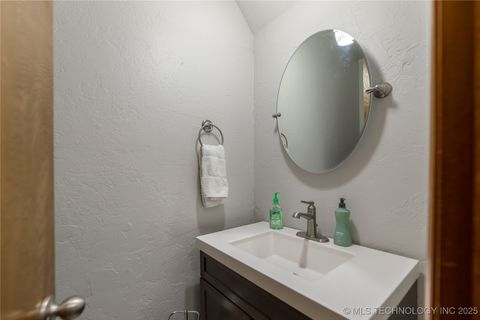
Active
$156,900
2
bds
|
1
ba
|
902
sqft
|
built
1950
1417 Downing St, Oklahoma City, OK 73120
$120
Cash flow
4.0%
Cash-on-Cash Return
6.6%
Cap rate
0.9%
Rent to Value Ratio
Active
$229,900
3
bds
|
2
ba
|
1,474
sqft
|
built
1949
2616 NW 33rd St, Oklahoma City, OK 73112
$-197
Cash flow
-4.5%
Cash-on-Cash Return
4.7%
Cap rate
0.7%
Rent to Value Ratio
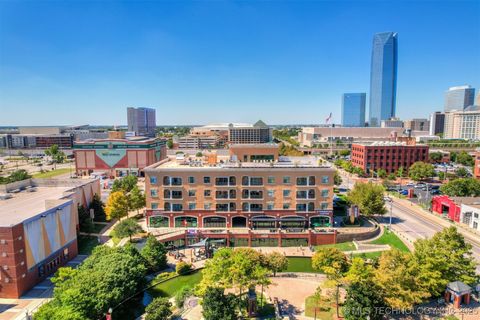
Active
$674,999
2
bds
|
3
ba
|
1,959
sqft
|
built
2008
200 S Oklahoma Ave, Oklahoma City, OK 73104
$-2,799
Cash flow
-21.6%
Cash-on-Cash Return
0.7%
Cap rate
0.5%
Rent to Value Ratio
Active
$263,500
3
bds
|
2
ba
|
1,609
sqft
|
built
2012
12510 SE 16th Ct, Choctaw, OK 73020
$-327
Cash flow
-6.5%
Cash-on-Cash Return
4.2%
Cap rate
0.7%
Rent to Value Ratio
Active
$265,000
2
bds
|
2
ba
|
1,340
sqft
|
built
1946
804 S Sooner Rd, Oklahoma City, OK 73110
$-266
Cash flow
-5.2%
Cash-on-Cash Return
4.5%
Cap rate
0.6%
Rent to Value Ratio
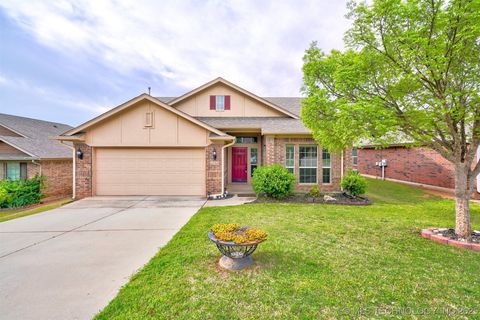
Active
$214,777
3
bds
|
2
ba
|
1,796
sqft
|
built
1962
2236 Highland Rd, Midwest City, OK 73110
$88
Cash flow
2.1%
Cash-on-Cash Return
6.2%
Cap rate
0.7%
Rent to Value Ratio
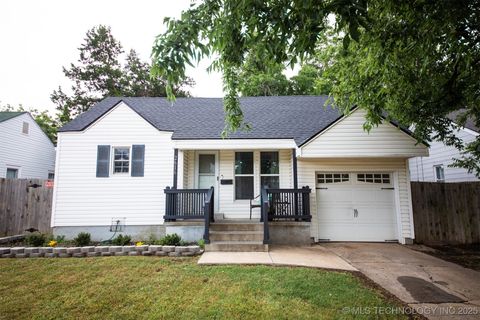
Active
$185,000
3
bds
|
2
ba
|
1,100
sqft
|
built
1951
509 E Kerr Dr, Midwest City, OK 73110
$-47
Cash flow
-1.3%
Cash-on-Cash Return
5.4%
Cap rate
0.6%
Rent to Value Ratio
Active
$113,500
2
bds
|
1
ba
|
864
sqft
|
built
1944
517 E Boeing Dr, Midwest City, OK 73110
$153
Cash flow
7.0%
Cash-on-Cash Return
7.3%
Cap rate
0.9%
Rent to Value Ratio
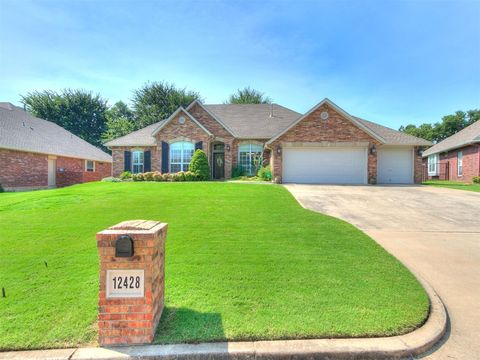
Active
$365,000
4
bds
|
3
ba
|
2,267
sqft
|
built
2002
12428 Elizabeth Dr, Midwest City, OK 73130
$-209
Cash flow
-3.0%
Cash-on-Cash Return
5.0%
Cap rate
0.6%
Rent to Value Ratio
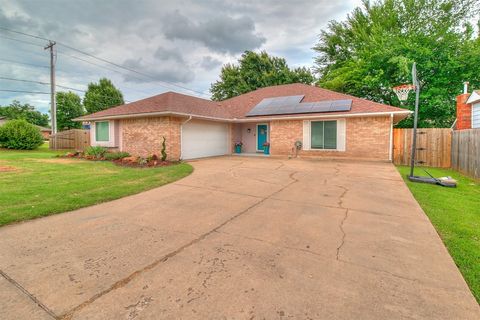
Active
$282,000
4
bds
|
2
ba
|
2,360
sqft
|
built
1979
100 Three Oaks Dr, Midwest City, OK 73130
$-162
Cash flow
-3.0%
Cash-on-Cash Return
5.0%
Cap rate
0.6%
Rent to Value Ratio