Tulsa County Investment Properties for Sale
Browse homes for sale and investment properties in Tulsa County. Refine your search by price, property type, or more.
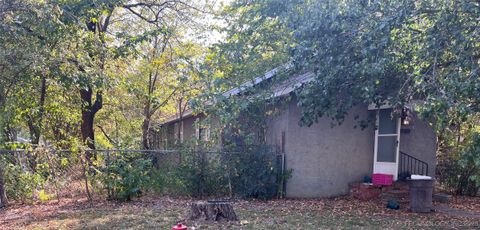
Best cash flowing properties in Tulsa County
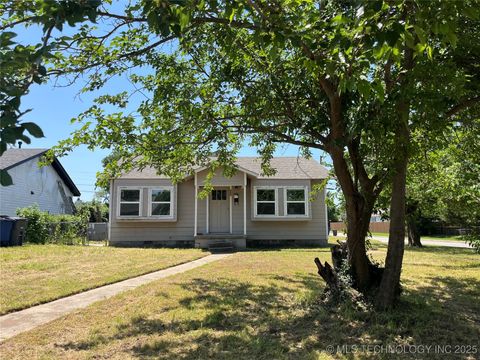
Active
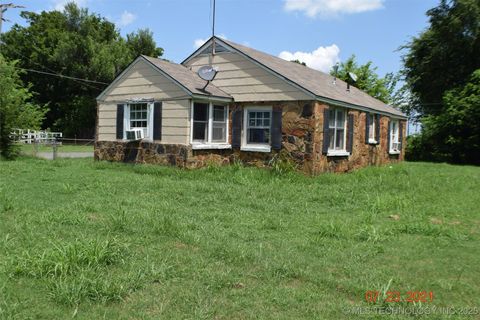
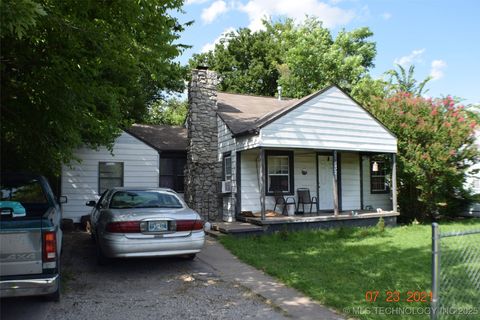
$49,500
2
bds
|
1
ba
|
980
sqft
|
built
1941
604 E 30th St N, Tulsa, OK 74106
$602
Cash flow
14.2%
Cash-on-Cash Return
14.6%
Cap rate
1.8%
Rent to Value Ratio
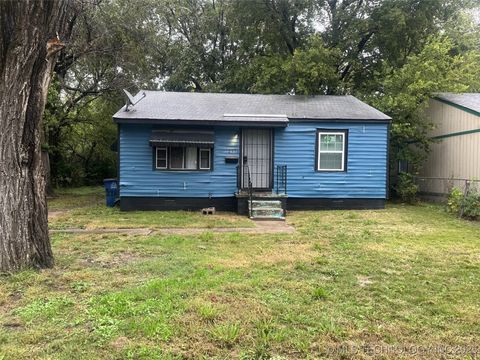
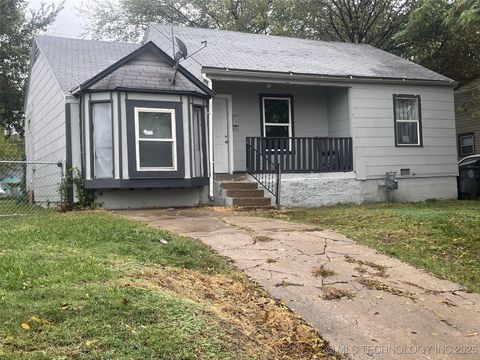
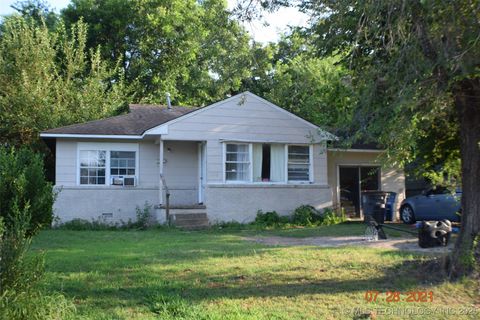
Active
$83,500
2
bds
|
1
ba
|
785
sqft
|
built
1952
2413 N Yorktown Ave, Tulsa, OK 74110
$209
Cash flow
13.1%
Cash-on-Cash Return
8.7%
Cap rate
1.1%
Rent to Value Ratio
1,070 out of 1,403 properties for sale in Tulsa County
Limited Results Shown
Create a free account, or log in to reveal all property listings and enjoy the complete experience.
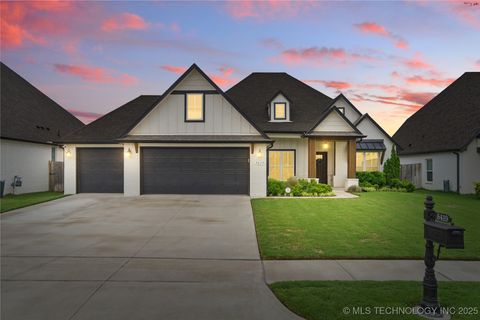
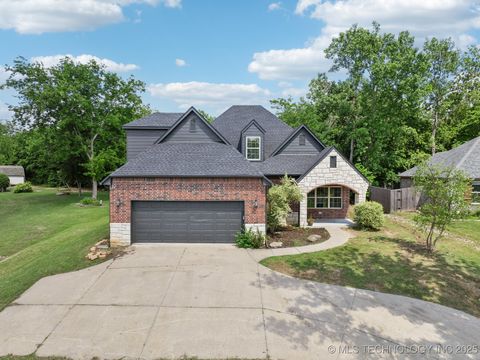
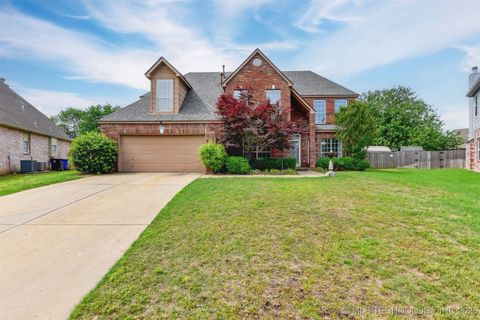
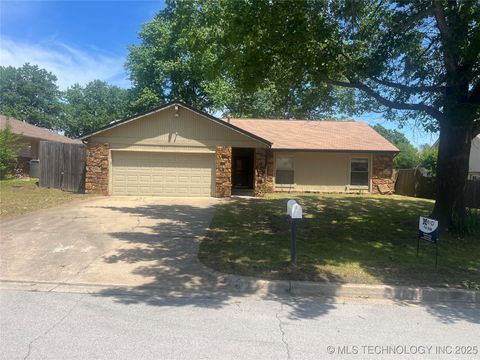
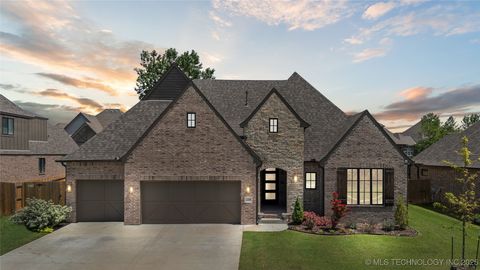
Active
$429,900
4
bds
|
2
ba
|
2,274
sqft
|
built
2020
5419 E 122nd St S, Bixby, OK 74008
$-376
Cash flow
-4.6%
Cash-on-Cash Return
4.6%
Cap rate
0.6%
Rent to Value Ratio
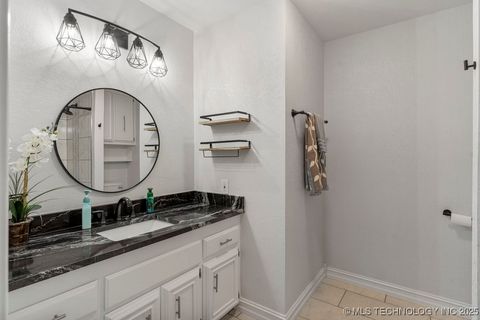
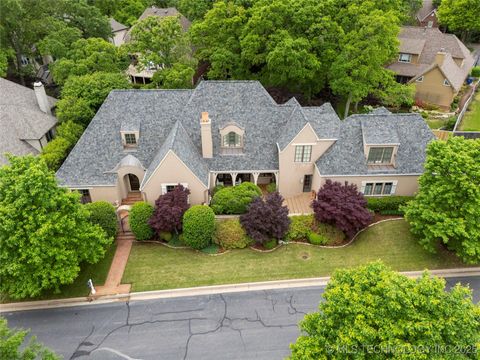
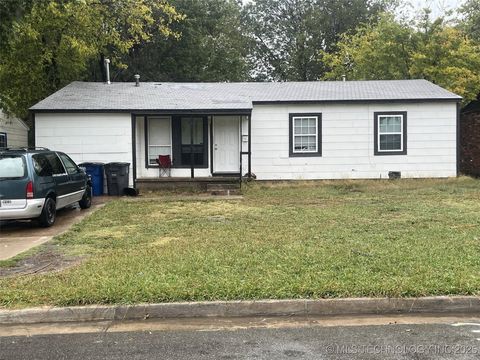
Active
$799,900
5
bds
|
5
ba
|
4,169
sqft
|
built
1976
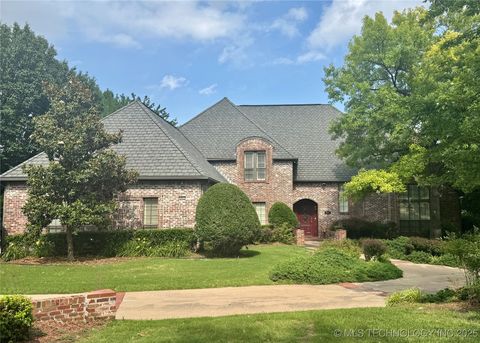
4243 E 104th St, Tulsa, OK 74137
$-1,642
Cash flow
-10.7%
Cash-on-Cash Return
3.2%
Cap rate
0.5%
Rent to Value Ratio
Active
$1,750,000
5
bds
|
7
ba
|
7,391
sqft
|
built
2013
10617 S Winston Ct, Tulsa, OK 74137
$-7,191
Cash flow
-21.4%
Cash-on-Cash Return
0.7%
Cap rate
0.2%
Rent to Value Ratio
Active
$525,000
5
bds
|
4
ba
|
4,127
sqft
|
built
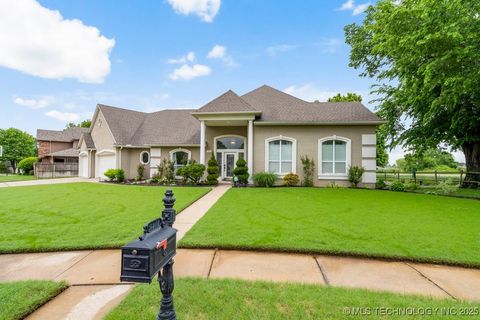
2008
1310 N Northridge Ct, Sand Springs, OK 74063
$-461
Cash flow
-4.6%
Cash-on-Cash Return
4.6%
Cap rate
0.7%
Rent to Value Ratio
Active
$1,799,000
5
bds
|
7
ba
|
5,806
sqft
|
built
2015
4301 S Mimosa Ave, Broken Arrow, OK 74011
$-6,084
Cash flow
-17.6%
Cash-on-Cash Return
1.6%
Cap rate
0.3%
Rent to Value Ratio
Active
$725,000
4
bds
|
4
ba
|
3,474
sqft
|
built
2001
9327 S Jamestown Ave, Tulsa, OK 74137
$-1,785
Cash flow
-12.8%
Cash-on-Cash Return
2.7%
Cap rate
0.5%
Rent to Value Ratio
Active
$339,900
4
bds
|
2
ba
|
1,940
sqft
|
built
2024
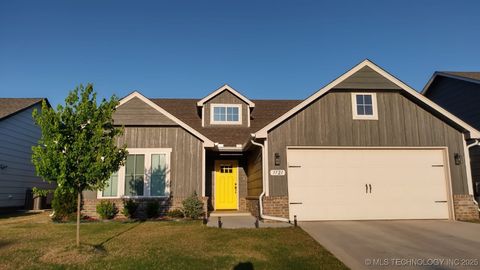
3721 E 39th St, Tulsa, OK 74135
$-530
Cash flow
-8.1%
Cash-on-Cash Return
3.8%
Cap rate
0.5%
Rent to Value Ratio
Active
$468,900
4
bds
|
4
ba
|
3,693
sqft
|
built
2005
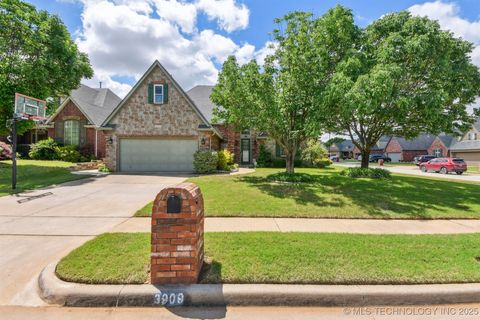
3909 W Utica St, Broken Arrow, OK 74011
$-715
Cash flow
-8.0%
Cash-on-Cash Return
3.8%
Cap rate
0.6%
Rent to Value Ratio
Active
$105,000
2
bds
|
2
ba
|
1,153
sqft
|
built
1970
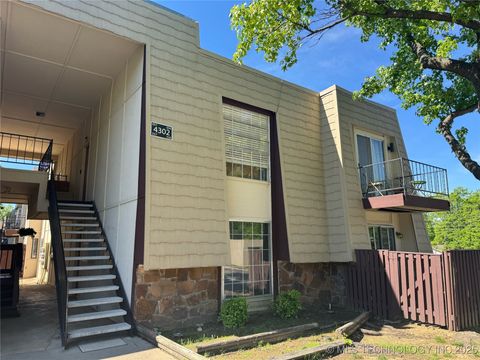
4302 E 67th St, Tulsa, OK 74136
$-41
Cash flow
-2.0%
Cash-on-Cash Return
5.2%
Cap rate
1.2%
Rent to Value Ratio
Active
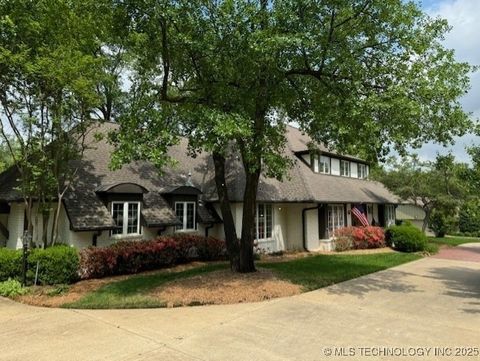
$635,000
4
bds
|
4
ba
|
2,763
sqft
|
built
1972
3130 E 47th St, Tulsa, OK 74105
$-1,351
Cash flow
-11.1%
Cash-on-Cash Return
3.1%
Cap rate
0.5%
Rent to Value Ratio
Active
$349,800
4
bds
|
3
ba
|
2,382
sqft
|
built
2001
4805 S Mc Kinley Ave, Sand Springs, OK 74063
$-657
Cash flow
-9.8%
Cash-on-Cash Return
3.4%
Cap rate
0.5%
Rent to Value Ratio
Active
$425,000
3
bds
|
2
ba
|
1,536
sqft
|
built
1929
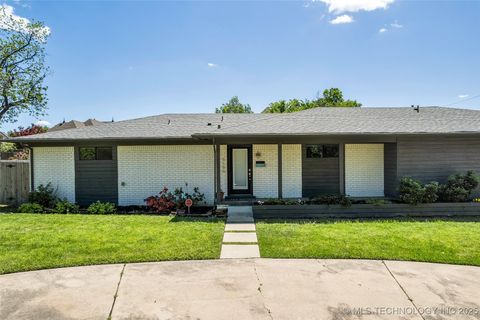
1731 S Florence Pl, Tulsa, OK 74104
$-1,013
Cash flow
-12.4%
Cash-on-Cash Return
2.8%
Cap rate
0.4%
Rent to Value Ratio
Active
$110,000
3
bds
|
2
ba
|
1,212
sqft
|
built
1950
5330 W 2nd St, Tulsa, OK 74127
$162
Cash flow
7.7%
Cash-on-Cash Return
7.5%
Cap rate
1.0%
Rent to Value Ratio
Active
$899,500
4
bds
|
5
ba
|
4,776
sqft
|
built
2003
11616 S Hudson Ct, Tulsa, OK 74137
$-2,983
Cash flow
-17.3%
Cash-on-Cash Return
1.7%
Cap rate
0.4%
Rent to Value Ratio
Active
$325,000
3
bds
|
3
ba
|
2,273
sqft
|
built
1980
1405 W Huntsville St, Broken Arrow, OK 74011
$-473
Cash flow
-7.6%
Cash-on-Cash Return
3.9%
Cap rate
0.6%
Rent to Value Ratio
Active
$875,000
4
bds
|
4
ba
|
3,539
sqft
|
built
1965
402 W Detroit St, Broken Arrow, OK 74012
$-3,338
Cash flow
-19.9%
Cash-on-Cash Return
1.1%
Cap rate
0.2%
Rent to Value Ratio
Active
$680,000
2
bds
|
2
ba
|
2,236
sqft
|
built
2014
16550 S Elwood Ave, Glenpool, OK 74033
$-1,566
Cash flow
-12.0%
Cash-on-Cash Return
2.9%
Cap rate
0.4%
Rent to Value Ratio
Active
$645,000
4
bds
|
5
ba
|
3,628
sqft
|
built
2022
16804 E 43rd St, Tulsa, OK 74134
$-1,118
Cash flow
-9.0%
Cash-on-Cash Return
3.6%
Cap rate
0.6%
Rent to Value Ratio
Active
$454,900
4
bds
|
4
ba
|
3,128
sqft
|
built
1993
1012 S Willow Ave, Broken Arrow, OK 74012
$-649
Cash flow
-7.4%
Cash-on-Cash Return
4.0%
Cap rate
0.6%
Rent to Value Ratio
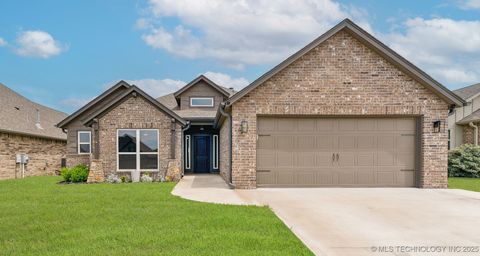
Active
$315,000
3
bds
|
2
ba
|
1,719
sqft
|
built
2021
5113 S Walnut Creek Dr, Sand Springs, OK 74063
$-554
Cash flow
-9.2%
Cash-on-Cash Return
3.6%
Cap rate
0.6%
Rent to Value Ratio
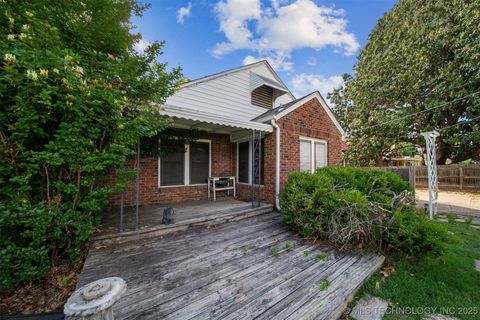
Active
$200,000
2
bds
|
1
ba
|
1,282
sqft
|
built
1942
235 E Freeport St, Broken Arrow, OK 74012
$-90
Cash flow
-2.3%
Cash-on-Cash Return
5.1%
Cap rate
0.7%
Rent to Value Ratio
Active
$89,000
2
bds
|
1
ba
|
950
sqft
|
built
1946
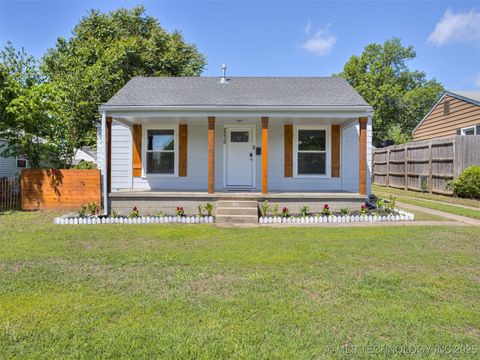
2529 N Quaker Ave, Tulsa, OK 74106
$180
Cash flow
10.6%
Cash-on-Cash Return
8.1%
Cap rate
1.0%
Rent to Value Ratio
Active
$118,000
2
bds
|
1
ba
|
1,310
sqft
|
built
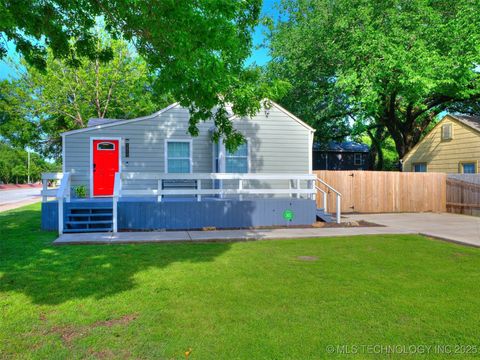
1942
321 E Apache St, Tulsa, OK 74106
$107
Cash flow
4.7%
Cash-on-Cash Return
6.8%
Cap rate
0.8%
Rent to Value Ratio
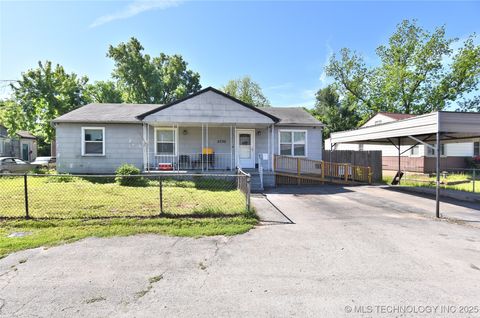
Active
$135,000
4
bds
|
1
ba
|
908
sqft
|
built
1947
108 E 27th St N, Tulsa, OK 74106
$27
Cash flow
1.0%
Cash-on-Cash Return
5.9%
Cap rate
0.7%
Rent to Value Ratio
Active
$279,900
3
bds
|
2
ba
|
1,802
sqft
|
built
1978
2640 W Fort Worth Pl, Broken Arrow, OK 74012
$-313
Cash flow
-5.8%
Cash-on-Cash Return
4.3%
Cap rate
0.6%
Rent to Value Ratio
Active
$122,000
4
bds
|
1
ba
|
1,220
sqft
|
built
1955
3149 N Hartford Ave, Tulsa, OK 74106
$78
Cash flow
3.3%
Cash-on-Cash Return
6.4%
Cap rate
0.8%
Rent to Value Ratio
Active
$748,000
4
bds
|
4
ba
|
3,360
sqft
|
built
1968
3421 E 62nd St, Tulsa, OK 74136
$-2,230
Cash flow
-15.6%
Cash-on-Cash Return
2.1%
Cap rate
0.3%
Rent to Value Ratio
Active
$265,000
3
bds
|
2
ba
|
1,878
sqft
|
built
1957
1610 E 55th Pl, Tulsa, OK 74105
$-368
Cash flow
-7.2%
Cash-on-Cash Return
4.0%
Cap rate
0.6%
Rent to Value Ratio
Active
$562,900
4
bds
|
3
ba
|
2,841
sqft
|
built
2022
12509 S 102nd East Ave, Bixby, OK 74008
$-1,447
Cash flow
-13.4%
Cash-on-Cash Return
2.6%
Cap rate
0.5%
Rent to Value Ratio

Active
$499,500
4
bds
|
3
ba
|
3,040
sqft
|
built
2009
11850 S Oswego Ave, Tulsa, OK 74137
$-601
Cash flow
-6.3%
Cash-on-Cash Return
4.2%
Cap rate
0.7%
Rent to Value Ratio
Active
$229,000
4
bds
|
2
ba
|
1,741
sqft
|
built
1949
304 E 45th Ct, Tulsa, OK 74105
$-261
Cash flow
-5.9%
Cash-on-Cash Return
4.3%
Cap rate
0.7%
Rent to Value Ratio
Active
$895,000
6
bds
|
6
ba
|
6,394
sqft
|
built
1988
10623 S Oxford Ave, Tulsa, OK 74137
$-2,190
Cash flow
-12.8%
Cash-on-Cash Return
2.7%
Cap rate
0.5%
Rent to Value Ratio
Active
$470,000
5
bds
|
4
ba
|
3,544
sqft
|
built
1998
3401 N Narcissus Ave, Broken Arrow, OK 74012
$-514
Cash flow
-5.7%
Cash-on-Cash Return
4.4%
Cap rate
0.7%
Rent to Value Ratio
Active
$199,000
2
bds
|
1
ba
|
896
sqft
|
built
1942
2236 S Marion Ave, Tulsa, OK 74114
$-123
Cash flow
-3.2%
Cash-on-Cash Return
4.9%
Cap rate
0.7%
Rent to Value Ratio
Active
$269,900
3
bds
|
1
ba
|
1,172
sqft
|
built
1960
3819 E 15th St, Tulsa, OK 74112
$-428
Cash flow
-8.3%
Cash-on-Cash Return
3.8%
Cap rate
0.6%
Rent to Value Ratio
Active
$278,900
3
bds
|
2
ba
|
1,792
sqft
|
built
1964
9123 E 38th St, Tulsa, OK 74145
$-467
Cash flow
-8.7%
Cash-on-Cash Return
3.7%
Cap rate
0.6%
Rent to Value Ratio
Active
$334,900
5
bds
|
4
ba
|
2,592
sqft
|
built
2006
2615 S 15th Pl, Broken Arrow, OK 74012
$-303
Cash flow
-4.7%
Cash-on-Cash Return
4.6%
Cap rate
0.7%
Rent to Value Ratio

Active
$889,000
4
bds
|
5
ba
|
4,181
sqft
|
built
2022
2611 E 136th St S, Bixby, OK 74008
$-2,915
Cash flow
-17.1%
Cash-on-Cash Return
1.7%
Cap rate
0.4%
Rent to Value Ratio