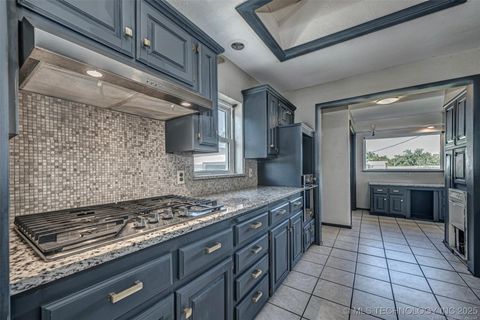
Oklahoma City, OK Investment Properties for Sale
Browse homes for sale and investment properties in Oklahoma City, OK. Refine your search by price, property type, or more.
Best cash flowing properties in Oklahoma City, OK
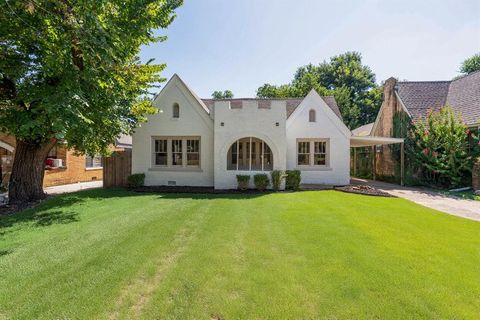
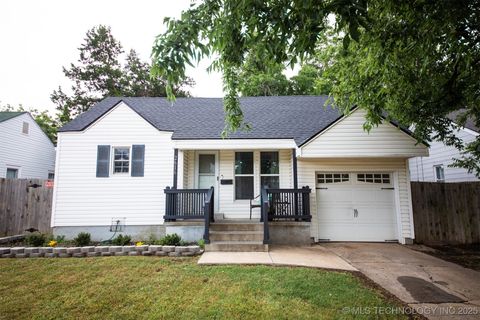
Active
$230,000
3
bds
|
2
ba
|
1,463
sqft
|
built
1929
2316 N Barnes Ave, Oklahoma City, OK 73107
$154
Cash flow
3.5%
Cash-on-Cash Return
6.5%
Cap rate
0.8%
Rent to Value Ratio
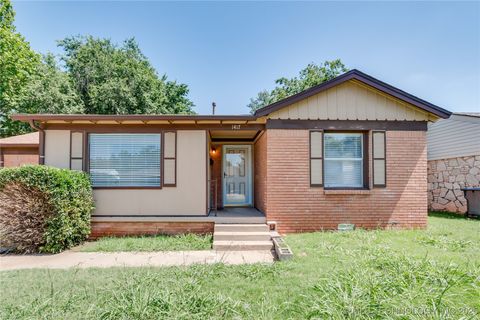
Active
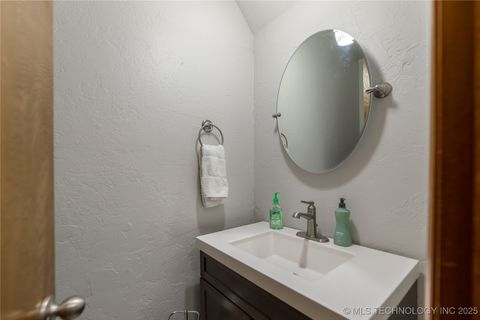
$156,900
2
bds
|
1
ba
|
902
sqft
|
built
1950
1417 Downing St, Oklahoma City, OK 73120
$120
Cash flow
4.0%
Cash-on-Cash Return
6.6%
Cap rate
0.9%
Rent to Value Ratio
8 out of 10 properties for sale in Oklahoma City, OK
Limited Results Shown
Create a free account, or log in to reveal all property listings and enjoy the complete experience.
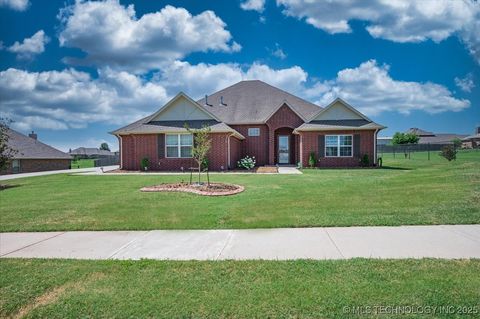
Active
$539,000
5
bds
|
3
ba
|
3,306
sqft
|
built
2012
5800 SE 142nd St, Oklahoma City, OK 73165
$-951
Cash flow
-9.2%
Cash-on-Cash Return
3.6%
Cap rate
0.6%
Rent to Value Ratio
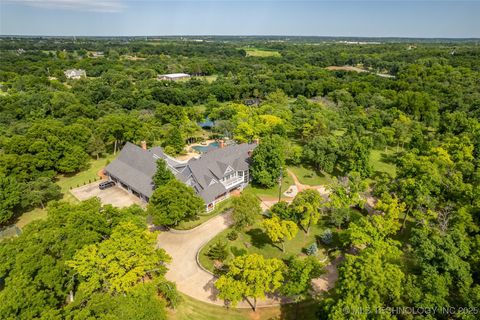
Active
$5,500,000
4
bds
|
7
ba
|
10,891
sqft
|
built
1987
2701 Twin Creek Dr, Oklahoma City, OK 73131
$-24,417
Cash flow
-23.2%
Cash-on-Cash Return
0.4%
Cap rate
0.1%
Rent to Value Ratio
Active
$571,500
3
bds
|
5
ba
|
4,755
sqft
|
built
1980
2202 NW 45th St, Oklahoma City, OK 73112
$-1,439
Cash flow
-13.1%
Cash-on-Cash Return
2.7%
Cap rate
0.4%
Rent to Value Ratio
Active
$229,900
3
bds
|
2
ba
|
1,474
sqft
|
built
1949
2616 NW 33rd St, Oklahoma City, OK 73112
$-197
Cash flow
-4.5%
Cash-on-Cash Return
4.7%
Cap rate
0.7%
Rent to Value Ratio
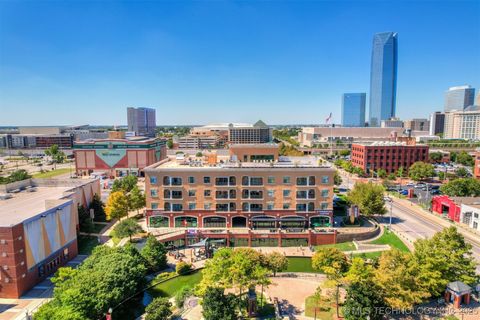
Active
$674,999
2
bds
|
3
ba
|
1,959
sqft
|
built
2008
200 S Oklahoma Ave, Oklahoma City, OK 73104
$-2,799
Cash flow
-21.6%
Cash-on-Cash Return
0.7%
Cap rate
0.5%
Rent to Value Ratio
Active
$265,000
2
bds
|
2
ba
|
1,340
sqft
|
built
1946
804 S Sooner Rd, Oklahoma City, OK 73110
$-266
Cash flow
-5.2%
Cash-on-Cash Return
4.5%
Cap rate
0.6%
Rent to Value Ratio