Oklahoma City, OK Investment Properties for Sale
Browse homes for sale and investment properties in Oklahoma City, OK. Refine your search by price, property type, or more.
Best cash flowing properties in Oklahoma City, OK
Active
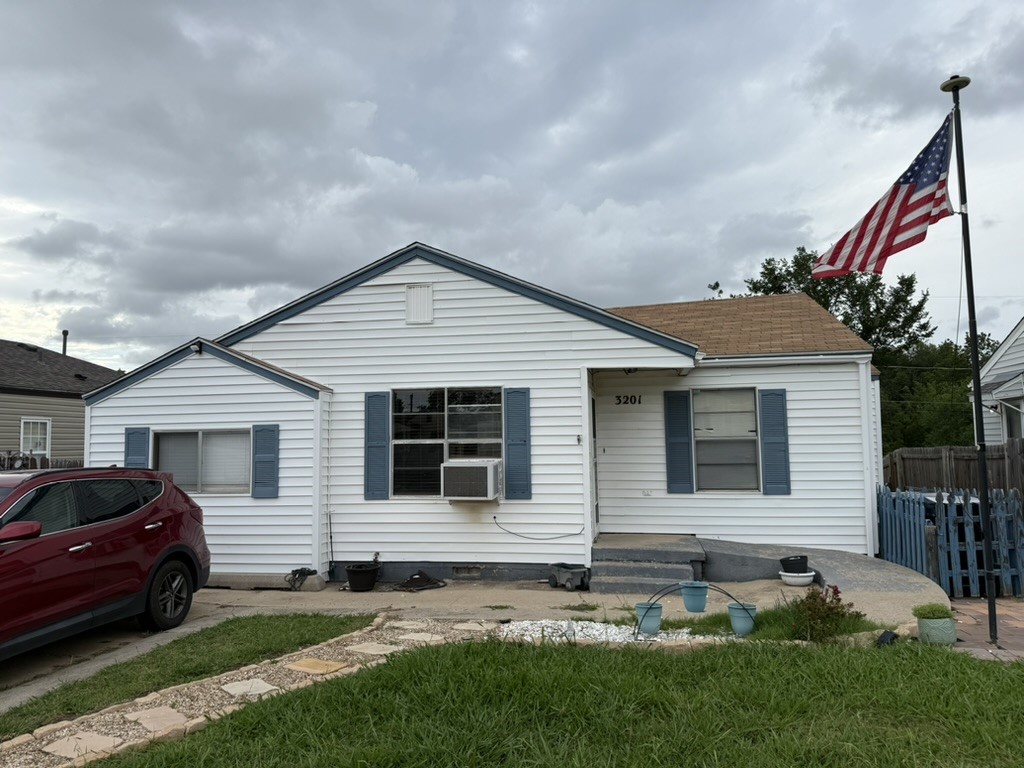
$119,000
3
bds
|
1
ba
|
0
sqft
|
built
1948
3201 NW 32nd St, Oklahoma City, OK 73112
$263
Cash flow
11.5%
Cash-on-Cash Return
8.9%
Cap rate
1.2%
Rent to Value Ratio
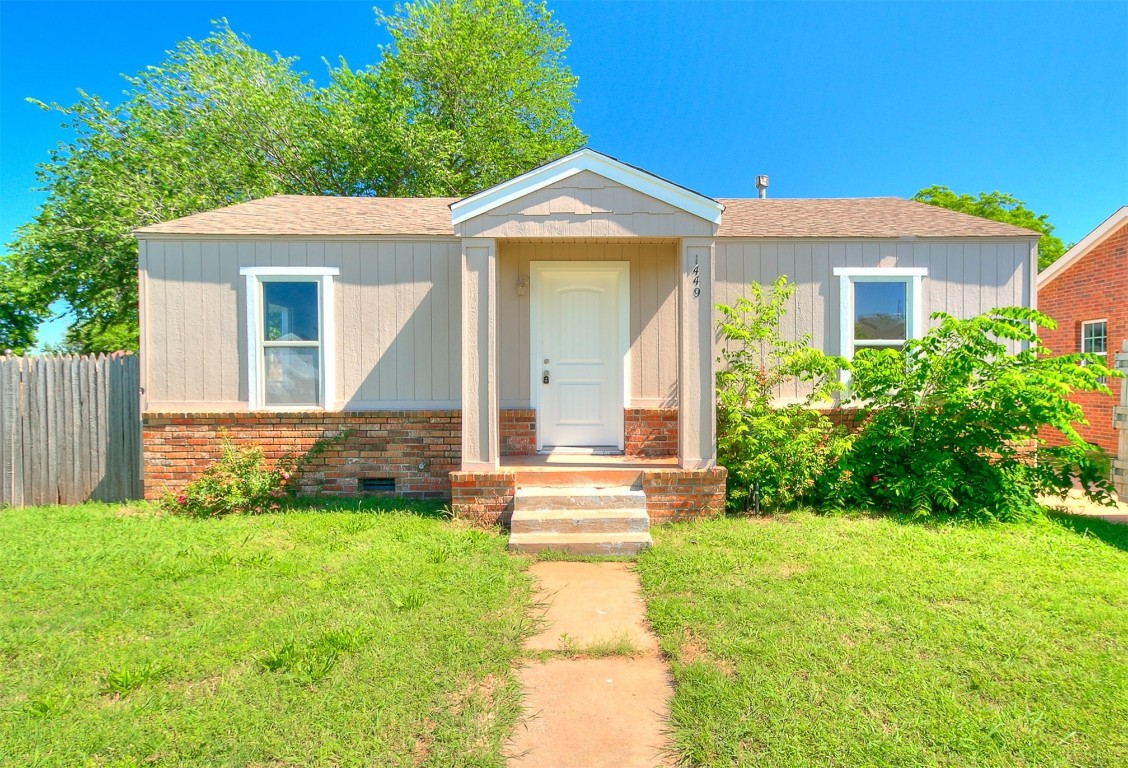
Pending
$125,000
2
bds
|
1
ba
|
0
sqft
|
built
1946
1449 NW 94th St, Oklahoma City, OK 73114
$183
Cash flow
7.6%
Cash-on-Cash Return
8.0%
Cap rate
1.0%
Rent to Value Ratio
1,305 out of 1,668 properties for sale in Oklahoma City, OK
Limited Results Shown
Create a free account, or log in to reveal all property listings and enjoy the complete experience.
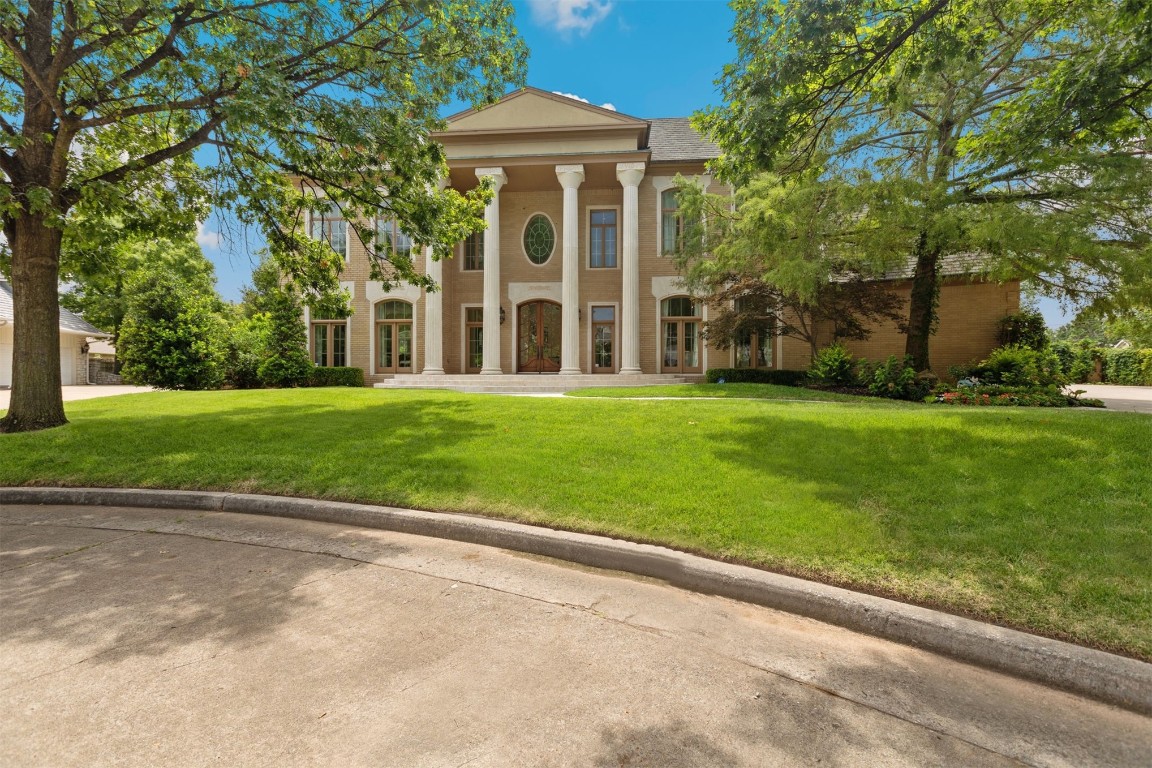
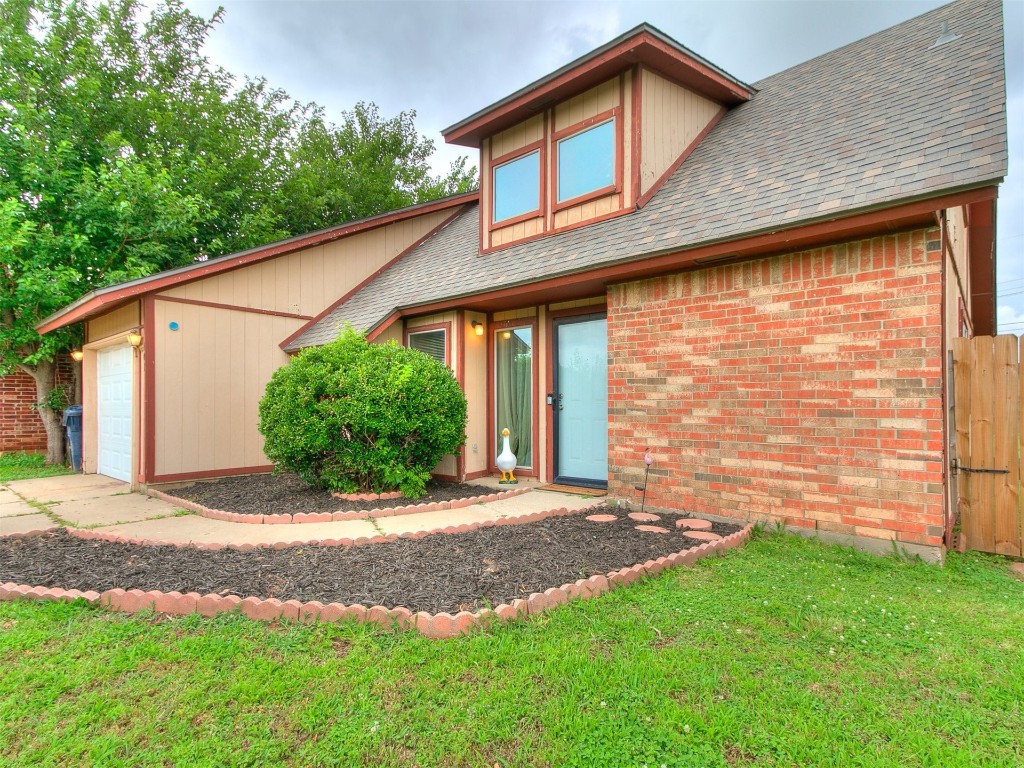
Active
$495,000
4
bds
|
2
ba
|
0
sqft
|
built
1910
904 NW 19th St, Oklahoma City, OK 73106
$-927
Cash flow
-9.8%
Cash-on-Cash Return
4.0%
Cap rate
0.6%
Rent to Value Ratio
Active
$995,000
4
bds
|
5
ba
|
0
sqft
|
built
1994
4800 Bocage Pl, Oklahoma City, OK 73142
$-2,875
Cash flow
-15.1%
Cash-on-Cash Return
2.8%
Cap rate
0.5%
Rent to Value Ratio
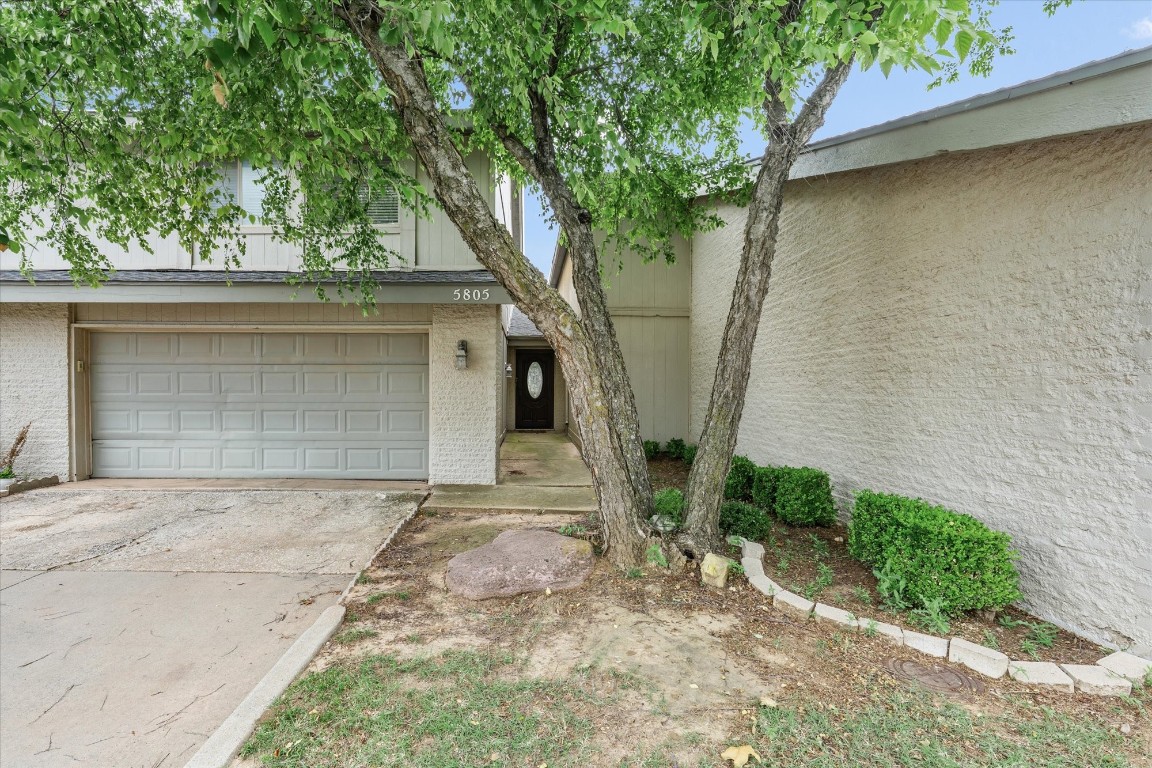
Active
$187,900
2
bds
|
3
ba
|
0
sqft
|
built
1975
5805 Hefner Village Ct, Oklahoma City, OK 73162
$-310
Cash flow
-8.6%
Cash-on-Cash Return
4.3%
Cap rate
0.9%
Rent to Value Ratio
Active
$212,000
3
bds
|
2
ba
|
0
sqft
|
built
1983
401 NW 120th St, Oklahoma City, OK 73114
$-95
Cash flow
-2.3%
Cash-on-Cash Return
5.7%
Cap rate
0.8%
Rent to Value Ratio
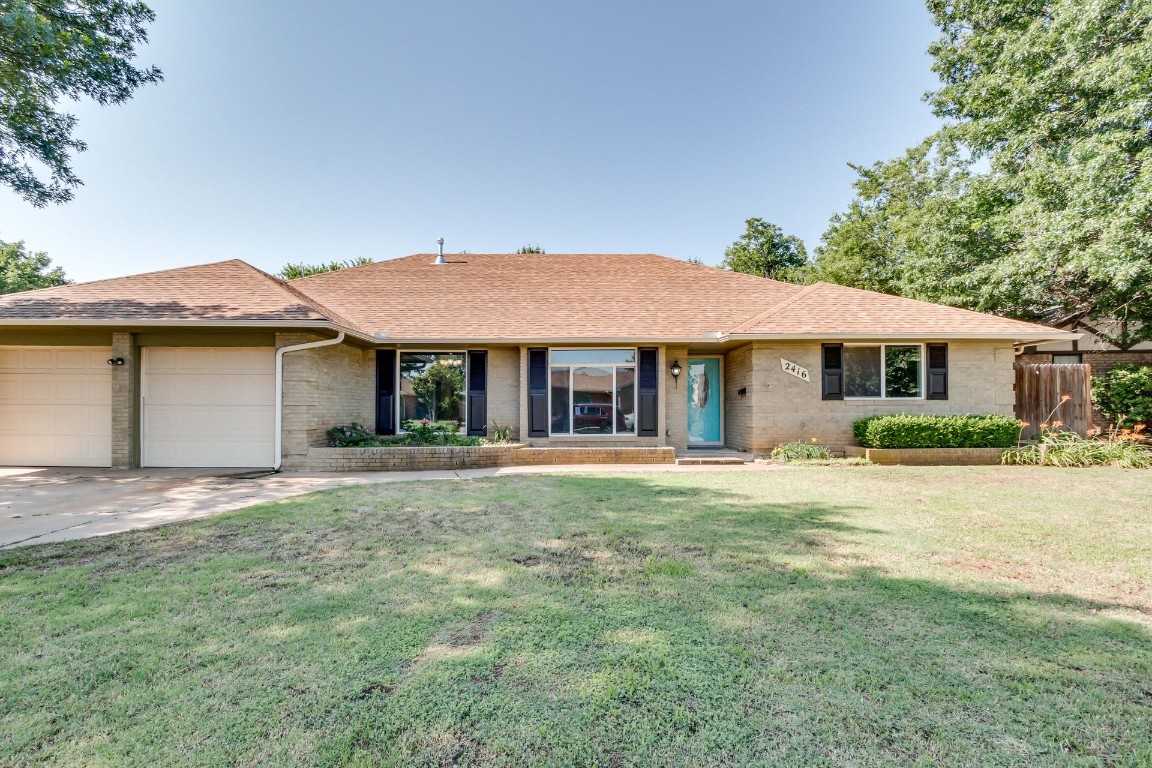
Active
$307,000
4
bds
|
3
ba
|
0
sqft
|
built
1970
2416 NW 115th St, Oklahoma City, OK 73120
$-441
Cash flow
-7.5%
Cash-on-Cash Return
4.6%
Cap rate
0.6%
Rent to Value Ratio
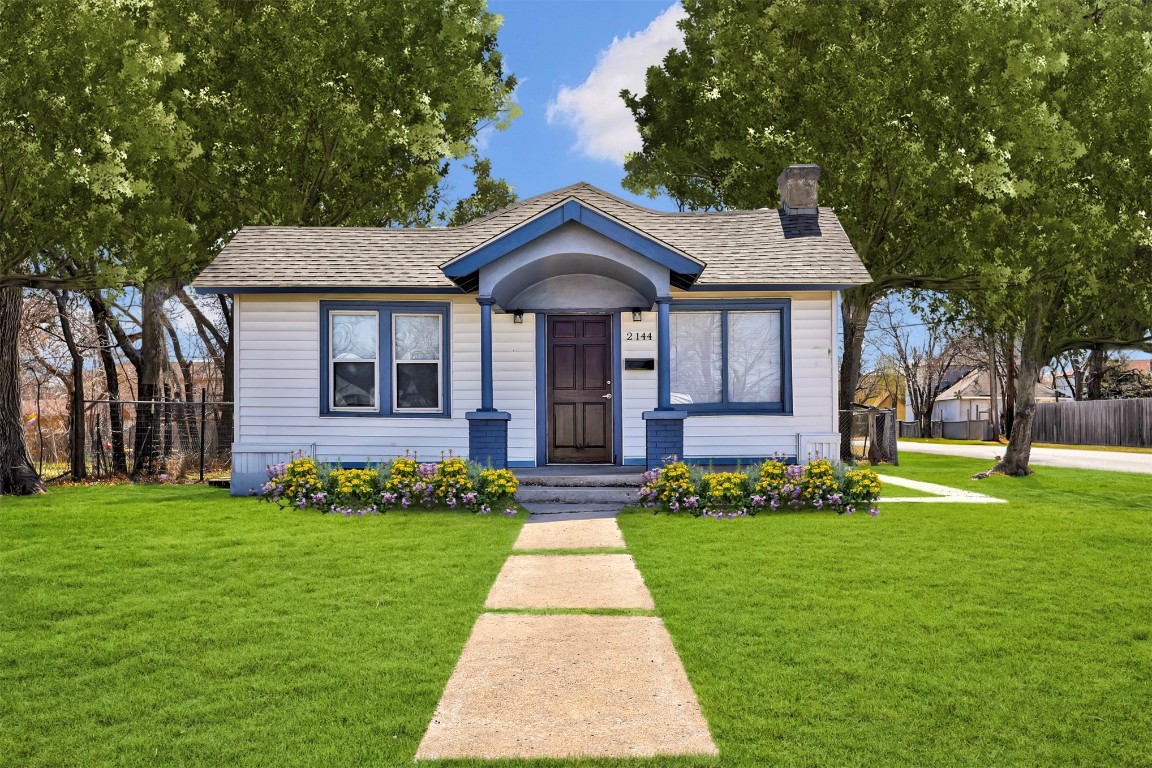
Active
$129,900
2
bds
|
1
ba
|
0
sqft
|
built
1929
2144 NW 32nd St, Oklahoma City, OK 73112
$119
Cash flow
4.8%
Cash-on-Cash Return
7.4%
Cap rate
1.0%
Rent to Value Ratio
Active
$205,999
2
bds
|
3
ba
|
0
sqft
|
built
1978
7817 Old Hickory Ln, Oklahoma City, OK 73116
$-358
Cash flow
-9.1%
Cash-on-Cash Return
4.2%
Cap rate
0.8%
Rent to Value Ratio
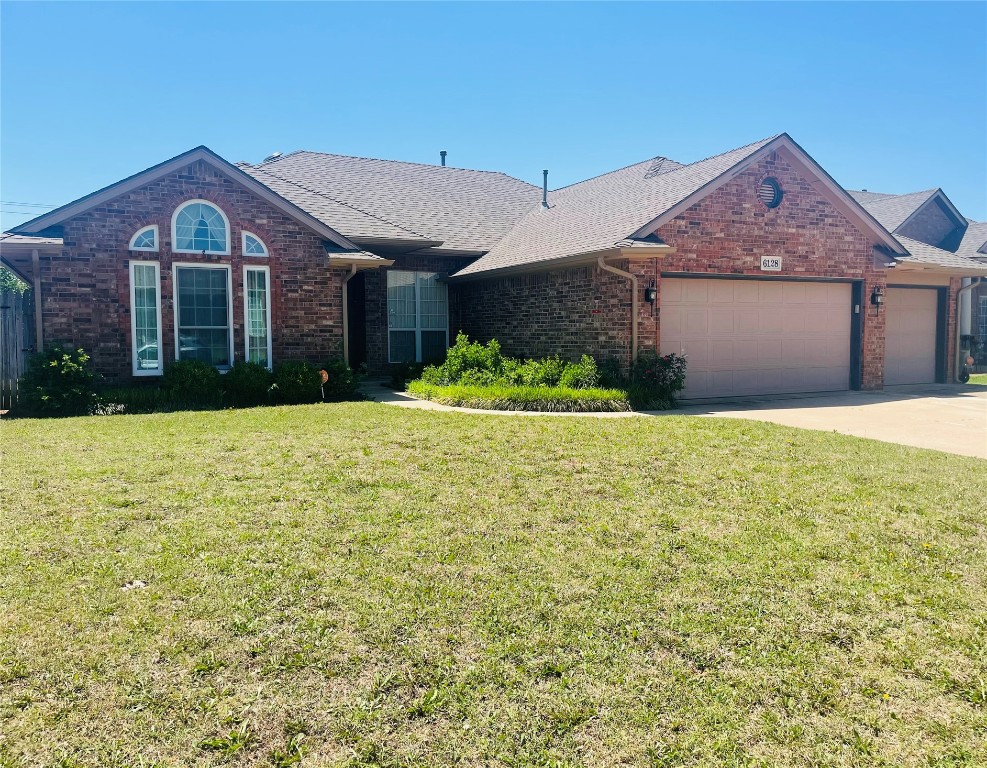
Active
$285,000
4
bds
|
2
ba
|
0
sqft
|
built
1998
6128 SE 58th St, Oklahoma City, OK 73135
$-294
Cash flow
-5.4%
Cash-on-Cash Return
5.0%
Cap rate
0.7%
Rent to Value Ratio
Active
$100,000
3
bds
|
3
ba
|
0
sqft
|
built
1940
2904 S Indiana Ave, Oklahoma City, OK 73108
$-147
Cash flow
-7.7%
Cash-on-Cash Return
4.5%
Cap rate
0.6%
Rent to Value Ratio
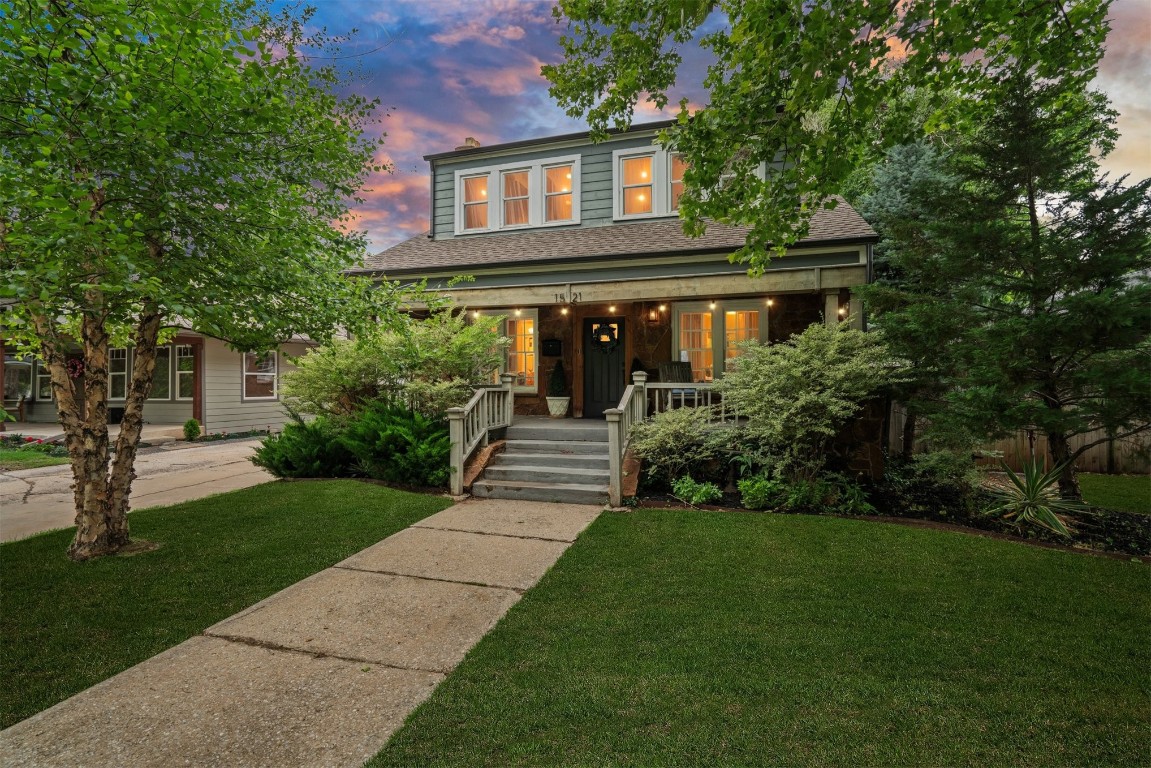
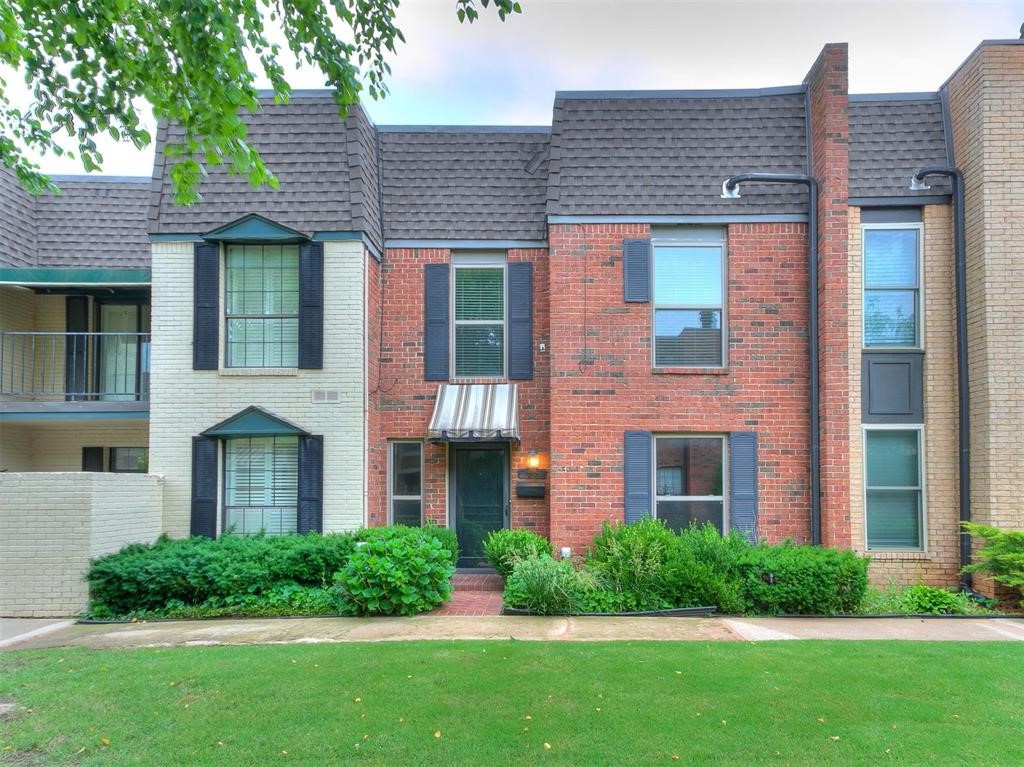
Active
$365,000
4
bds
|
3
ba
|
0
sqft
|
built
1914
1521 NW 34th St, Oklahoma City, OK 73118
$-505
Cash flow
-7.2%
Cash-on-Cash Return
4.6%
Cap rate
0.7%
Rent to Value Ratio
Active
$115,000
2
bds
|
2
ba
|
0
sqft
|
built
1979
9524 Westgate Rd, Oklahoma City, OK 73162
$26
Cash flow
1.2%
Cash-on-Cash Return
6.6%
Cap rate
1.2%
Rent to Value Ratio
Pending
$190,000
3
bds
|
2
ba
|
0
sqft
|
built
1963
525 SW 68th St, Oklahoma City, OK 73139
$-103
Cash flow
-2.8%
Cash-on-Cash Return
5.6%
Cap rate
0.8%
Rent to Value Ratio
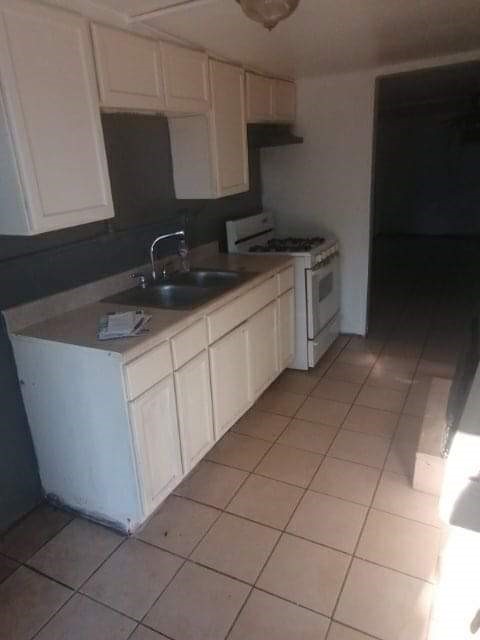
Active
$79,000
3
bds
|
2
ba
|
0
sqft
|
built
1975
2628 N Ann Arbor Ave, Oklahoma City, OK 73127
$-32
Cash flow
-2.1%
Cash-on-Cash Return
5.8%
Cap rate
1.5%
Rent to Value Ratio
Active
$1,150,000
4
bds
|
4
ba
|
0
sqft
|
built
2021
1700 Runway Blvd, Oklahoma City, OK 73108
$-5,097
Cash flow
-23.1%
Cash-on-Cash Return
1.0%
Cap rate
0.3%
Rent to Value Ratio
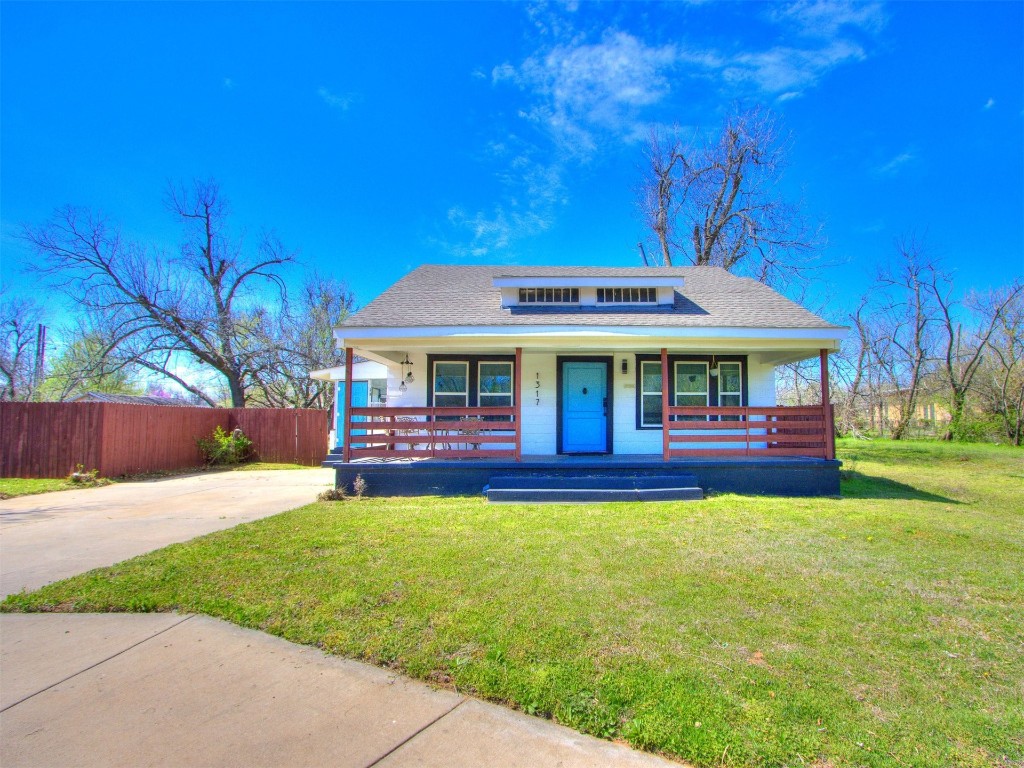
Active
$282,500
3
bds
|
2
ba
|
0
sqft
|
built
1969
1317 N Wisconsin Ave, Oklahoma City, OK 73117
$-346
Cash flow
-6.4%
Cash-on-Cash Return
4.8%
Cap rate
0.7%
Rent to Value Ratio
Active
$330,000
4
bds
|
4
ba
|
0
sqft
|
built
1971
2317 NW 119th St, Oklahoma City, OK 73120
$-546
Cash flow
-8.6%
Cash-on-Cash Return
4.3%
Cap rate
0.6%
Rent to Value Ratio
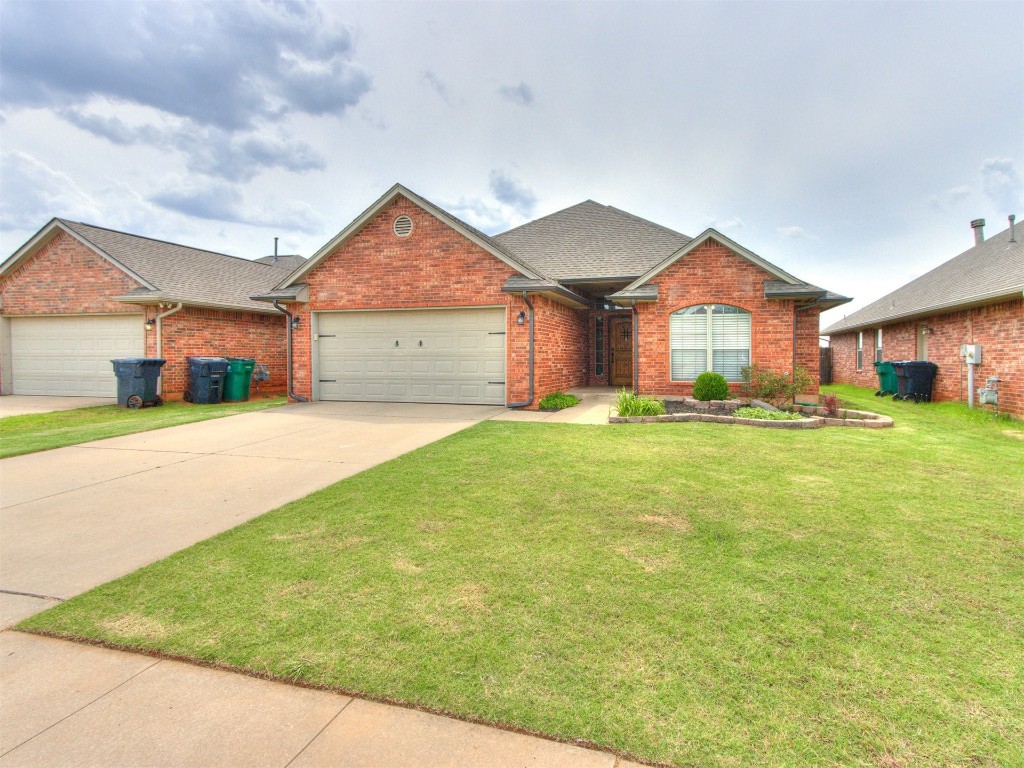
Pending
$229,000
3
bds
|
2
ba
|
0
sqft
|
built
2005
12005 N Francis Ave, Oklahoma City, OK 73114
$-315
Cash flow
-7.2%
Cash-on-Cash Return
4.6%
Cap rate
0.7%
Rent to Value Ratio
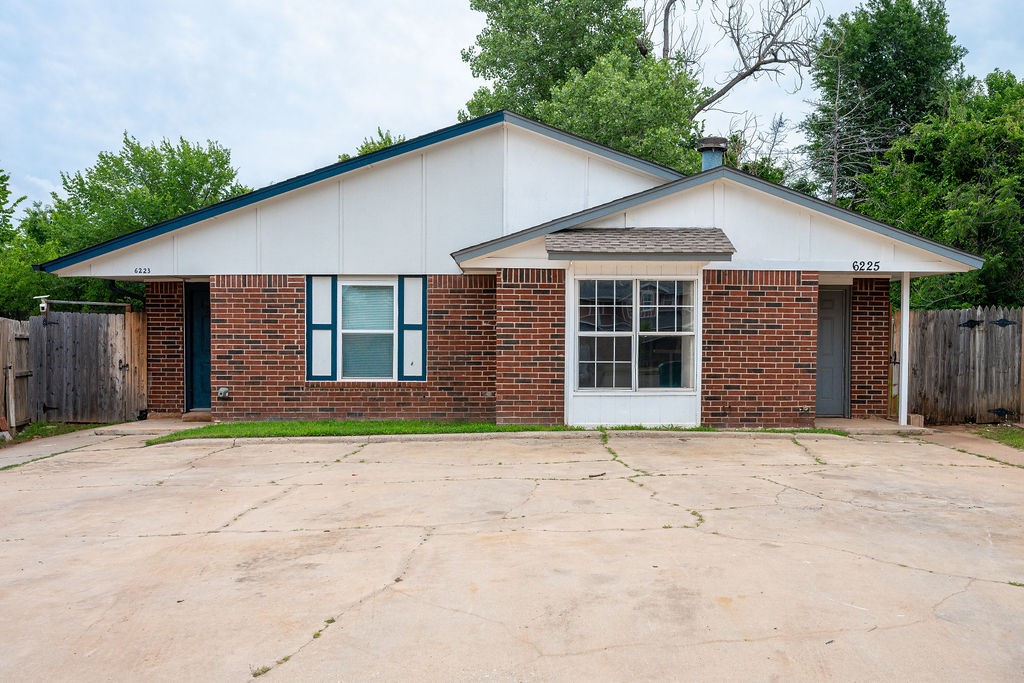
Active
$95,000
2
bds
|
2
ba
|
0
sqft
|
built
1984
6225 SE 46th St, Oklahoma City, OK 73135
$163
Cash flow
9.0%
Cash-on-Cash Return
8.3%
Cap rate
1.2%
Rent to Value Ratio
Active
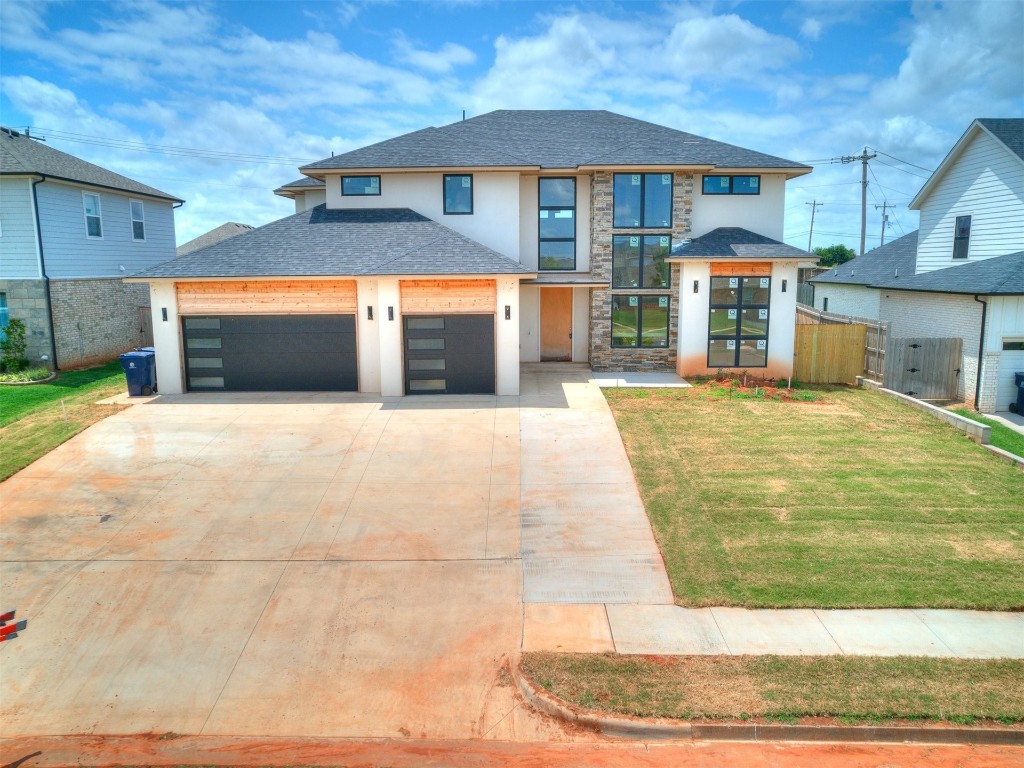
$700,000
5
bds
|
5
ba
|
0
sqft
|
built
2024
8924 NW 130th St, Oklahoma City, OK 73142
$-1,190
Cash flow
-8.9%
Cash-on-Cash Return
4.2%
Cap rate
0.6%
Rent to Value Ratio
Active
$905,000
4
bds
|
4
ba
|
0
sqft
|
built
2023
6524 NE 96th Cir, Oklahoma City, OK 73151
$-2,424
Cash flow
-14.0%
Cash-on-Cash Return
3.1%
Cap rate
0.4%
Rent to Value Ratio
Active
$750,000
4
bds
|
4
ba
|
0
sqft
|
built
1968
4901 NW 34th St, Oklahoma City, OK 73122
$-2,180
Cash flow
-15.2%
Cash-on-Cash Return
2.8%
Cap rate
0.5%
Rent to Value Ratio
Pending
$125,000
2
bds
|
1
ba
|
0
sqft
|
built
1946
1449 NW 94th St, Oklahoma City, OK 73114
$183
Cash flow
7.6%
Cash-on-Cash Return
8.0%
Cap rate
1.0%
Rent to Value Ratio
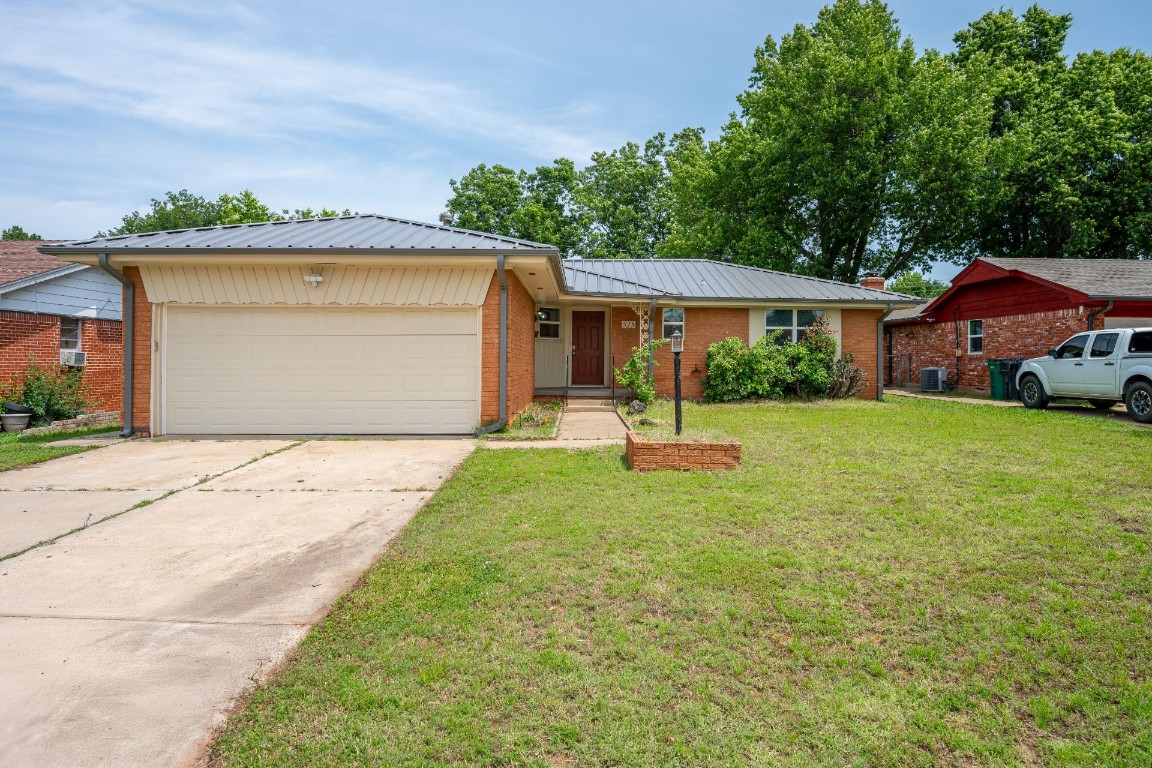
Active
$190,000
2
bds
|
1
ba
|
0
sqft
|
built
1954
3029 NW 65th St, Oklahoma City, OK 73116
$-113
Cash flow
-3.1%
Cash-on-Cash Return
5.6%
Cap rate
0.8%
Rent to Value Ratio
Active
$289,900
2
bds
|
1
ba
|
0
sqft
|
built
1936
5905 NW 50th St, Oklahoma City, OK 73122
$-441
Cash flow
-7.9%
Cash-on-Cash Return
4.5%
Cap rate
0.6%
Rent to Value Ratio
Active
$564,975
4
bds
|
4
ba
|
0
sqft
|
built
2018
7201 SW 122nd St, Oklahoma City, OK 73173
$-1,624
Cash flow
-15.0%
Cash-on-Cash Return
2.8%
Cap rate
0.5%
Rent to Value Ratio
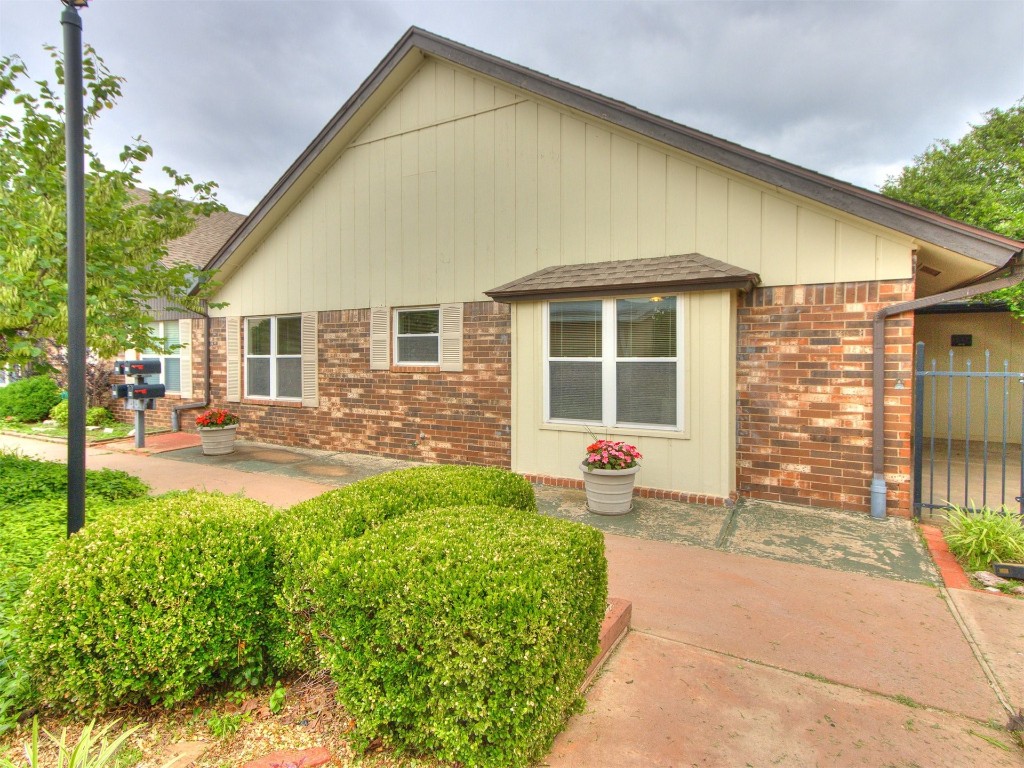
Active
$119,000
3
bds
|
1
ba
|
0
sqft
|
built
1948
3201 NW 32nd St, Oklahoma City, OK 73112
$263
Cash flow
11.5%
Cash-on-Cash Return
8.9%
Cap rate
1.2%
Rent to Value Ratio
Active
$460,000
4
bds
|
3
ba
|
0
sqft
|
built
2005
1501 SW 131st St, Oklahoma City, OK 73170
$-956
Cash flow
-10.8%
Cash-on-Cash Return
3.8%
Cap rate
0.6%
Rent to Value Ratio
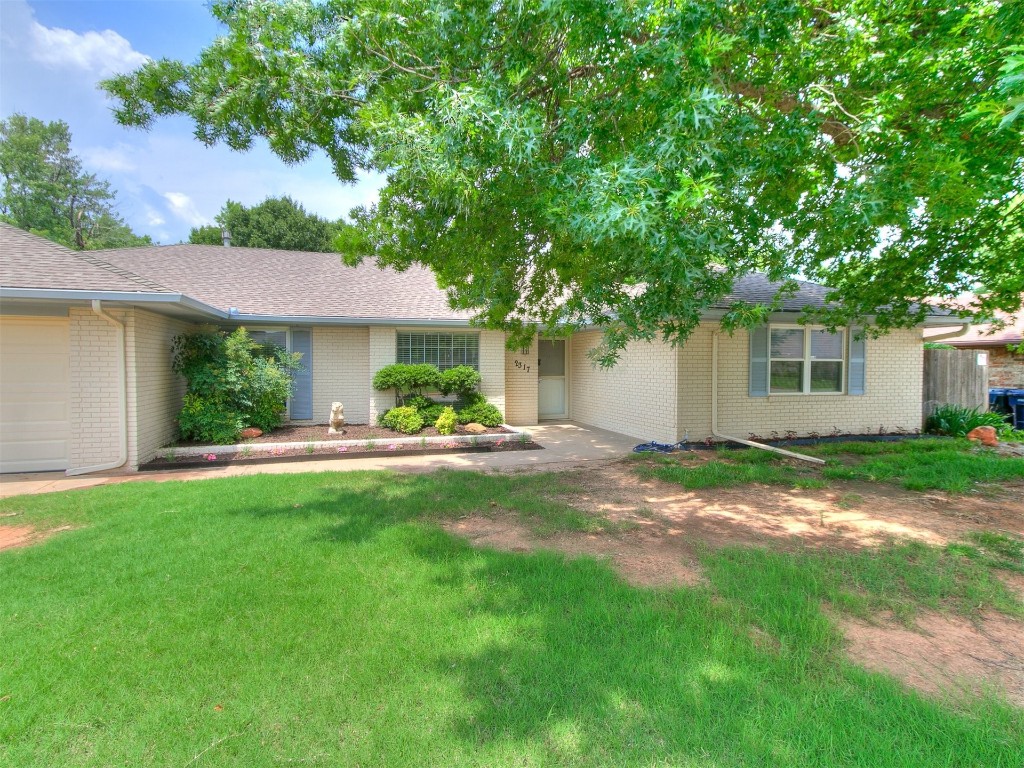
Active
$289,900
3
bds
|
2
ba
|
0
sqft
|
built
1976
10300 Ryecroft Rd, Oklahoma City, OK 73162
$-349
Cash flow
-6.3%
Cash-on-Cash Return
4.8%
Cap rate
0.7%
Rent to Value Ratio
Active
$449,900
4
bds
|
3
ba
|
0
sqft
|
built
2000
3221 Walden Ave, Oklahoma City, OK 73179
$-787
Cash flow
-9.1%
Cash-on-Cash Return
4.2%
Cap rate
0.6%
Rent to Value Ratio
Active
$224,900
3
bds
|
2
ba
|
0
sqft
|
built
2006
15620 Ivy Hill Dr, Oklahoma City, OK 73170
$-353
Cash flow
-8.2%
Cash-on-Cash Return
4.4%
Cap rate
0.7%
Rent to Value Ratio
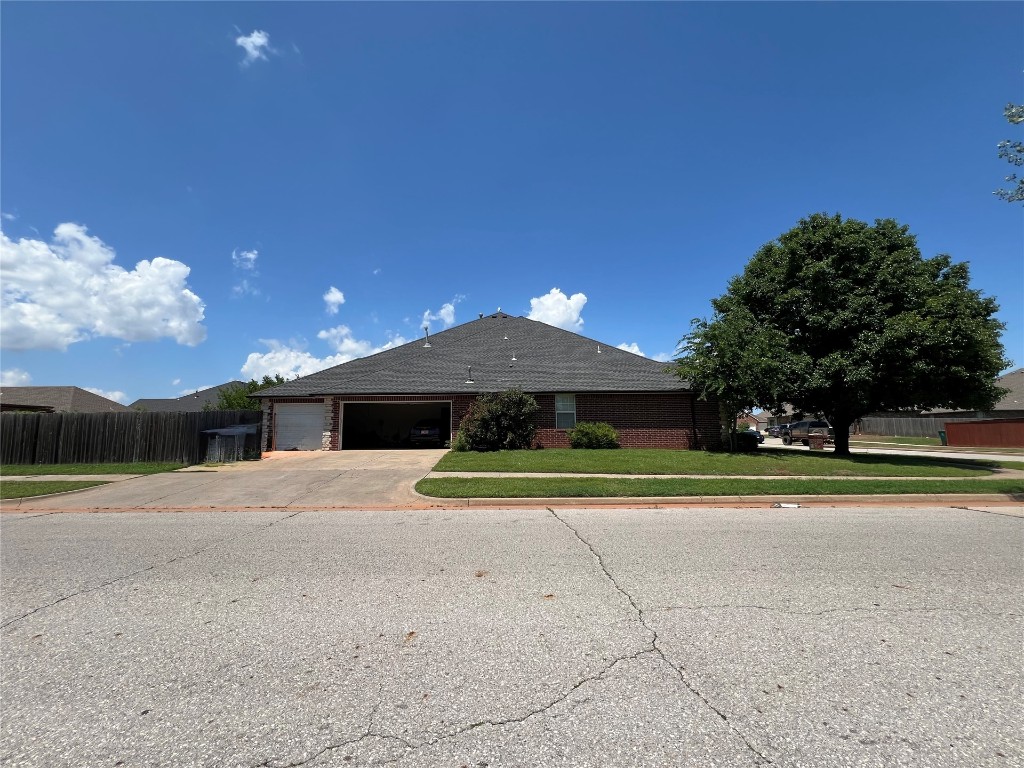
Pending
$215,000
2
bds
|
2
ba
|
0
sqft
|
built
1959
4117 NW 62nd St, Oklahoma City, OK 73112
$-197
Cash flow
-4.8%
Cash-on-Cash Return
5.2%
Cap rate
0.7%
Rent to Value Ratio
Active
$249,900
3
bds
|
2
ba
|
0
sqft
|
built
2006
5109 SE 80th St, Oklahoma City, OK 73135
$-357
Cash flow
-7.5%
Cash-on-Cash Return
4.6%
Cap rate
0.7%
Rent to Value Ratio
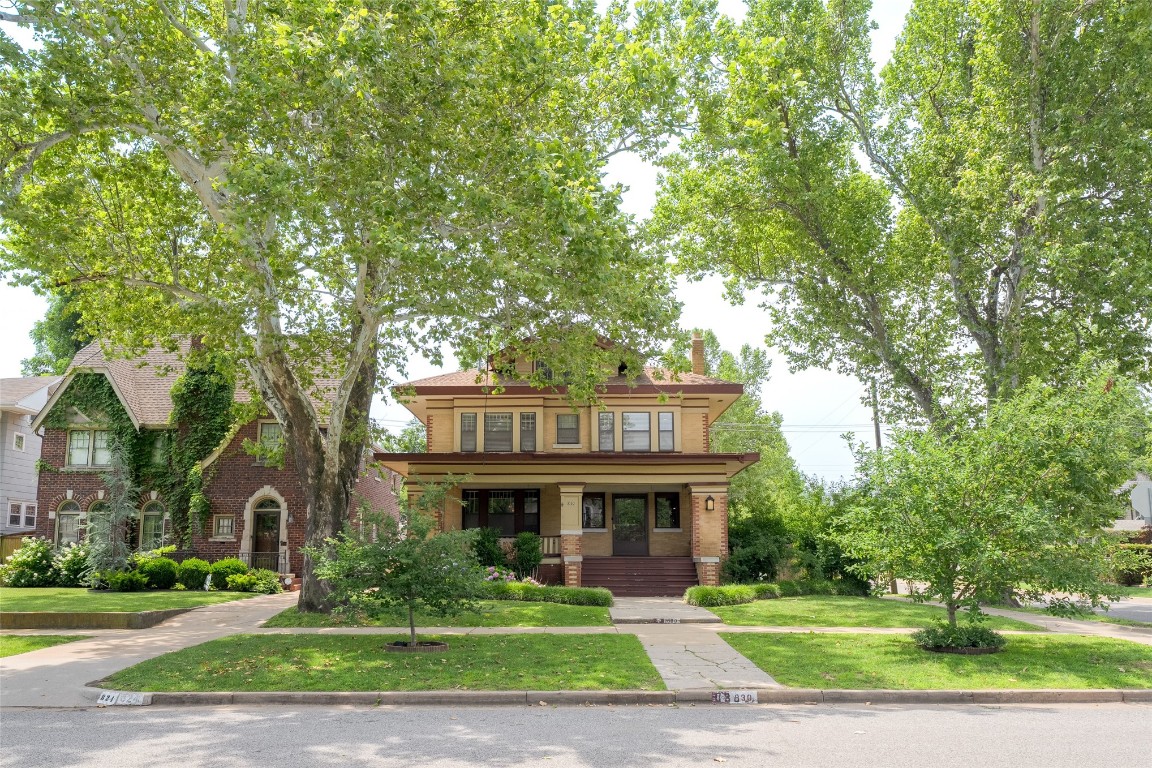
Active
$885,000
6
bds
|
4
ba
|
0
sqft
|
built
1914
830 NW 17th St, Oklahoma City, OK 73106
$-2,420
Cash flow
-14.3%
Cash-on-Cash Return
3.0%
Cap rate
0.5%
Rent to Value Ratio
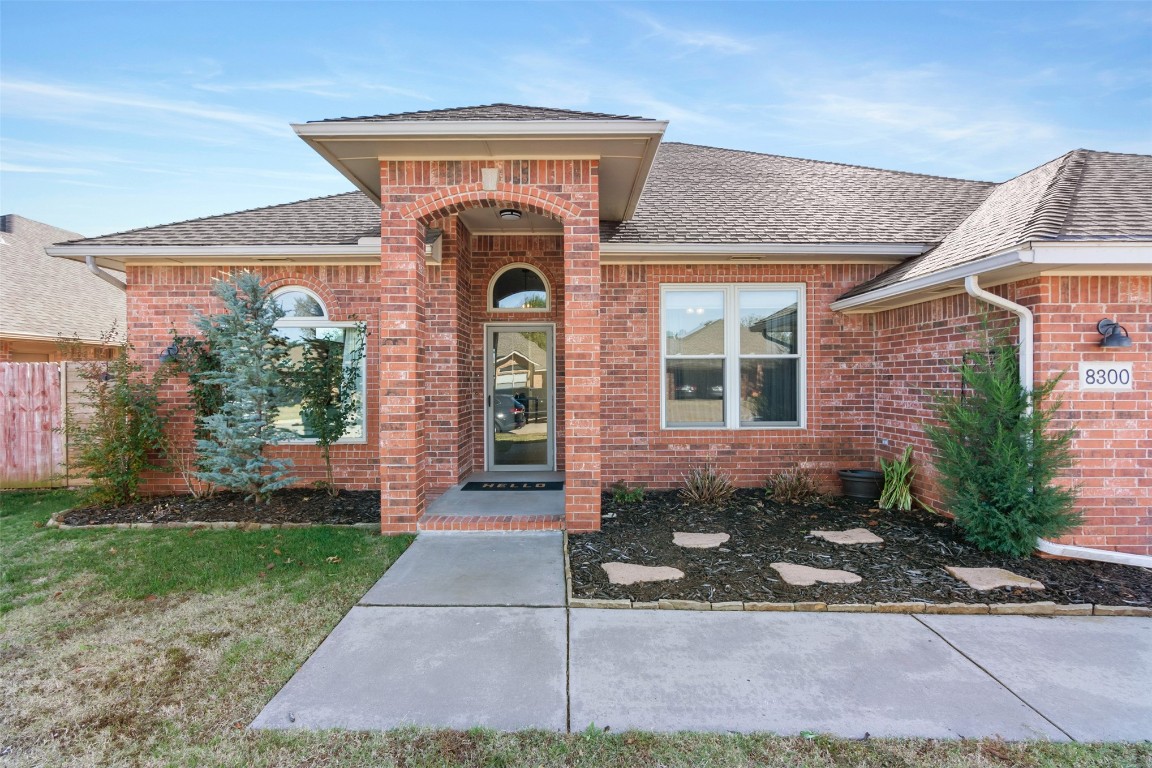
Active
$299,999
3
bds
|
2
ba
|
0
sqft
|
built
2001
8300 NW 71st St, Oklahoma City, OK 73132
$-314
Cash flow
-5.5%
Cash-on-Cash Return
5.0%
Cap rate
0.7%
Rent to Value Ratio
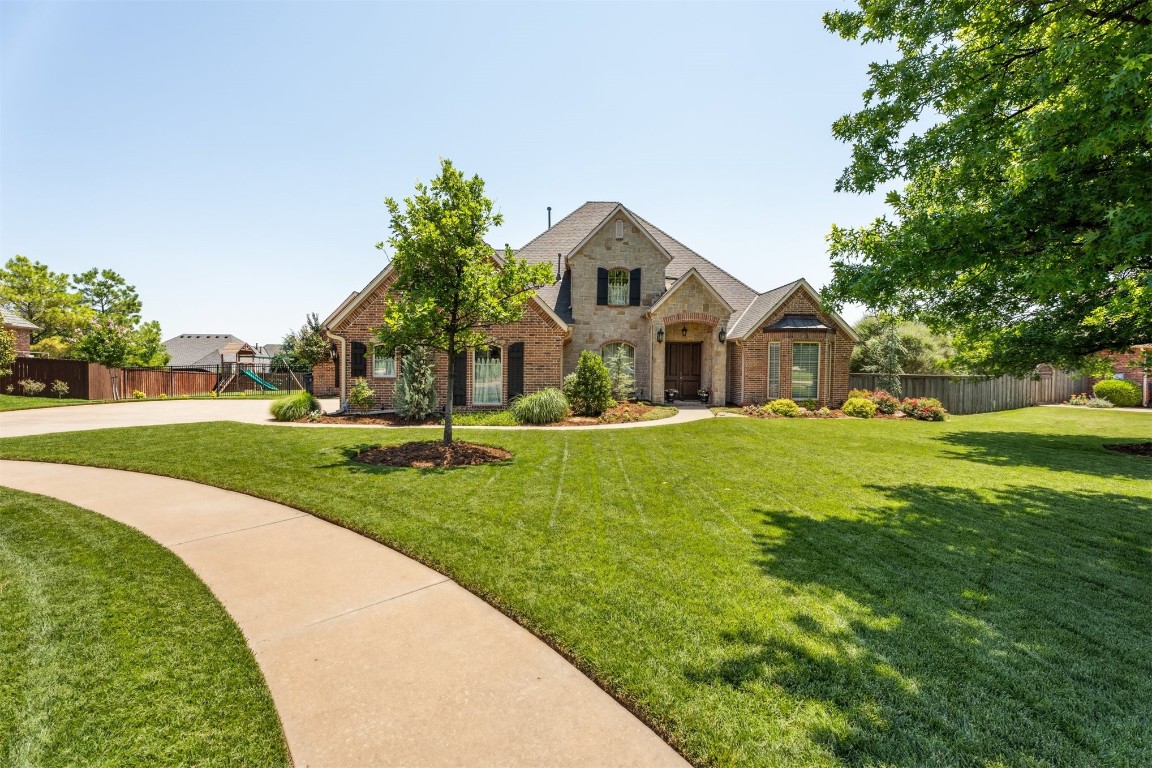
Active
$675,000
4
bds
|
5
ba
|
0
sqft
|
built
2004
5616 NW 132nd St, Oklahoma City, OK 73142
$-2,110
Cash flow
-16.3%
Cash-on-Cash Return
2.5%
Cap rate
0.5%
Rent to Value Ratio
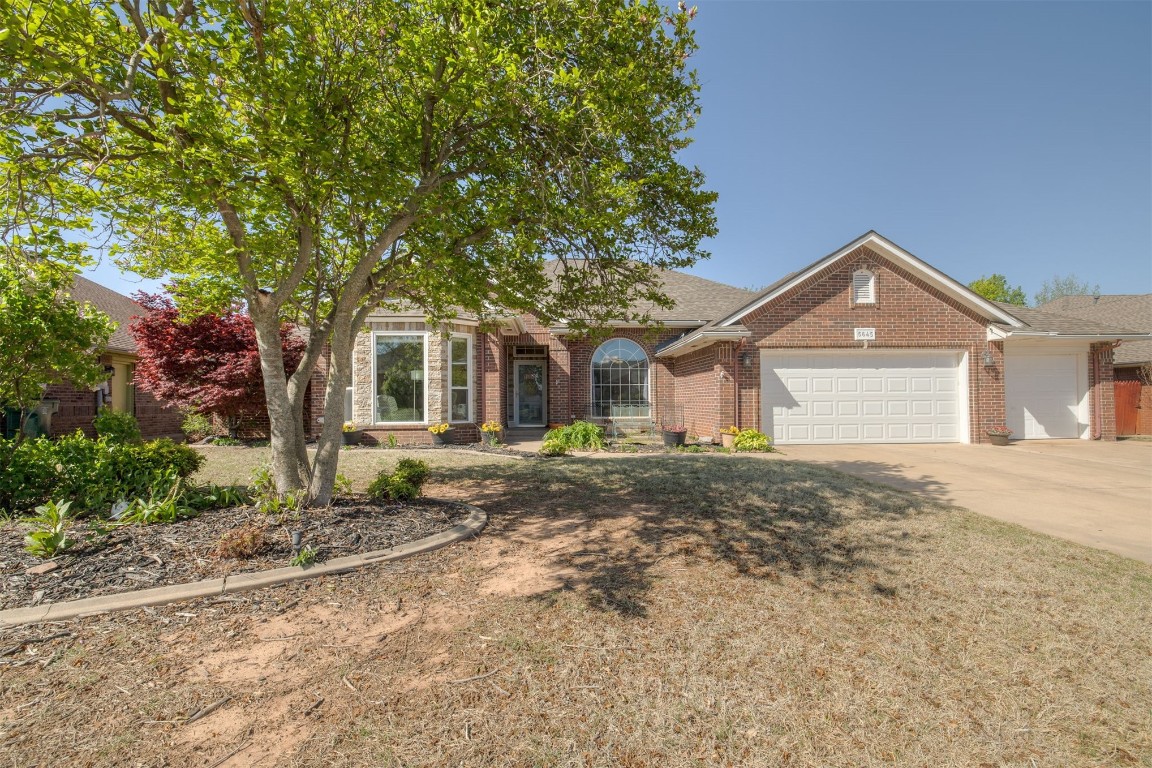
Pending
$350,000
4
bds
|
3
ba
|
0
sqft
|
built
1992
5645 Greenview Dr, Oklahoma City, OK 73135
$-596
Cash flow
-8.9%
Cash-on-Cash Return
4.2%
Cap rate
0.6%
Rent to Value Ratio
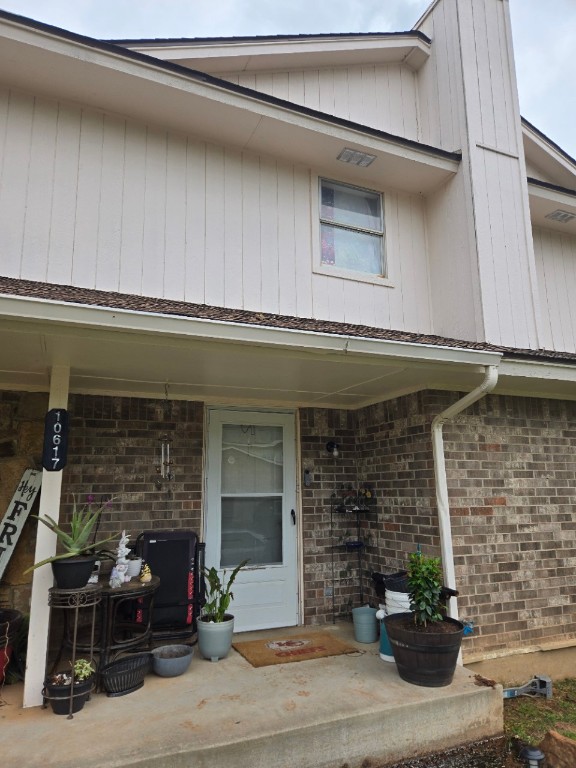
Pending
$163,000
2
bds
|
3
ba
|
0
sqft
|
built
1984
10617 White Oak Canyon Rd, Oklahoma City, OK 73162
$-28
Cash flow
-0.9%
Cash-on-Cash Return
6.1%
Cap rate
0.9%
Rent to Value Ratio
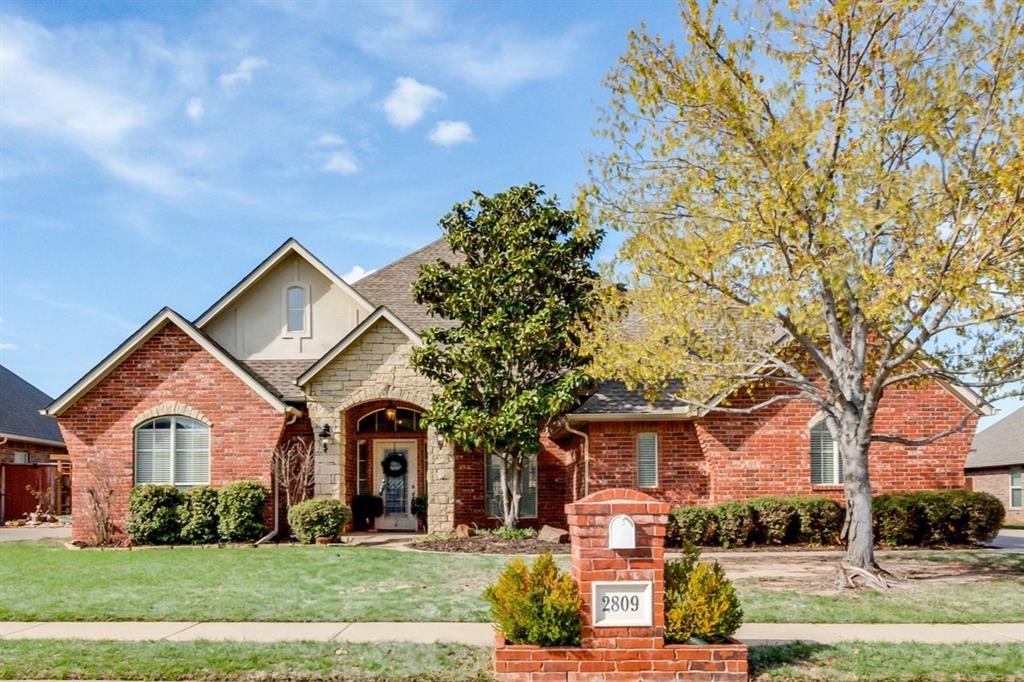
Active
$520,000
4
bds
|
3
ba
|
0
sqft
|
built
2004
2809 SW 136th St, Oklahoma City, OK 73170
$-1,014
Cash flow
-10.2%
Cash-on-Cash Return
3.9%
Cap rate
0.6%
Rent to Value Ratio
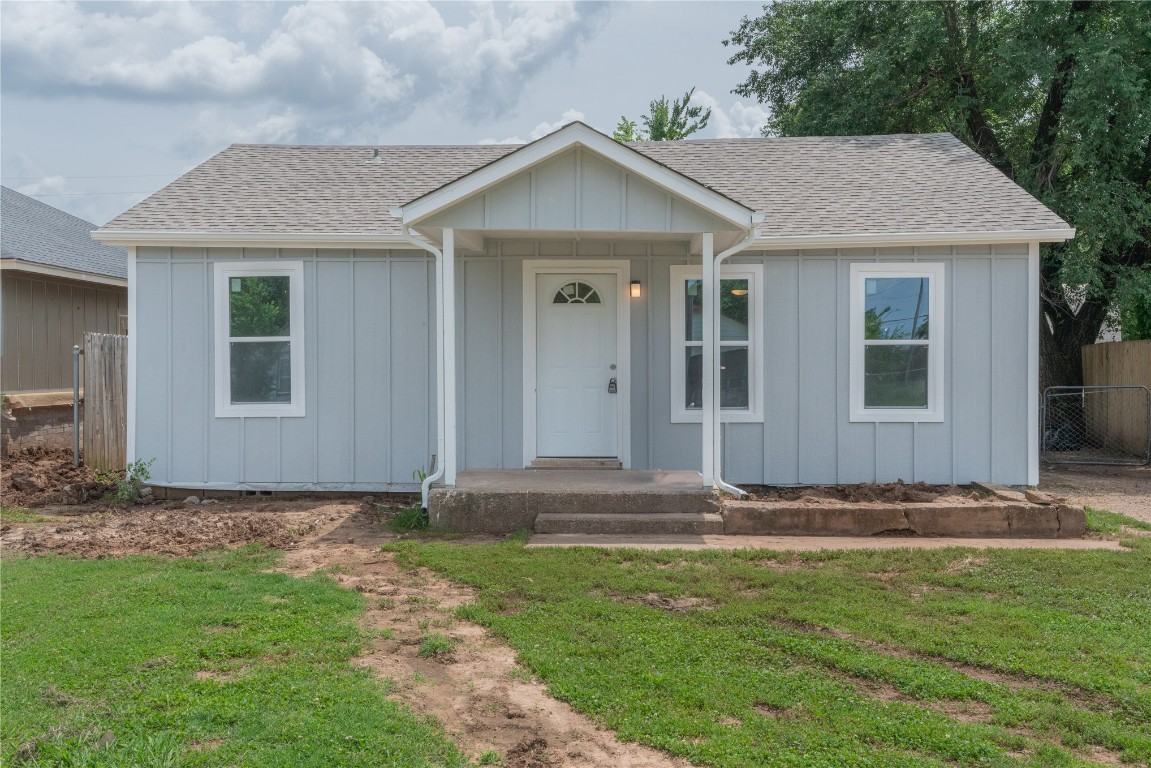
Active
$164,999
3
bds
|
1
ba
|
0
sqft
|
built
1949
312 SE 45th St, Oklahoma City, OK 73129
$-17
Cash flow
-0.5%
Cash-on-Cash Return
6.2%
Cap rate
0.8%
Rent to Value Ratio
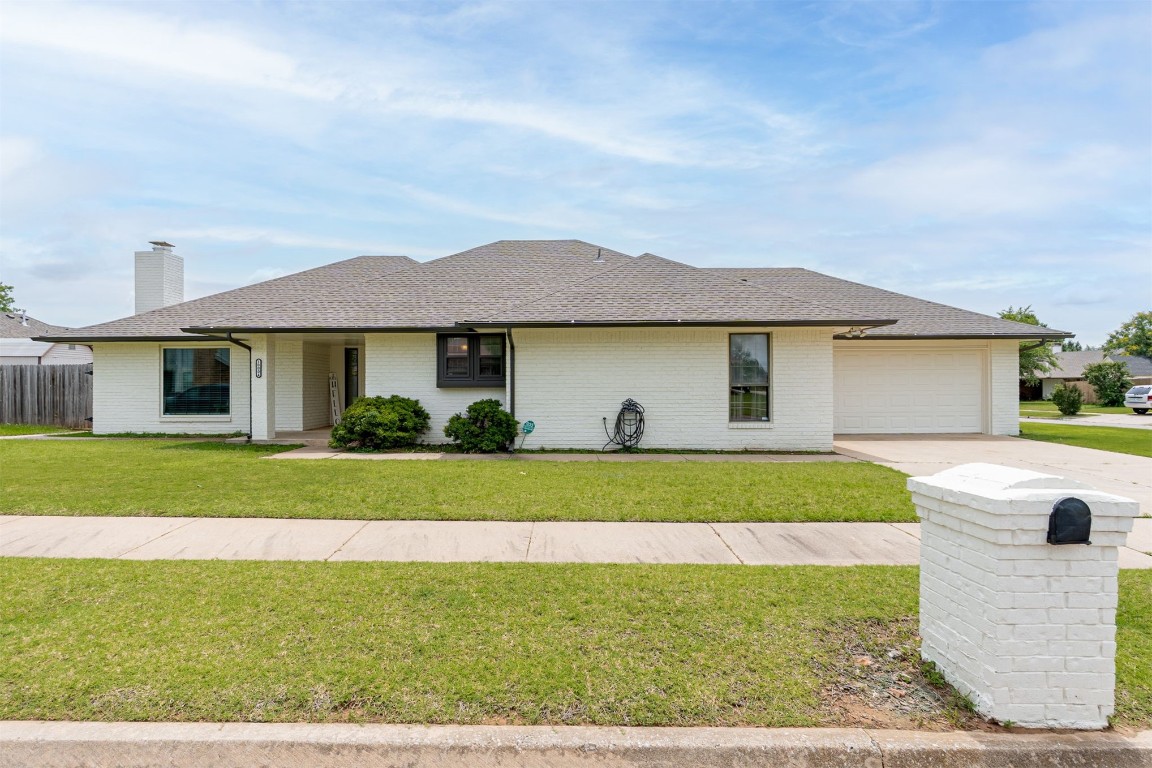
Active
$250,000
3
bds
|
2
ba
|
0
sqft
|
built
1984
10004 S Drexel Ave, Oklahoma City, OK 73159
$-318
Cash flow
-6.6%
Cash-on-Cash Return
4.8%
Cap rate
0.7%
Rent to Value Ratio