Oklahoma City, OK Investment Properties for Sale
Browse homes for sale and investment properties in Oklahoma City, OK. Refine your search by price, property type, or more.
Best cash flowing properties in Oklahoma City, OK
Active
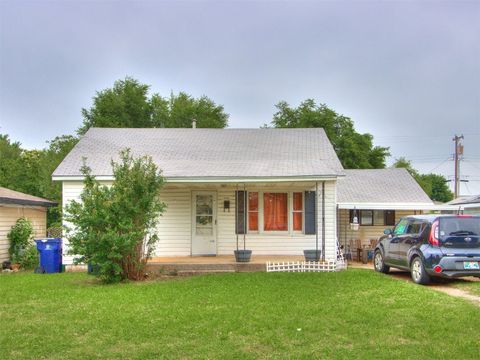
$119,000
3
bds
|
2
ba
|
0
sqft
|
built
1951
2133 SW 46th St, Oklahoma City, OK 73119
$239
Cash flow
10.5%
Cash-on-Cash Return
8.1%
Cap rate
1.1%
Rent to Value Ratio

Active
$96,000
2
bds
|
1
ba
|
0
sqft
|
built
1920
1725 NE 11th St, Oklahoma City, OK 73117
$216
Cash flow
11.7%
Cash-on-Cash Return
8.4%
Cap rate
1.0%
Rent to Value Ratio
1,430 out of 1,810 properties for sale in Oklahoma City, OK
Limited Results Shown
Create a free account, or log in to reveal all property listings and enjoy the complete experience.
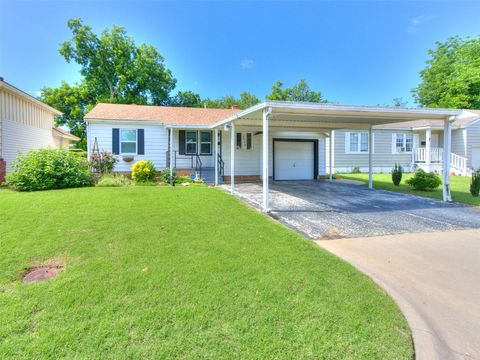
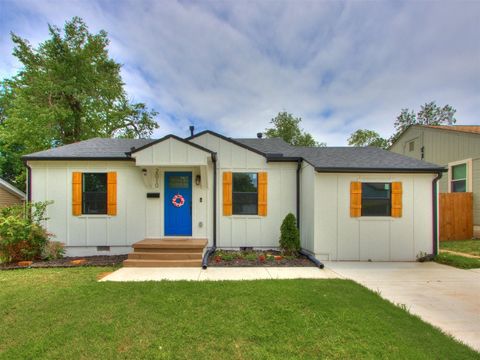
Active
$169,000
2
bds
|
1
ba
|
0
sqft
|
built
1948
3208 NW 34th St, Oklahoma City, OK 73112
$180
Cash flow
5.6%
Cash-on-Cash Return
7.0%
Cap rate
0.9%
Rent to Value Ratio
Active
$119,000
3
bds
|
2
ba
|
0
sqft
|
built
1951
2133 SW 46th St, Oklahoma City, OK 73119
$239
Cash flow
10.5%
Cash-on-Cash Return
8.1%
Cap rate
1.1%
Rent to Value Ratio
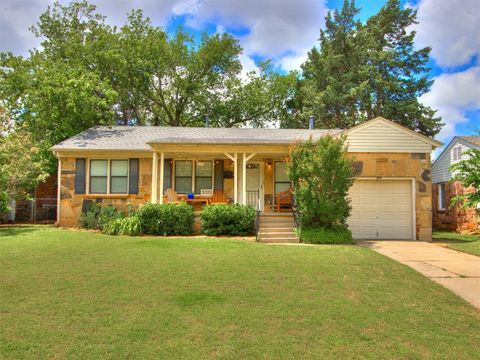
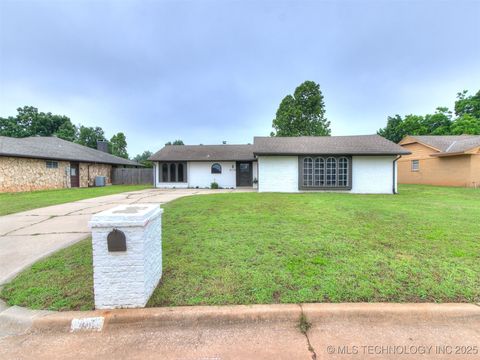
Active
$199,000
3
bds
|
1
ba
|
0
sqft
|
built
1950
5301 N Miller Ave, Oklahoma City, OK 73112
$-96
Cash flow
-2.5%
Cash-on-Cash Return
5.1%
Cap rate
0.8%
Rent to Value Ratio
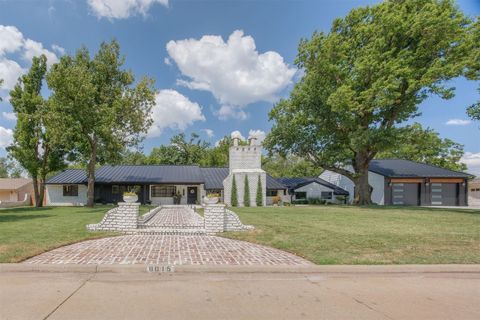
Active
$1,795,000
4
bds
|
4
ba
|
0
sqft
|
built
1956
8015 Glenwood Ave, Oklahoma City, OK 73114
$-6,554
Cash flow
-19.1%
Cash-on-Cash Return
1.3%
Cap rate
0.3%
Rent to Value Ratio
Active
$710,000
3
bds
|
4
ba
|
0
sqft
|
built
1955
2404 NW 55th Ter, Oklahoma City, OK 73112
$-1,800
Cash flow
-13.2%
Cash-on-Cash Return
2.6%
Cap rate
0.4%
Rent to Value Ratio
Active
$169,000
4
bds
|
2
ba
|
0
sqft
|
built
1986
1633 SE 52nd St, Oklahoma City, OK 73129
$22
Cash flow
0.7%
Cash-on-Cash Return
5.8%
Cap rate
0.8%
Rent to Value Ratio
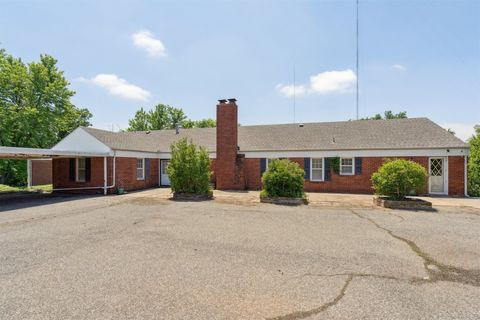
Active
$279,500
4
bds
|
2
ba
|
0
sqft
|
built
1947
2800 NW 43rd St, Oklahoma City, OK 73112
$-260
Cash flow
-4.9%
Cash-on-Cash Return
4.6%
Cap rate
0.6%
Rent to Value Ratio
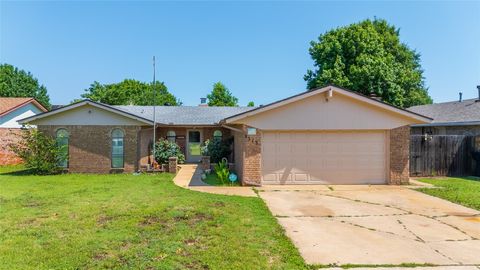
Active
$245,000
4
bds
|
2
ba
|
0
sqft
|
built
1965
1121 NW 105th St, Oklahoma City, OK 73114
$-168
Cash flow
-3.6%
Cash-on-Cash Return
4.9%
Cap rate
0.7%
Rent to Value Ratio
Active
$200,000
2
bds
|
1
ba
|
0
sqft
|
built
1920
1505 NW 34th St, Oklahoma City, OK 73118
$70
Cash flow
1.8%
Cash-on-Cash Return
6.1%
Cap rate
0.8%
Rent to Value Ratio
Active
$572,400
4
bds
|
4
ba
|
0
sqft
|
built
2019
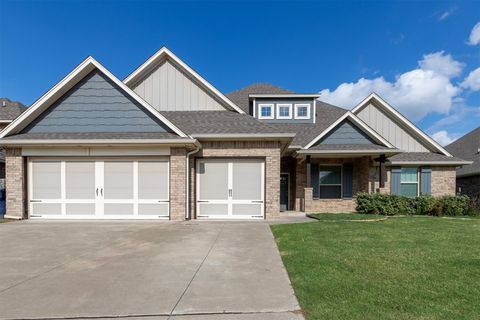
12916 Ponderosa Blvd, Oklahoma City, OK 73142
$-867
Cash flow
-7.9%
Cash-on-Cash Return
3.9%
Cap rate
0.6%
Rent to Value Ratio
Active
$420,000
4
bds
|
4
ba
|
0
sqft
|
built
1990
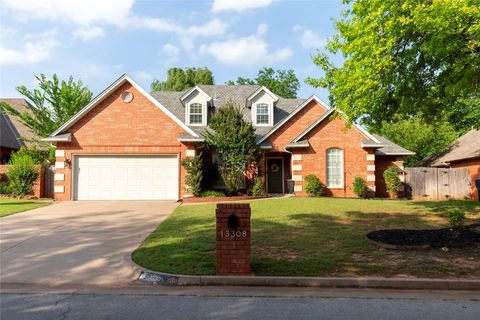
13308 Creekside Dr, Oklahoma City, OK 73131
$-549
Cash flow
-6.8%
Cash-on-Cash Return
4.1%
Cap rate
0.6%
Rent to Value Ratio
Active
$149,900
3
bds
|
1
ba
|
0
sqft
|
built
1956
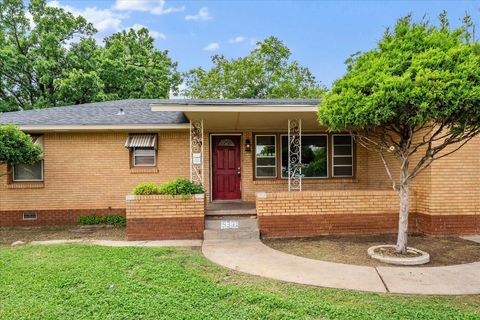
5321 S Douglas Ave, Oklahoma City, OK 73109
$97
Cash flow
3.4%
Cash-on-Cash Return
6.5%
Cap rate
0.9%
Rent to Value Ratio
Active
$425,000
3
bds
|
2
ba
|
0
sqft
|
built
1955
1508 Brighton Ave, Oklahoma City, OK 73120
$-712
Cash flow
-8.7%
Cash-on-Cash Return
3.7%
Cap rate
0.6%
Rent to Value Ratio
Active
$230,000
3
bds
|
2
ba
|
0
sqft
|
built
2020
1800 Hayes Ln, Oklahoma City, OK 73127
$-182
Cash flow
-4.1%
Cash-on-Cash Return
4.7%
Cap rate
0.7%
Rent to Value Ratio
Active
$210,000
3
bds
|
2
ba
|
0
sqft
|
built
1941
3117 NW 23rd St, Oklahoma City, OK 73107
$60
Cash flow
1.5%
Cash-on-Cash Return
6.0%
Cap rate
0.8%
Rent to Value Ratio
Active
$1,095,000
3
bds
|
3
ba
|
0
sqft
|
built
1922
401 NW 20th St, Oklahoma City, OK 73103
$-4,072
Cash flow
-19.4%
Cash-on-Cash Return
1.2%
Cap rate
0.3%
Rent to Value Ratio

Active
$249,000
2
bds
|
2
ba
|
0
sqft
|
built
1925
1531 NW 28th St, Oklahoma City, OK 73106
$-446
Cash flow
-9.3%
Cash-on-Cash Return
3.5%
Cap rate
0.5%
Rent to Value Ratio
Active
$249,000
3
bds
|
2
ba
|
0
sqft
|
built
1949
2010 NW 34th St, Oklahoma City, OK 73118
$-3
Cash flow
-0.1%
Cash-on-Cash Return
5.7%
Cap rate
0.8%
Rent to Value Ratio
Active
$256,000
3
bds
|
2
ba
|
1,728
sqft
|
built
1972
12413 Springwood Dr, Oklahoma City, OK 73120
$-1,520
Cash flow
-31.0%
Cash-on-Cash Return
-1.4%
Cap rate
0.6%
Rent to Value Ratio
Active
$895,000
3
bds
|
3
ba
|
0
sqft
|
built
1946
1500 E Wilshire Blvd, Oklahoma City, OK 73111
$-2,515
Cash flow
-14.7%
Cash-on-Cash Return
2.3%
Cap rate
0.3%
Rent to Value Ratio
Active
$225,000
3
bds
|
2
ba
|
0
sqft
|
built
1973
8513 NW 89th St, Oklahoma City, OK 73132
$-24
Cash flow
-0.6%
Cash-on-Cash Return
5.6%
Cap rate
0.8%
Rent to Value Ratio
Active
$264,900
3
bds
|
2
ba
|
0
sqft
|
built
1965
6513 N Ann Arbor Ter, Oklahoma City, OK 73132
$-197
Cash flow
-3.9%
Cash-on-Cash Return
4.8%
Cap rate
0.7%
Rent to Value Ratio
Active
$199,000
2
bds
|
1
ba
|
0
sqft
|
built
1937
9508 NE 23rd St, Oklahoma City, OK 73141
$-43
Cash flow
-1.1%
Cash-on-Cash Return
5.4%
Cap rate
0.8%
Rent to Value Ratio
Active
$205,000
2
bds
|
1
ba
|
0
sqft
|
built
1941
2529 NW 32nd St, Oklahoma City, OK 73112
$-158
Cash flow
-4.0%
Cash-on-Cash Return
4.8%
Cap rate
0.7%
Rent to Value Ratio

Active
$200,000
4
bds
|
2
ba
|
0
sqft
|
built
1964
6201 N Allison Dr, Oklahoma City, OK 73112
$102
Cash flow
2.7%
Cash-on-Cash Return
6.3%
Cap rate
0.9%
Rent to Value Ratio

Active
$180,000
3
bds
|
2
ba
|
0
sqft
|
built
1971
428 NW 91st St, Oklahoma City, OK 73114
$-120
Cash flow
-3.5%
Cash-on-Cash Return
4.9%
Cap rate
0.7%
Rent to Value Ratio

Active
$595,000
5
bds
|
4
ba
|
0
sqft
|
built
1973
13229 Cedar Springs Rd, Oklahoma City, OK 73120
$-944
Cash flow
-8.3%
Cash-on-Cash Return
3.8%
Cap rate
0.6%
Rent to Value Ratio
Active
$96,000
2
bds
|
1
ba
|
0
sqft
|
built
1920
1725 NE 11th St, Oklahoma City, OK 73117
$216
Cash flow
11.7%
Cash-on-Cash Return
8.4%
Cap rate
1.0%
Rent to Value Ratio

Active
$245,000
5
bds
|
4
ba
|
0
sqft
|
built
2009
1217 SW 18th St, Oklahoma City, OK 73108
$-155
Cash flow
-3.3%
Cash-on-Cash Return
4.9%
Cap rate
0.7%
Rent to Value Ratio
Active
$550,000
3
bds
|
3
ba
|
0
sqft
|
built
1985
2825 NW Grand Blvd, Oklahoma City, OK 73116
$-1,683
Cash flow
-16.0%
Cash-on-Cash Return
2.0%
Cap rate
0.5%
Rent to Value Ratio

Active
$421,000
2
bds
|
2
ba
|
0
sqft
|
built
2025
1303 NW 2nd St, Oklahoma City, OK 73106
$-1,322
Cash flow
-16.4%
Cash-on-Cash Return
1.9%
Cap rate
0.3%
Rent to Value Ratio

Active
$239,000
4
bds
|
2
ba
|
0
sqft
|
built
1950
3838 NW 32nd St, Oklahoma City, OK 73112
$-97
Cash flow
-2.1%
Cash-on-Cash Return
5.2%
Cap rate
0.7%
Rent to Value Ratio
Active
$280,000
3
bds
|
2
ba
|
0
sqft
|
built
2014
8317 NW 138th Cir, Oklahoma City, OK 73142
$-363
Cash flow
-6.8%
Cash-on-Cash Return
4.1%
Cap rate
0.6%
Rent to Value Ratio

Active
$283,000
3
bds
|
2
ba
|
0
sqft
|
built
1926
2029 NW 18th St, Oklahoma City, OK 73106
$-428
Cash flow
-7.9%
Cash-on-Cash Return
3.9%
Cap rate
0.6%
Rent to Value Ratio

Active
$910,000
8
bds
|
8
ba
|
0
sqft
|
built
2021
1138 N Blackwelder Ave, Oklahoma City, OK 73106
$-3,522
Cash flow
-20.2%
Cash-on-Cash Return
1.0%
Cap rate
0.2%
Rent to Value Ratio

Active
$280,000
4
bds
|
2
ba
|
0
sqft
|
built
1990
3033 SW 126th St, Oklahoma City, OK 73170
$-262
Cash flow
-4.9%
Cash-on-Cash Return
4.6%
Cap rate
0.7%
Rent to Value Ratio

Active
$172,000
3
bds
|
2
ba
|
0
sqft
|
built
1959
3217 NW 34th St, Oklahoma City, OK 73112
$-31
Cash flow
-0.9%
Cash-on-Cash Return
5.5%
Cap rate
0.8%
Rent to Value Ratio

Active
$760,000
3
bds
|
4
ba
|
0
sqft
|
built
2008
23 NE 3rd St, Oklahoma City, OK 73104
$-1,288
Cash flow
-8.8%
Cash-on-Cash Return
3.6%
Cap rate
0.6%
Rent to Value Ratio

Active
$159,000
2
bds
|
1
ba
|
0
sqft
|
built
1936
3224 NW 24th St, Oklahoma City, OK 73107
$-69
Cash flow
-2.3%
Cash-on-Cash Return
5.2%
Cap rate
0.8%
Rent to Value Ratio

Active
$230,000
3
bds
|
2
ba
|
0
sqft
|
built
2018
7621 Percheron Rd, Oklahoma City, OK 73132
$-325
Cash flow
-7.4%
Cash-on-Cash Return
4.0%
Cap rate
0.6%
Rent to Value Ratio