Oklahoma City, OK Investment Properties for Sale
Browse homes for sale and investment properties in Oklahoma City, OK. Refine your search by price, property type, or more.
Best cash flowing properties in Oklahoma City, OK
Active
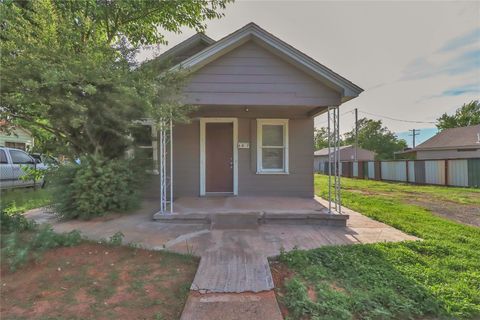
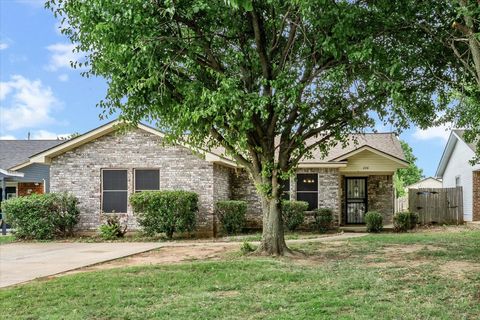
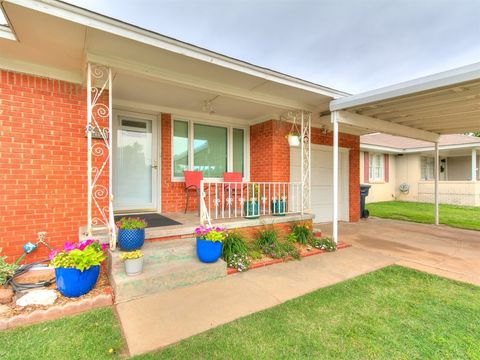
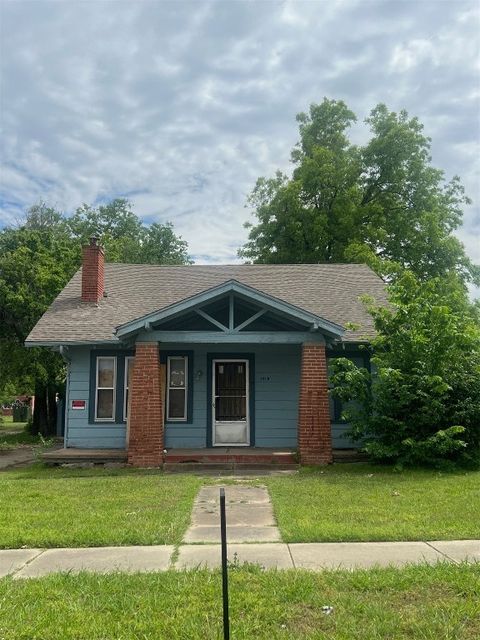
$169,900
4
bds
|
3
ba
|
0
sqft
|
built
1936
1132 SW 25th St, Oklahoma City, OK 73109
$178
Cash flow
5.5%
Cash-on-Cash Return
7.5%
Cap rate
0.9%
Rent to Value Ratio
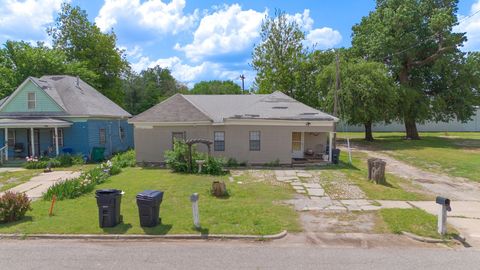
Active
$90,000
2
bds
|
1
ba
|
0
sqft
|
built
1951
6017 Pat Ave, Oklahoma City, OK 73149
$112
Cash flow
6.5%
Cash-on-Cash Return
7.8%
Cap rate
1.0%
Rent to Value Ratio
1,264 out of 1,625 properties for sale in Oklahoma City, OK
Limited Results Shown
Create a free account, or log in to reveal all property listings and enjoy the complete experience.

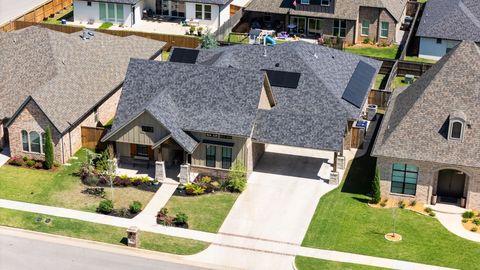
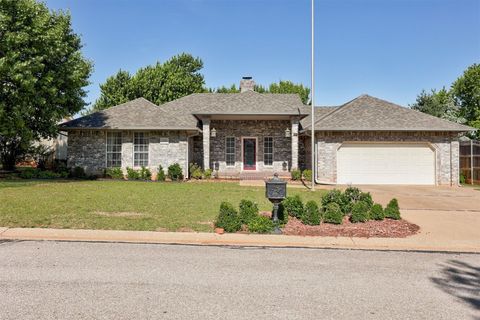
Active
$259,900
4
bds
|
2
ba
|
0
sqft
|
built
1950
737 NW 89th St, Oklahoma City, OK 73114
$-649
Cash flow
-13.0%
Cash-on-Cash Return
3.3%
Cap rate
0.5%
Rent to Value Ratio

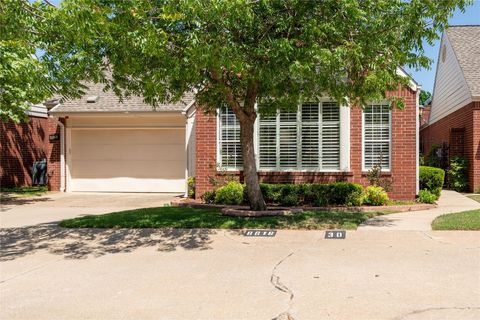
Active
$199,750
5
bds
|
2
ba
|
0
sqft
|
built
1972
121 NW 79th St, Oklahoma City, OK 73114
$-244
Cash flow
-6.4%
Cash-on-Cash Return
4.8%
Cap rate
0.7%
Rent to Value Ratio

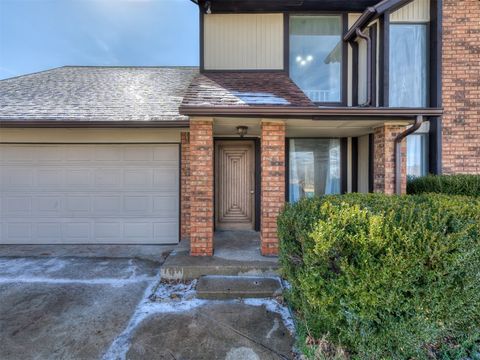
Pending
$255,000
3
bds
|
2
ba
|
0
sqft
|
built
1979
1343 Lowrie Ln, Oklahoma City, OK 73159
$-347
Cash flow
-7.1%
Cash-on-Cash Return
4.6%
Cap rate
0.7%
Rent to Value Ratio
Active
$274,900
2
bds
|
1
ba
|
0
sqft
|
built
1918
1217 NW 44th St, Oklahoma City, OK 73118
$-599
Cash flow
-11.4%
Cash-on-Cash Return
3.6%
Cap rate
0.5%
Rent to Value Ratio
Active
$245,000
3
bds
|
1
ba
|
0
sqft
|
built
1926
2534 NW 19th St, Oklahoma City, OK 73107
$-288
Cash flow
-6.1%
Cash-on-Cash Return
4.9%
Cap rate
0.7%
Rent to Value Ratio
Active
$157,500
3
bds
|
1
ba
|
0
sqft
|
built
2002
236 NW 91st St, Oklahoma City, OK 73114
$70
Cash flow
2.3%
Cash-on-Cash Return
6.8%
Cap rate
0.9%
Rent to Value Ratio
Active
$532,950
3
bds
|
3
ba
|
0
sqft
|
built
2021
8421 NW 130th Ter, Oklahoma City, OK 73142
$-1,583
Cash flow
-15.5%
Cash-on-Cash Return
2.7%
Cap rate
0.5%
Rent to Value Ratio
Active
$374,000
2
bds
|
3
ba
|
0
sqft
|
built
1995
8616 N May Ave, Oklahoma City, OK 73120
$-1,141
Cash flow
-15.9%
Cash-on-Cash Return
2.6%
Cap rate
0.6%
Rent to Value Ratio
Active
$265,000
3
bds
|
3
ba
|
0
sqft
|
built
1984
1108 SW 118th Pl, Oklahoma City, OK 73170
$-204
Cash flow
-4.0%
Cash-on-Cash Return
5.3%
Cap rate
0.8%
Rent to Value Ratio
Pending
$339,750
3
bds
|
3
ba
|
0
sqft
|
built
2014
1609 SW 123rd St, Oklahoma City, OK 73170
$-570
Cash flow
-8.8%
Cash-on-Cash Return
4.3%
Cap rate
0.6%
Rent to Value Ratio
Active
$282,500
3
bds
|
2
ba
|
0
sqft
|
built
1989
7916 Wilshire Ridge Dr, Oklahoma City, OK 73132
$-383
Cash flow
-7.1%
Cash-on-Cash Return
4.6%
Cap rate
0.7%
Rent to Value Ratio
Active
$575,000
4
bds
|
3
ba
|
0
sqft
|
built
2009
7612 NW 134th St, Oklahoma City, OK 73142
$-1,173
Cash flow
-10.6%
Cash-on-Cash Return
3.8%
Cap rate
0.6%
Rent to Value Ratio
Active
$174,000
3
bds
|
1
ba
|
0
sqft
|
built
1980
2421 N Prospect Ave, Oklahoma City, OK 73111
$-190
Cash flow
-5.7%
Cash-on-Cash Return
5.0%
Cap rate
0.6%
Rent to Value Ratio
Pending
$475,000
5
bds
|
3
ba
|
0
sqft
|
built
1968
8224 Golden Oaks Rd, Oklahoma City, OK 73127
$-1,154
Cash flow
-12.7%
Cash-on-Cash Return
3.3%
Cap rate
0.5%
Rent to Value Ratio
Active
$230,000
3
bds
|
2
ba
|
0
sqft
|
built
2012
8525 SW 48th St, Oklahoma City, OK 73179
$-216
Cash flow
-4.9%
Cash-on-Cash Return
5.1%
Cap rate
0.8%
Rent to Value Ratio
Active
$444,000
4
bds
|
3
ba
|
0
sqft
|
built
1972
11412 Leaning Elm Rd, Oklahoma City, OK 73120
$-669
Cash flow
-7.9%
Cash-on-Cash Return
4.5%
Cap rate
0.6%
Rent to Value Ratio
Active
$215,000
3
bds
|
2
ba
|
0
sqft
|
built
1920
1925 NW 36th St, Oklahoma City, OK 73118
$41
Cash flow
1.0%
Cash-on-Cash Return
6.5%
Cap rate
0.8%
Rent to Value Ratio
Active
$285,000
4
bds
|
2
ba
|
0
sqft
|
built
2002
12308 Hickory Creek Blvd, Oklahoma City, OK 73170
$-515
Cash flow
-9.4%
Cash-on-Cash Return
4.1%
Cap rate
0.6%
Rent to Value Ratio
Active
$615,000
4
bds
|
3
ba
|
0
sqft
|
built
1973
12824 Cedar Springs Rd, Oklahoma City, OK 73120
$-1,354
Cash flow
-11.5%
Cash-on-Cash Return
3.6%
Cap rate
0.5%
Rent to Value Ratio
Active
$609,900
3
bds
|
3
ba
|
0
sqft
|
built
1972
11825 Leaning Elm Rd, Oklahoma City, OK 73120
$-1,140
Cash flow
-9.8%
Cash-on-Cash Return
4.0%
Cap rate
0.6%
Rent to Value Ratio

Active
$145,000
2
bds
|
1
ba
|
0
sqft
|
built
1932
2017 NE 20th St, Oklahoma City, OK 73111
$87
Cash flow
3.1%
Cash-on-Cash Return
7.0%
Cap rate
1.0%
Rent to Value Ratio
Active
$388,000
3
bds
|
2
ba
|
0
sqft
|
built
1930
3104 NW 21st St, Oklahoma City, OK 73107
$-744
Cash flow
-10.0%
Cash-on-Cash Return
4.0%
Cap rate
0.6%
Rent to Value Ratio
Active
$219,900
3
bds
|
2
ba
|
0
sqft
|
built
1952
5001 N Independence Ave, Oklahoma City, OK 73112
$-172
Cash flow
-4.1%
Cash-on-Cash Return
5.3%
Cap rate
0.7%
Rent to Value Ratio
Active
$475,000
4
bds
|
3
ba
|
0
sqft
|
built
1992
4117 NW 143rd St, Oklahoma City, OK 73134
$-833
Cash flow
-9.1%
Cash-on-Cash Return
4.2%
Cap rate
0.7%
Rent to Value Ratio
Active
$550,000
3
bds
|
3
ba
|
0
sqft
|
built
1959
1219 Westchester Dr, Oklahoma City, OK 73114
$-1,484
Cash flow
-14.1%
Cash-on-Cash Return
3.0%
Cap rate
0.5%
Rent to Value Ratio
Active
$90,000
2
bds
|
1
ba
|
0
sqft
|
built
1951
6017 Pat Ave, Oklahoma City, OK 73149
$112
Cash flow
6.5%
Cash-on-Cash Return
7.8%
Cap rate
1.0%
Rent to Value Ratio
Active
$639,900
4
bds
|
3
ba
|
0
sqft
|
built
1990
7309 NE 101st St, Oklahoma City, OK 73151
$-1,499
Cash flow
-12.2%
Cash-on-Cash Return
3.5%
Cap rate
0.5%
Rent to Value Ratio
Active
$299,900
3
bds
|
3
ba
|
0
sqft
|
built
1993
12011 Cantle Rd, Oklahoma City, OK 73120
$-422
Cash flow
-7.3%
Cash-on-Cash Return
4.6%
Cap rate
0.7%
Rent to Value Ratio
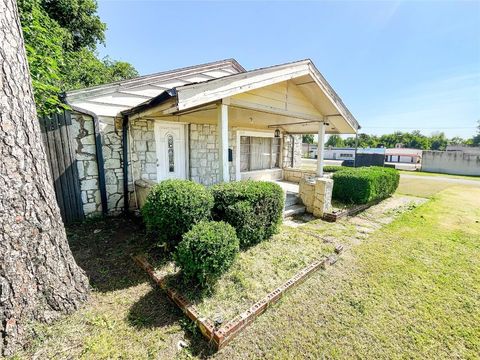
Active
$300,000
3
bds
|
1
ba
|
0
sqft
|
built
1920
430 SW 11th St, Oklahoma City, OK 73109
$-634
Cash flow
-11.0%
Cash-on-Cash Return
3.7%
Cap rate
0.5%
Rent to Value Ratio
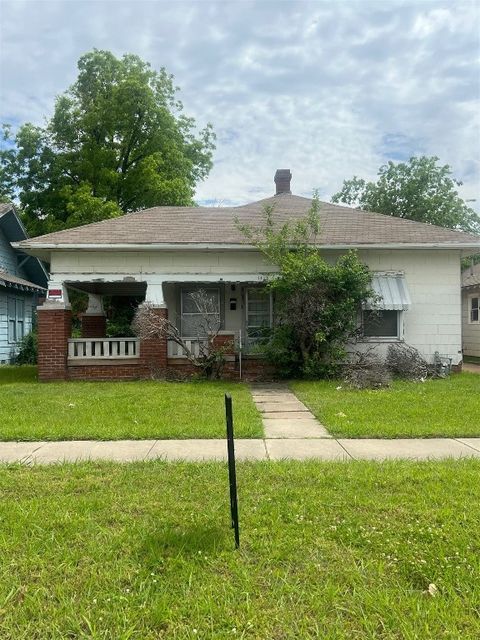
Active
$169,900
4
bds
|
3
ba
|
0
sqft
|
built
1936
1132 SW 25th St, Oklahoma City, OK 73109
$178
Cash flow
5.5%
Cash-on-Cash Return
7.5%
Cap rate
0.9%
Rent to Value Ratio
Active
$165,000
3
bds
|
2
ba
|
0
sqft
|
built
1925
209 SW 40th St, Oklahoma City, OK 73109
$-55
Cash flow
-1.7%
Cash-on-Cash Return
5.9%
Cap rate
0.8%
Rent to Value Ratio
Active
$750,000
2
bds
|
1
ba
|
0
sqft
|
built
1904
1418 NW 30th St, Oklahoma City, OK 73118
$-3,082
Cash flow
-21.4%
Cash-on-Cash Return
1.3%
Cap rate
0.2%
Rent to Value Ratio
Active
$750,000
2
bds
|
1
ba
|
0
sqft
|
built
1904
1416 NW 30th St, Oklahoma City, OK 73118
$-3,078
Cash flow
-21.4%
Cash-on-Cash Return
1.3%
Cap rate
0.2%
Rent to Value Ratio
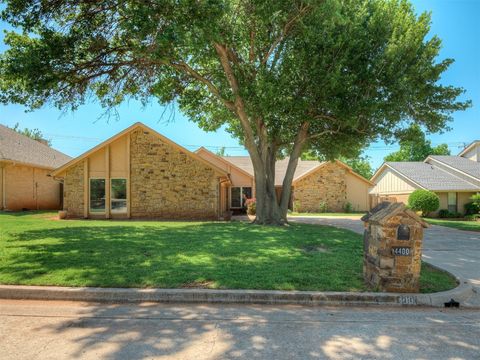
Active
$345,000
3
bds
|
3
ba
|
0
sqft
|
built
1979
4400 Windsong Way, Oklahoma City, OK 73120
$-573
Cash flow
-8.7%
Cash-on-Cash Return
4.3%
Cap rate
0.6%
Rent to Value Ratio

Active
$1,995,000
5
bds
|
6
ba
|
0
sqft
|
built
1905
1415 N Hudson Ave, Oklahoma City, OK 73103
$-9,439
Cash flow
-24.7%
Cash-on-Cash Return
0.6%
Cap rate
0.2%
Rent to Value Ratio

Pending
$315,000
3
bds
|
3
ba
|
0
sqft
|
built
1972
6212 N Utah Ave, Oklahoma City, OK 73112
$-634
Cash flow
-10.5%
Cash-on-Cash Return
3.9%
Cap rate
0.6%
Rent to Value Ratio

Active
$191,555
3
bds
|
1
ba
|
0
sqft
|
built
1953
3500 NW 14th St, Oklahoma City, OK 73107
$-223
Cash flow
-6.1%
Cash-on-Cash Return
4.9%
Cap rate
0.7%
Rent to Value Ratio

Active
$158,900
3
bds
|
1
ba
|
0
sqft
|
built
1958
2210 SW 52nd St, Oklahoma City, OK 73119
$55
Cash flow
1.8%
Cash-on-Cash Return
6.7%
Cap rate
0.9%
Rent to Value Ratio

Active
$224,900
3
bds
|
1
ba
|
0
sqft
|
built
1921
2115 NW 15th St, Oklahoma City, OK 73107
$-226
Cash flow
-5.2%
Cash-on-Cash Return
5.1%
Cap rate
0.7%
Rent to Value Ratio

Active
$373,900
3
bds
|
2
ba
|
0
sqft
|
built
1968
11008 Blue Sage Rd, Oklahoma City, OK 73120
$-487
Cash flow
-6.8%
Cash-on-Cash Return
4.7%
Cap rate
0.7%
Rent to Value Ratio