Oklahoma City, OK Investment Properties for Sale
Browse homes for sale and investment properties in Oklahoma City, OK. Refine your search by price, property type, or more.
Best cash flowing properties in Oklahoma City, OK
Active
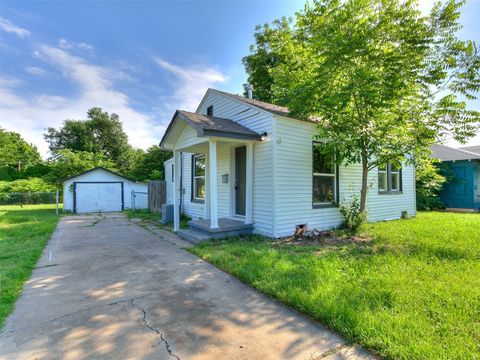
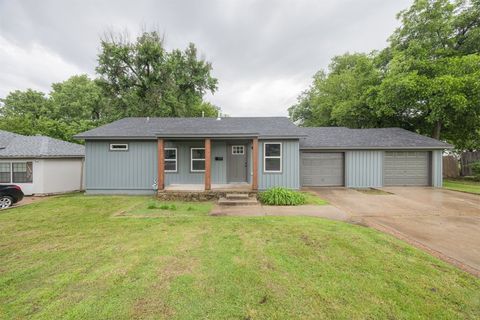
$134,000
2
bds
|
1
ba
|
0
sqft
|
built
1928
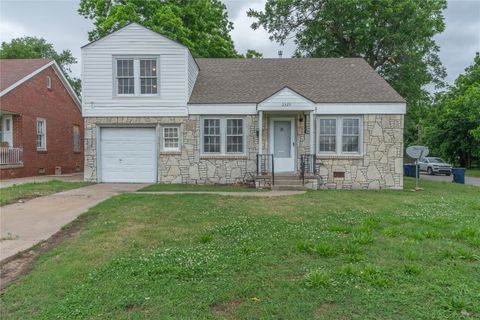
2145 SW 51st St, Oklahoma City, OK 73119
$248
Cash flow
9.7%
Cash-on-Cash Return
7.9%
Cap rate
1.0%
Rent to Value Ratio
Active
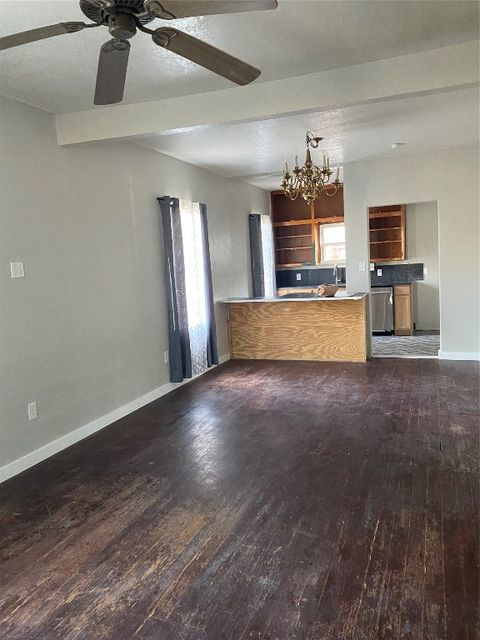
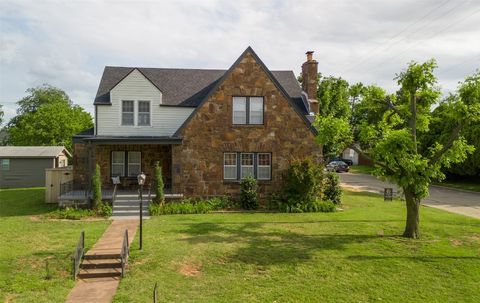
$119,000
2
bds
|
1
ba
|
0
sqft
|
built
1910
640 SE 20th St, Oklahoma City, OK 73129
$210
Cash flow
9.2%
Cash-on-Cash Return
7.8%
Cap rate
1.0%
Rent to Value Ratio
1,423 out of 1,802 properties for sale in Oklahoma City, OK
Limited Results Shown
Create a free account, or log in to reveal all property listings and enjoy the complete experience.
Active
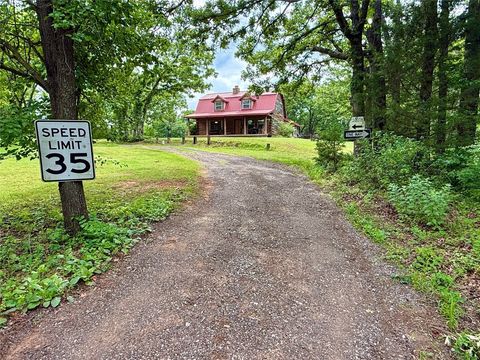
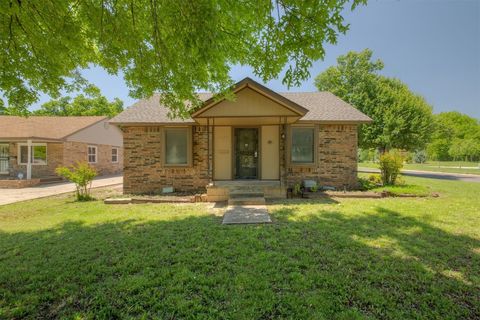
$450,000
4
bds
|
4
ba
|
0
sqft
|
built
1984
10813 S Peggy Lou Dr, Oklahoma City, OK 73165
$-766
Cash flow
-8.9%
Cash-on-Cash Return
3.6%
Cap rate
0.5%
Rent to Value Ratio
Active
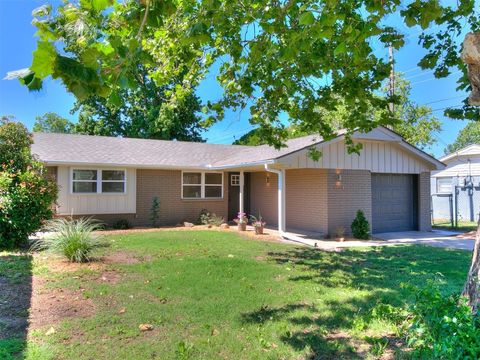
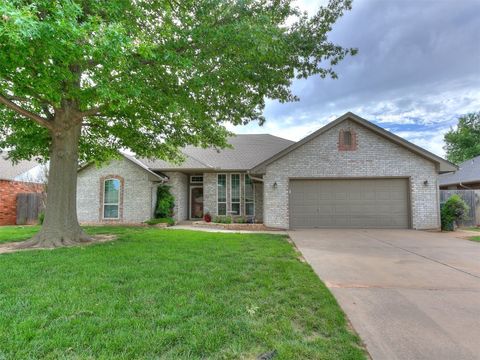
$199,900
3
bds
|
2
ba
|
0
sqft
|
built
1966
7624 NW 14th Ter, Oklahoma City, OK 73127
$-178
Cash flow
-4.6%
Cash-on-Cash Return
4.6%
Cap rate
0.7%
Rent to Value Ratio
Active
$219,000
3
bds
|
2
ba
|
0
sqft
|
built
1951
2817 N Donnelly Ave, Oklahoma City, OK 73107
$-86
Cash flow
-2.0%
Cash-on-Cash Return
5.2%
Cap rate
0.7%
Rent to Value Ratio
Active
$574,750
4
bds
|
3
ba
|
0
sqft
|
built
1938
2650 NW 25th St, Oklahoma City, OK 73107
$-192
Cash flow
-1.7%
Cash-on-Cash Return
5.3%
Cap rate
0.7%
Rent to Value Ratio
Active
$235,000
4
bds
|
4
ba
|
0
sqft
|
built
1942
1147 NE Grand Blvd, Oklahoma City, OK 73117
$208
Cash flow
4.6%
Cash-on-Cash Return
6.7%
Cap rate
0.9%
Rent to Value Ratio
Active
$275,000
4
bds
|
2
ba
|
0
sqft
|
built
1989
8117 Harvest Hills South Blvd, Oklahoma City, OK 73132
$-286
Cash flow
-5.4%
Cash-on-Cash Return
4.4%
Cap rate
0.7%
Rent to Value Ratio
Active
$119,000
2
bds
|
1
ba
|
0
sqft
|
built
1910
640 SE 20th St, Oklahoma City, OK 73129
$210
Cash flow
9.2%
Cash-on-Cash Return
7.8%
Cap rate
1.0%
Rent to Value Ratio
Active
$699,900
3
bds
|
3
ba
|
0
sqft
|
built
2007
12509 St Lukes Ln, Oklahoma City, OK 73142
$-1,575
Cash flow
-11.7%
Cash-on-Cash Return
3.0%
Cap rate
0.5%
Rent to Value Ratio

Active
$375,000
3
bds
|
5
ba
|
0
sqft
|
built
1920
1700 NW 19th St, Oklahoma City, OK 73106
$-934
Cash flow
-13.0%
Cash-on-Cash Return
2.7%
Cap rate
0.5%
Rent to Value Ratio
Active
$450,000
3
bds
|
2
ba
|
0
sqft
|
built
1936
840 NW 42nd St, Oklahoma City, OK 73118
$-1,258
Cash flow
-14.6%
Cash-on-Cash Return
2.3%
Cap rate
0.4%
Rent to Value Ratio
Active
$249,900
3
bds
|
2
ba
|
0
sqft
|
built
1949
2616 NW 33rd St, Oklahoma City, OK 73112
$-292
Cash flow
-6.1%
Cash-on-Cash Return
4.3%
Cap rate
0.6%
Rent to Value Ratio
Active
$440,000
3
bds
|
2
ba
|
0
sqft
|
built
2015
13009 Jasmine Ln, Oklahoma City, OK 73142
$-960
Cash flow
-11.4%
Cash-on-Cash Return
3.1%
Cap rate
0.6%
Rent to Value Ratio
Active
$195,000
4
bds
|
2
ba
|
0
sqft
|
built
1940
2325 E Madison St, Oklahoma City, OK 73111
$124
Cash flow
3.3%
Cash-on-Cash Return
6.4%
Cap rate
0.8%
Rent to Value Ratio
Active
$470,000
3
bds
|
3
ba
|
0
sqft
|
built
2006
13605 Verona Strada, Oklahoma City, OK 73170
$-870
Cash flow
-9.7%
Cash-on-Cash Return
3.5%
Cap rate
0.6%
Rent to Value Ratio
Active
$875,000
3
bds
|
4
ba
|
0
sqft
|
built
2014
13800 Cascata Strada, Oklahoma City, OK 73170
$-2,676
Cash flow
-16.0%
Cash-on-Cash Return
2.0%
Cap rate
0.4%
Rent to Value Ratio
Active
$625,000
3
bds
|
3
ba
|
0
sqft
|
built
1920
223 NW 21st St, Oklahoma City, OK 73103
$-1,281
Cash flow
-10.7%
Cash-on-Cash Return
3.2%
Cap rate
0.5%
Rent to Value Ratio
Active
$310,000
3
bds
|
2
ba
|
0
sqft
|
built
1926
616 NW Eubanks St, Oklahoma City, OK 73118
$-551
Cash flow
-9.3%
Cash-on-Cash Return
3.5%
Cap rate
0.6%
Rent to Value Ratio
Active
$360,000
4
bds
|
3
ba
|
0
sqft
|
built
2003
11609 Blueridge Ct, Oklahoma City, OK 73162
$-261
Cash flow
-3.8%
Cash-on-Cash Return
4.8%
Cap rate
0.7%
Rent to Value Ratio
Active
$199,333
4
bds
|
2
ba
|
0
sqft
|
built
1985
1422 SW 96th St, Oklahoma City, OK 73159
$-93
Cash flow
-2.4%
Cash-on-Cash Return
5.1%
Cap rate
0.7%
Rent to Value Ratio
Active
$242,000
4
bds
|
3
ba
|
0
sqft
|
built
1958
3029 N Tulsa Dr, Oklahoma City, OK 73107
$-243
Cash flow
-5.2%
Cash-on-Cash Return
4.5%
Cap rate
0.7%
Rent to Value Ratio
Active
$849,000
3
bds
|
5
ba
|
0
sqft
|
built
2022
905 NW 44th St, Oklahoma City, OK 73118
$-612
Cash flow
-3.8%
Cash-on-Cash Return
4.8%
Cap rate
0.6%
Rent to Value Ratio
Active
$549,000
3
bds
|
3
ba
|
0
sqft
|
built
1928
726 NE 17th St, Oklahoma City, OK 73105
$-883
Cash flow
-8.4%
Cash-on-Cash Return
3.7%
Cap rate
0.6%
Rent to Value Ratio
Active
$314,000
4
bds
|
2
ba
|
0
sqft
|
built
2014
14512 Briarcliff Dr, Oklahoma City, OK 73170
$-447
Cash flow
-7.4%
Cash-on-Cash Return
4.0%
Cap rate
0.6%
Rent to Value Ratio
Active
$314,900
3
bds
|
2
ba
|
0
sqft
|
built
1995
13400 Northstar Dr, Oklahoma City, OK 73142
$-383
Cash flow
-6.3%
Cash-on-Cash Return
4.2%
Cap rate
0.6%
Rent to Value Ratio
Active
$199,000
3
bds
|
2
ba
|
0
sqft
|
built
1947
4516 N Miller Ave, Oklahoma City, OK 73112
$-76
Cash flow
-2.0%
Cash-on-Cash Return
5.2%
Cap rate
0.8%
Rent to Value Ratio
Active
$321,437
3
bds
|
2
ba
|
0
sqft
|
built
2025
8509 SW 76th St, Oklahoma City, OK 73169
$-97
Cash flow
-1.6%
Cash-on-Cash Return
5.3%
Cap rate
0.7%
Rent to Value Ratio
Active
$629,900
5
bds
|
4
ba
|
0
sqft
|
built
2009
15228 Turtle Lake Pl, Oklahoma City, OK 73165
$-1,354
Cash flow
-11.2%
Cash-on-Cash Return
3.1%
Cap rate
0.5%
Rent to Value Ratio
Active
$396,352
4
bds
|
3
ba
|
0
sqft
|
built
2025
8617 SW 76th St, Oklahoma City, OK 73169
$-590
Cash flow
-7.8%
Cash-on-Cash Return
3.9%
Cap rate
0.5%
Rent to Value Ratio
Active
$474,000
4
bds
|
3
ba
|
0
sqft
|
built
1975
12413 Arrowhead Ter, Oklahoma City, OK 73120
$-1,085
Cash flow
-11.9%
Cash-on-Cash Return
2.9%
Cap rate
0.5%
Rent to Value Ratio
Active
$362,000
4
bds
|
2
ba
|
0
sqft
|
built
2021
8501 NW 109th Ter, Oklahoma City, OK 73162
$-772
Cash flow
-11.1%
Cash-on-Cash Return
3.1%
Cap rate
0.6%
Rent to Value Ratio
Active
$299,900
3
bds
|
2
ba
|
0
sqft
|
built
2025
8600 SW 75th St, Oklahoma City, OK 73169
$-409
Cash flow
-7.1%
Cash-on-Cash Return
4.0%
Cap rate
0.5%
Rent to Value Ratio

Active
$299,000
3
bds
|
3
ba
|
0
sqft
|
built
1984
901 NW 7th St, Oklahoma City, OK 73106
$-900
Cash flow
-15.7%
Cash-on-Cash Return
2.1%
Cap rate
0.6%
Rent to Value Ratio
Active
$155,000
3
bds
|
2
ba
|
0
sqft
|
built
1971
920 NW 104th St, Oklahoma City, OK 73114
$10
Cash flow
0.3%
Cash-on-Cash Return
5.8%
Cap rate
0.8%
Rent to Value Ratio
Active
$134,000
2
bds
|
1
ba
|
0
sqft
|
built
1928
2145 SW 51st St, Oklahoma City, OK 73119
$248
Cash flow
9.7%
Cash-on-Cash Return
7.9%
Cap rate
1.0%
Rent to Value Ratio
Active
$335,415
4
bds
|
2
ba
|
0
sqft
|
built
2025
8604 SW 75th St, Oklahoma City, OK 73169
$-439
Cash flow
-6.8%
Cash-on-Cash Return
4.1%
Cap rate
0.5%
Rent to Value Ratio
Active
$350,000
3
bds
|
2
ba
|
0
sqft
|
built
1930
2829 NW 21st St, Oklahoma City, OK 73107
$-581
Cash flow
-8.7%
Cash-on-Cash Return
3.7%
Cap rate
0.6%
Rent to Value Ratio
Active
$169,000
3
bds
|
1
ba
|
0
sqft
|
built
1957
2233 SW 40th St, Oklahoma City, OK 73119
$-110
Cash flow
-3.4%
Cash-on-Cash Return
4.9%
Cap rate
0.7%
Rent to Value Ratio
Active
$309,990
4
bds
|
2
ba
|
0
sqft
|
built
2025
8516 SW 75th St, Oklahoma City, OK 73169
$-388
Cash flow
-6.5%
Cash-on-Cash Return
4.2%
Cap rate
0.5%
Rent to Value Ratio

Active
$289,000
3
bds
|
2
ba
|
0
sqft
|
built
1921
1729 W Park Pl, Oklahoma City, OK 73106
$-441
Cash flow
-8.0%
Cash-on-Cash Return
3.8%
Cap rate
0.6%
Rent to Value Ratio
Active
$889,000
4
bds
|
4
ba
|
0
sqft
|
built
2024
907 NW 44th St, Oklahoma City, OK 73118
$-1,146
Cash flow
-6.7%
Cash-on-Cash Return
4.1%
Cap rate
0.5%
Rent to Value Ratio