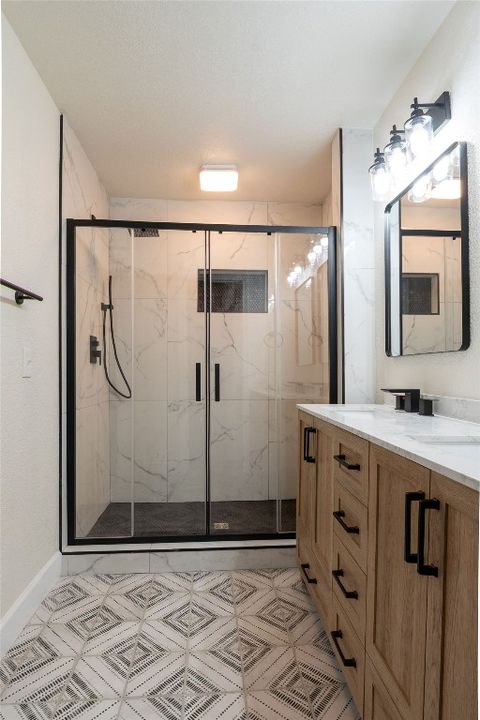
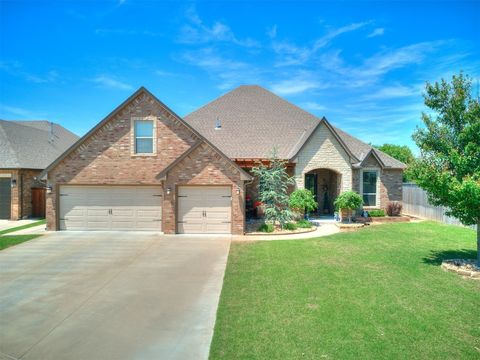
Oklahoma City, OK Investment Properties for Sale
Browse homes for sale and investment properties in Oklahoma City, OK. Refine your search by price, property type, or more.
Best cash flowing properties in Oklahoma City, OK
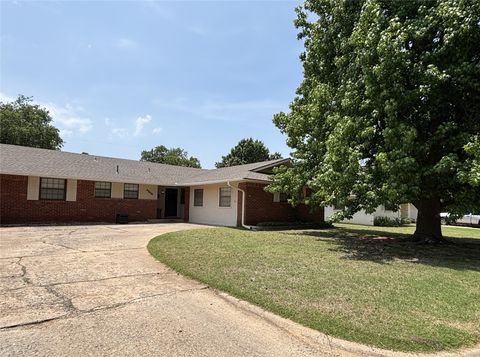
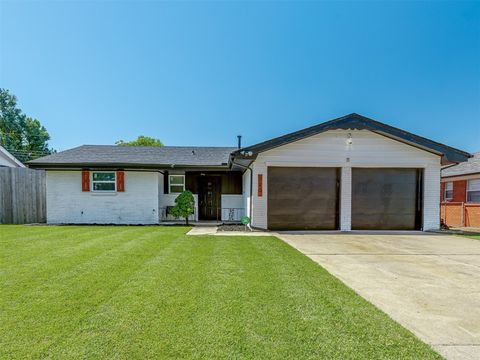
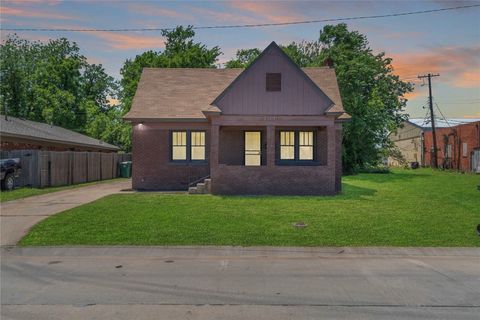
Active
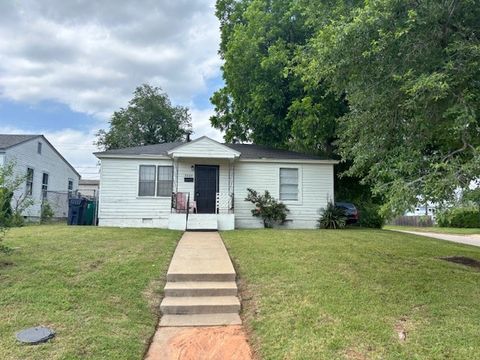
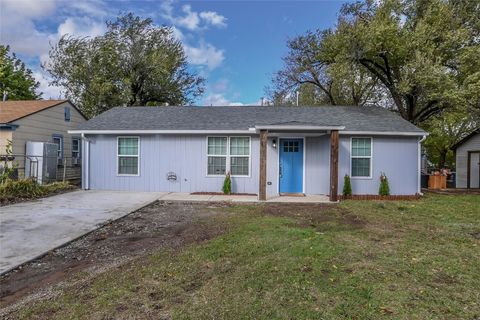
$97,000
3
bds
|
1
ba
|
0
sqft
|
built
1953
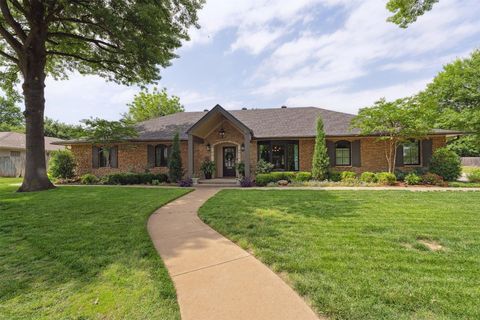
3229 NE 14th Pl, Oklahoma City, OK 73117
$198
Cash flow
10.6%
Cash-on-Cash Return
8.1%
Cap rate
1.0%
Rent to Value Ratio

Active
$198,000
3
bds
|
3
ba
|
0
sqft
|
built
1927
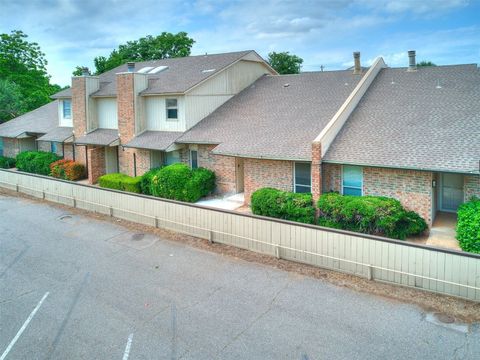
929 NE 17th St, Oklahoma City, OK 73105
$93
Cash flow
2.5%
Cash-on-Cash Return
6.2%
Cap rate
0.8%
Rent to Value Ratio
1,423 out of 1,802 properties for sale in Oklahoma City, OK
Limited Results Shown
Create a free account, or log in to reveal all property listings and enjoy the complete experience.
Active
$420,000
4
bds
|
3
ba
|
0
sqft
|
built
1978
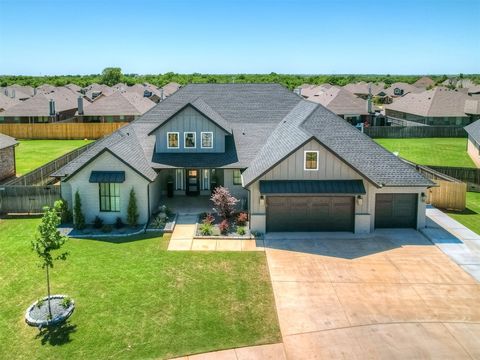
2208 Amber Rd, Oklahoma City, OK 73170
$-638
Cash flow
-7.9%
Cash-on-Cash Return
3.9%
Cap rate
0.7%
Rent to Value Ratio

Active
$193,000
3
bds
|
2
ba
|
0
sqft
|
built
1981
5902 Fox Run Way, Oklahoma City, OK 73142
$-98
Cash flow
-2.6%
Cash-on-Cash Return
5.1%
Cap rate
0.7%
Rent to Value Ratio
Active
$215,000
4
bds
|
2
ba
|
0
sqft
|
built
1930
2022 NW 30th St, Oklahoma City, OK 73118
$-301
Cash flow
-7.3%
Cash-on-Cash Return
4.0%
Cap rate
0.5%
Rent to Value Ratio
Active
$209,000
3
bds
|
2
ba
|
0
sqft
|
built
1928
929 NE 21st St, Oklahoma City, OK 73105
$17
Cash flow
0.4%
Cash-on-Cash Return
5.8%
Cap rate
0.8%
Rent to Value Ratio
Active
$178,000
3
bds
|
2
ba
|
0
sqft
|
built
1952
2617 SW 43rd St, Oklahoma City, OK 73119
$78
Cash flow
2.3%
Cash-on-Cash Return
6.2%
Cap rate
0.8%
Rent to Value Ratio
Active
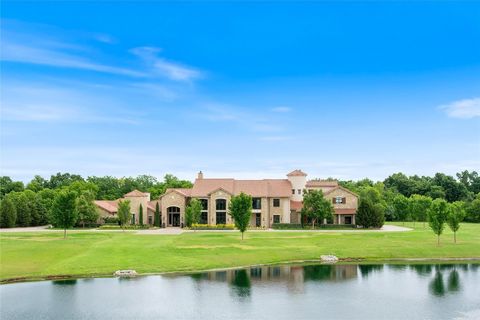
$5,900,000
4
bds
|
8
ba
|
0
sqft
|
built
2016
4400 NW 150th St, Oklahoma City, OK 73134
$-26,888
Cash flow
-23.8%
Cash-on-Cash Return
0.2%
Cap rate
0.1%
Rent to Value Ratio
Active
$849,000
3
bds
|
3
ba
|
0
sqft
|
built
1935
915 NW 40th St, Oklahoma City, OK 73118
$-2,288
Cash flow
-14.1%
Cash-on-Cash Return
2.4%
Cap rate
0.4%
Rent to Value Ratio
Active
$234,900
3
bds
|
2
ba
|
0
sqft
|
built
2008
7909 Dawn Cir, Oklahoma City, OK 73135
$-199
Cash flow
-4.4%
Cash-on-Cash Return
4.7%
Cap rate
0.7%
Rent to Value Ratio
Active
$230,000
4
bds
|
2
ba
|
0
sqft
|
built
1960
4308 NW 60th Pl, Oklahoma City, OK 73112
$-7
Cash flow
-0.2%
Cash-on-Cash Return
5.6%
Cap rate
0.8%
Rent to Value Ratio
Active
$294,900
4
bds
|
2
ba
|
0
sqft
|
built
2005
3105 SW 104th Ter, Oklahoma City, OK 73159
$-401
Cash flow
-7.1%
Cash-on-Cash Return
4.0%
Cap rate
0.6%
Rent to Value Ratio
Active
$565,000
4
bds
|
3
ba
|
0
sqft
|
built
2018
12801 Red Spruce Cir, Oklahoma City, OK 73142
$-1,317
Cash flow
-12.2%
Cash-on-Cash Return
2.9%
Cap rate
0.5%
Rent to Value Ratio
Active
$385,555
4
bds
|
3
ba
|
0
sqft
|
built
1963
6005 Kingston Rd, Oklahoma City, OK 73122
$-532
Cash flow
-7.2%
Cash-on-Cash Return
4.0%
Cap rate
0.6%
Rent to Value Ratio
Active
$365,000
3
bds
|
2
ba
|
0
sqft
|
built
2021
8516 Gibbs Dr, Oklahoma City, OK 73135
$-550
Cash flow
-7.9%
Cash-on-Cash Return
3.9%
Cap rate
0.6%
Rent to Value Ratio
Active
$145,900
3
bds
|
1
ba
|
0
sqft
|
built
1949
2107 NE 26th St, Oklahoma City, OK 73111
$39
Cash flow
1.4%
Cash-on-Cash Return
6.0%
Cap rate
0.8%
Rent to Value Ratio
Active
$589,000
3
bds
|
4
ba
|
0
sqft
|
built
2018
11616 Marbella Dr, Oklahoma City, OK 73173
$-883
Cash flow
-7.8%
Cash-on-Cash Return
3.9%
Cap rate
0.6%
Rent to Value Ratio

Active
$300,000
4
bds
|
3
ba
|
0
sqft
|
built
1925
1604 NW 29th St, Oklahoma City, OK 73106
$-145
Cash flow
-2.5%
Cash-on-Cash Return
5.1%
Cap rate
0.7%
Rent to Value Ratio
Active
$174,900
3
bds
|
2
ba
|
0
sqft
|
built
1972
3913 SE 54th St, Oklahoma City, OK 73135
$-33
Cash flow
-1.0%
Cash-on-Cash Return
5.5%
Cap rate
0.8%
Rent to Value Ratio

Active
$329,900
3
bds
|
2
ba
|
0
sqft
|
built
1956
6201 N Styll Rd, Oklahoma City, OK 73112
$-305
Cash flow
-4.8%
Cash-on-Cash Return
4.6%
Cap rate
0.7%
Rent to Value Ratio
Active
$775,000
3
bds
|
3
ba
|
0
sqft
|
built
1958
1201 Westchester Dr, Oklahoma City, OK 73114
$-1,990
Cash flow
-13.4%
Cash-on-Cash Return
2.6%
Cap rate
0.4%
Rent to Value Ratio
Active
$168,000
2
bds
|
2
ba
|
0
sqft
|
built
1978
10125 N Pennsylvania Ave, Oklahoma City, OK 73120
$-69
Cash flow
-2.1%
Cash-on-Cash Return
5.2%
Cap rate
0.9%
Rent to Value Ratio
Active
$539,900
3
bds
|
3
ba
|
0
sqft
|
built
2022
3805 Bridge Wood Ln, Oklahoma City, OK 73179
$-980
Cash flow
-9.5%
Cash-on-Cash Return
3.5%
Cap rate
0.6%
Rent to Value Ratio
Active
$249,800
2
bds
|
2
ba
|
0
sqft
|
built
1982
600 NW 4th St, Oklahoma City, OK 73102
$-728
Cash flow
-15.2%
Cash-on-Cash Return
2.2%
Cap rate
0.6%
Rent to Value Ratio
Active
$198,000
3
bds
|
3
ba
|
0
sqft
|
built
1927
929 NE 17th St, Oklahoma City, OK 73105
$93
Cash flow
2.5%
Cash-on-Cash Return
6.2%
Cap rate
0.8%
Rent to Value Ratio
Active
$190,000
3
bds
|
2
ba
|
0
sqft
|
built
1965
6508 S Harvey Ave, Oklahoma City, OK 73139
$20
Cash flow
0.5%
Cash-on-Cash Return
5.8%
Cap rate
0.8%
Rent to Value Ratio
Active
$195,000
4
bds
|
2
ba
|
0
sqft
|
built
1964
5712 NW 34th St, Oklahoma City, OK 73122
$63
Cash flow
1.7%
Cash-on-Cash Return
6.1%
Cap rate
0.8%
Rent to Value Ratio
Active
$305,000
4
bds
|
2
ba
|
0
sqft
|
built
1983
6013 Greenview Dr, Oklahoma City, OK 73135
$-412
Cash flow
-7.0%
Cash-on-Cash Return
4.1%
Cap rate
0.6%
Rent to Value Ratio
Active
$280,000
4
bds
|
3
ba
|
0
sqft
|
built
1977
9800 Hummingbird Ln, Oklahoma City, OK 73162
$-150
Cash flow
-2.8%
Cash-on-Cash Return
5.0%
Cap rate
0.7%
Rent to Value Ratio
Active
$209,350
3
bds
|
2
ba
|
0
sqft
|
built
1961
520 SW 68th St, Oklahoma City, OK 73139
$-103
Cash flow
-2.6%
Cash-on-Cash Return
5.1%
Cap rate
0.8%
Rent to Value Ratio

Active
$190,000
2
bds
|
3
ba
|
0
sqft
|
built
1974
3009 W Wilshire Blvd, Oklahoma City, OK 73116
$-86
Cash flow
-2.4%
Cash-on-Cash Return
5.1%
Cap rate
0.7%
Rent to Value Ratio
Active
$447,500
3
bds
|
2
ba
|
0
sqft
|
built
2007
6501 SE 162nd St, Oklahoma City, OK 73165
$-578
Cash flow
-6.7%
Cash-on-Cash Return
4.1%
Cap rate
0.6%
Rent to Value Ratio

Active
$537,000
3
bds
|
3
ba
|
0
sqft
|
built
1940
516 NW 37th St, Oklahoma City, OK 73118
$-1,115
Cash flow
-10.8%
Cash-on-Cash Return
3.2%
Cap rate
0.5%
Rent to Value Ratio
Active
$365,000
3
bds
|
2
ba
|
0
sqft
|
built
1999
8413 NW 64th Ter, Oklahoma City, OK 73132
$-451
Cash flow
-6.4%
Cash-on-Cash Return
4.2%
Cap rate
0.6%
Rent to Value Ratio
Active
$250,000
3
bds
|
2
ba
|
0
sqft
|
built
1965
1309 NW 106th St, Oklahoma City, OK 73114
$-216
Cash flow
-4.5%
Cash-on-Cash Return
4.6%
Cap rate
0.6%
Rent to Value Ratio
Active
$255,000
3
bds
|
2
ba
|
0
sqft
|
built
1973
4909 NE 38th St, Oklahoma City, OK 73121
$-543
Cash flow
-11.1%
Cash-on-Cash Return
3.1%
Cap rate
0.4%
Rent to Value Ratio
Active
$199,999
3
bds
|
1
ba
|
0
sqft
|
built
1941
2508 Cummings Dr, Oklahoma City, OK 73107
$-143
Cash flow
-3.7%
Cash-on-Cash Return
4.8%
Cap rate
0.7%
Rent to Value Ratio
Active
$350,000
3
bds
|
2
ba
|
0
sqft
|
built
1958
2728 Kerry Ln, Oklahoma City, OK 73120
$-592
Cash flow
-8.8%
Cash-on-Cash Return
3.6%
Cap rate
0.6%
Rent to Value Ratio
Active
$565,000
4
bds
|
4
ba
|
0
sqft
|
built
2019
12713 Preakness Rd, Oklahoma City, OK 73173
$-1,062
Cash flow
-9.8%
Cash-on-Cash Return
3.4%
Cap rate
0.5%
Rent to Value Ratio
Active
$175,000
2
bds
|
1
ba
|
0
sqft
|
built
1929
2301 N Kelham Ave, Oklahoma City, OK 73111
$-217
Cash flow
-6.5%
Cash-on-Cash Return
4.2%
Cap rate
0.6%
Rent to Value Ratio
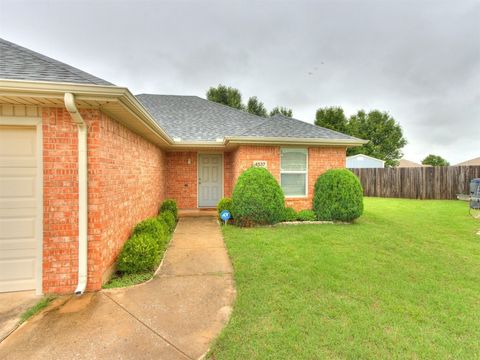
Active
$199,900
3
bds
|
2
ba
|
0
sqft
|
built
2007
4537 SE 80th St, Oklahoma City, OK 73135
$-7
Cash flow
-0.2%
Cash-on-Cash Return
5.6%
Cap rate
0.8%
Rent to Value Ratio
Active
$97,000
3
bds
|
1
ba
|
0
sqft
|
built
1953
3229 NE 14th Pl, Oklahoma City, OK 73117
$198
Cash flow
10.6%
Cash-on-Cash Return
8.1%
Cap rate
1.0%
Rent to Value Ratio