Oklahoma City, OK Investment Properties for Sale
Browse homes for sale and investment properties in Oklahoma City, OK. Refine your search by price, property type, or more.
Best cash flowing properties in Oklahoma City, OK
Pending
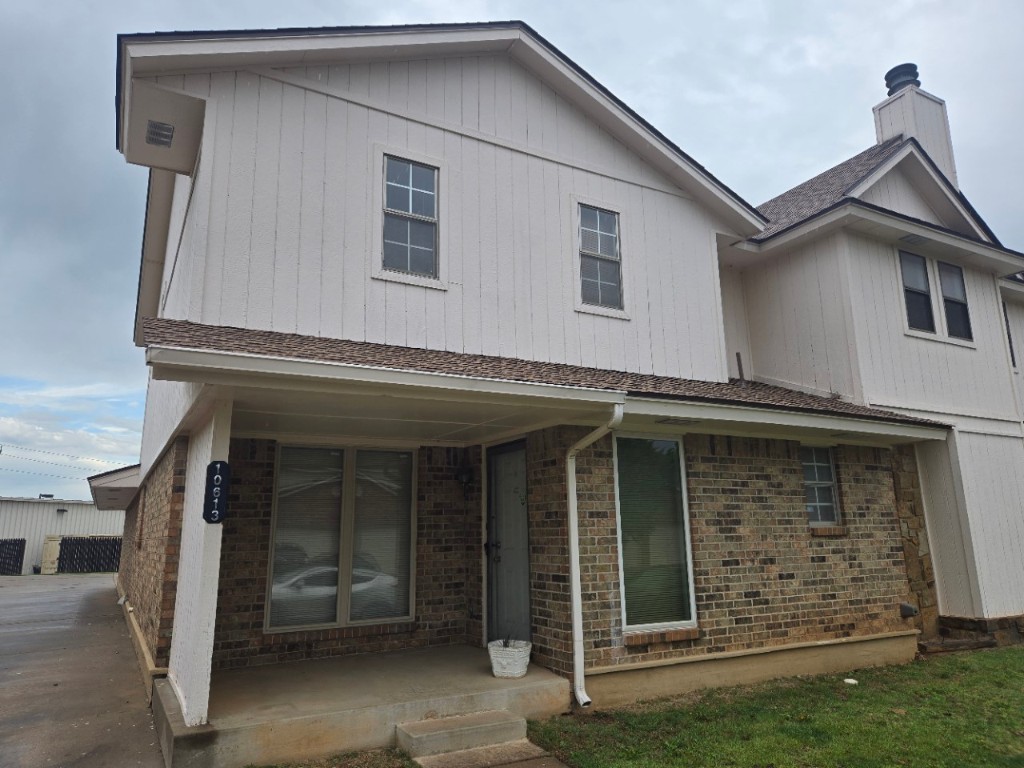
$115,000
2
bds
|
3
ba
|
0
sqft
|
built
1984
10613 White Oak Canyon Rd, Oklahoma City, OK 73162
$226
Cash flow
10.3%
Cash-on-Cash Return
8.6%
Cap rate
1.2%
Rent to Value Ratio
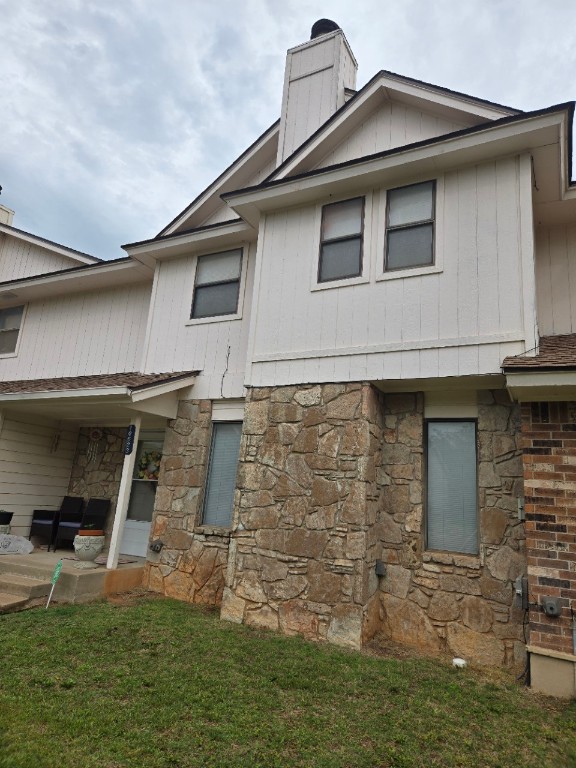
Pending
$148,500
3
bds
|
3
ba
|
0
sqft
|
built
1984
10623 White Oak Canyon Rd, Oklahoma City, OK 73162
$48
Cash flow
1.7%
Cash-on-Cash Return
6.7%
Cap rate
0.9%
Rent to Value Ratio
1,293 out of 1,655 properties for sale in Oklahoma City, OK
Limited Results Shown
Create a free account, or log in to reveal all property listings and enjoy the complete experience.
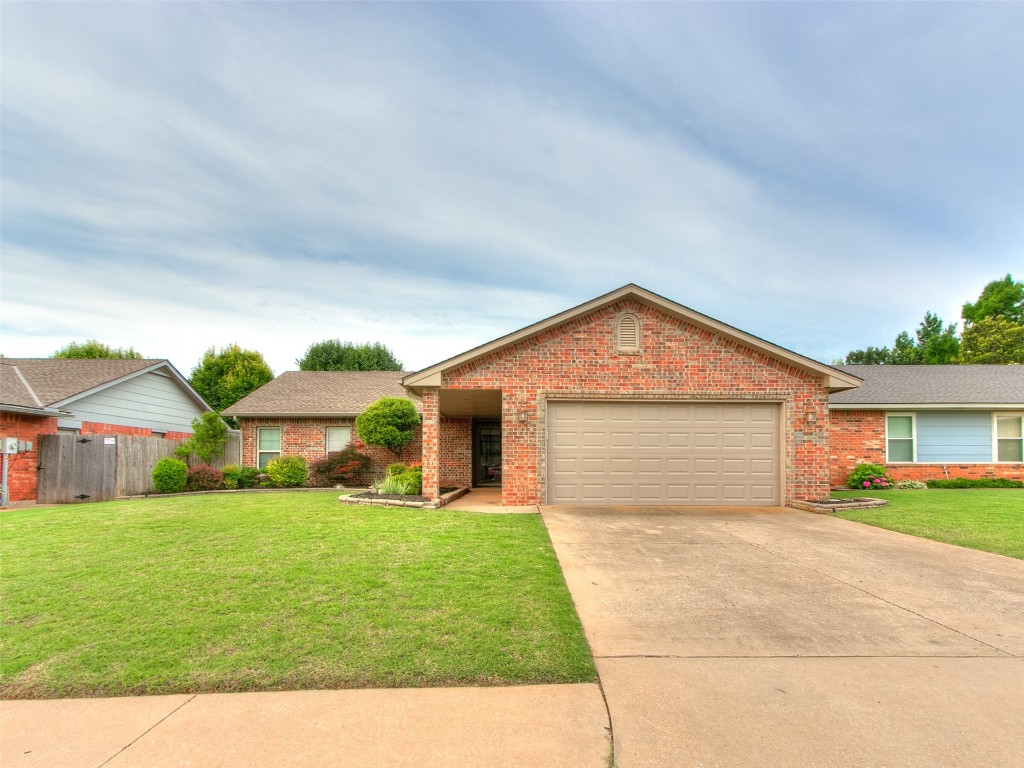
Pending
$234,000
3
bds
|
2
ba
|
0
sqft
|
built
1983
7204 Walnut Creek Dr, Oklahoma City, OK 73142
$-299
Cash flow
-6.7%
Cash-on-Cash Return
4.7%
Cap rate
0.7%
Rent to Value Ratio
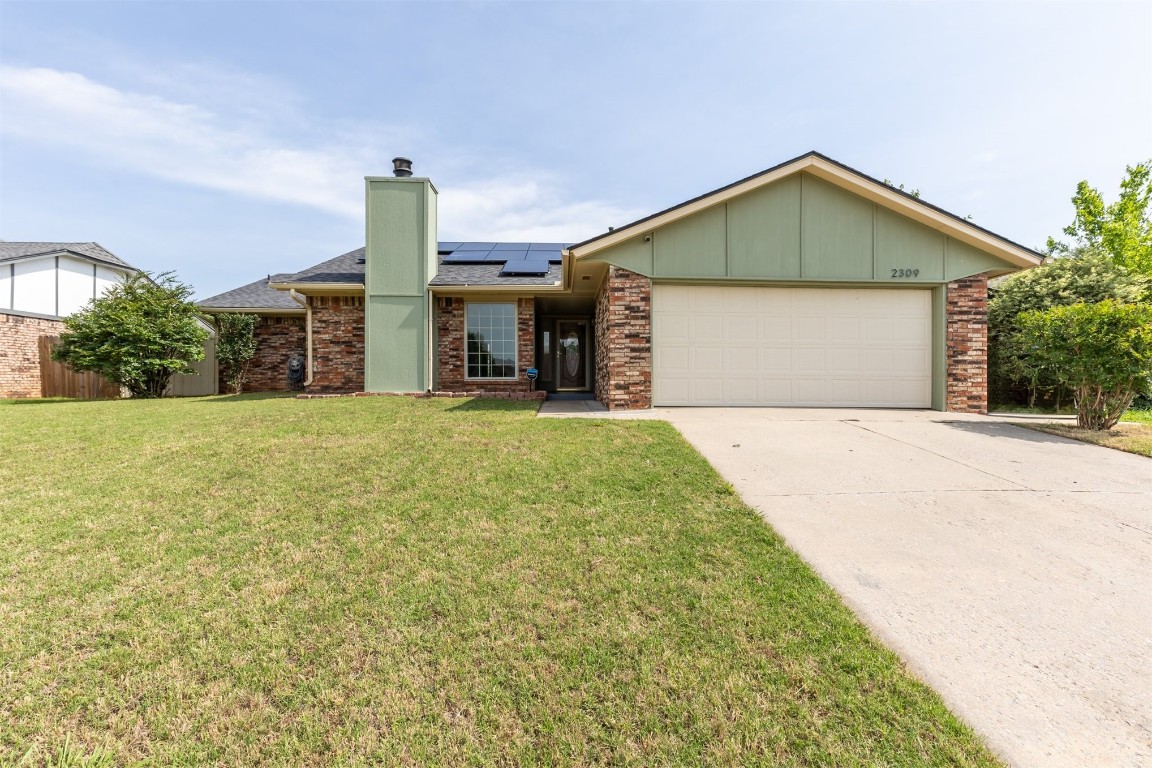
Active
$235,000
3
bds
|
2
ba
|
0
sqft
|
built
1984
2309 Morning Glory Dr, Oklahoma City, OK 73159
$-328
Cash flow
-7.3%
Cash-on-Cash Return
4.6%
Cap rate
0.7%
Rent to Value Ratio
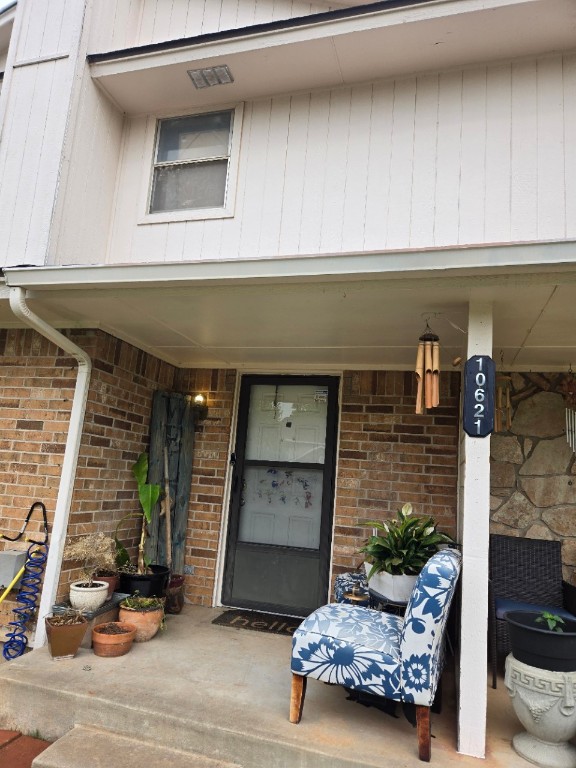
Pending
$150,000
2
bds
|
3
ba
|
0
sqft
|
built
1984
10621 White Oak Canyon Rd, Oklahoma City, OK 73162
$40
Cash flow
1.4%
Cash-on-Cash Return
6.6%
Cap rate
0.9%
Rent to Value Ratio
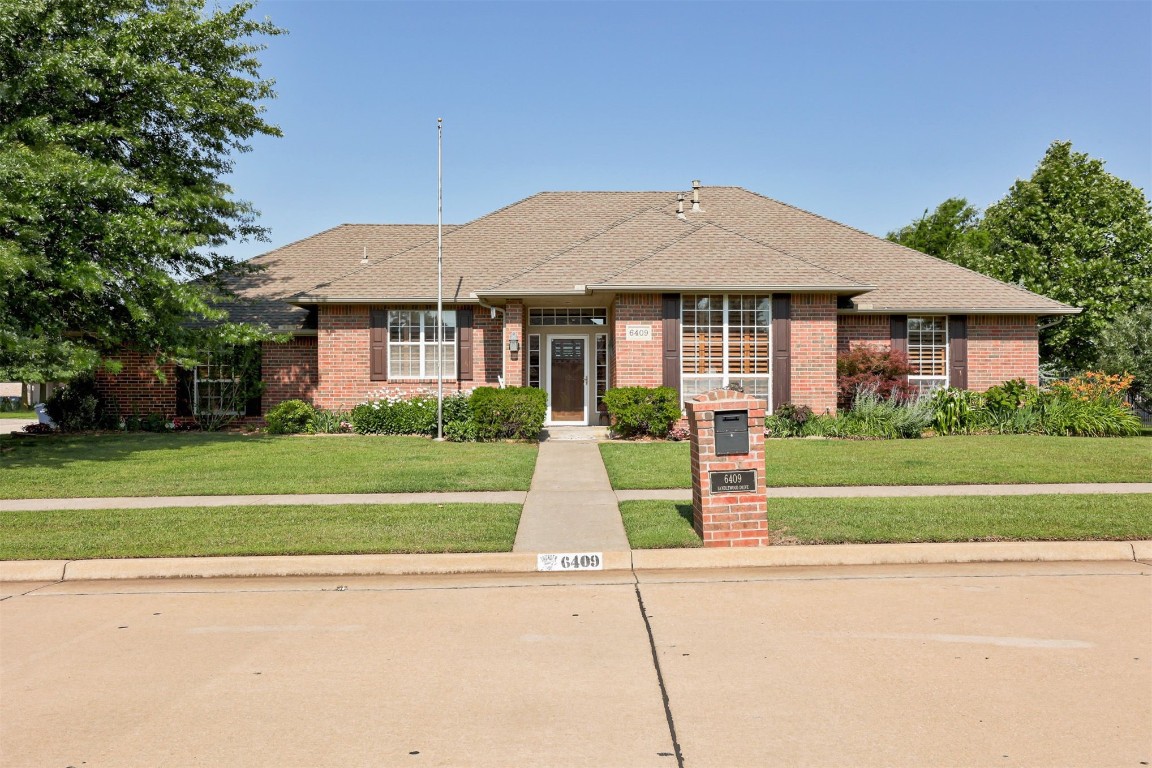
Pending
$392,500
3
bds
|
3
ba
|
0
sqft
|
built
1999
6409 Sandlewood Dr, Oklahoma City, OK 73132
$-856
Cash flow
-11.4%
Cash-on-Cash Return
3.7%
Cap rate
0.6%
Rent to Value Ratio
Pending
$115,000
2
bds
|
3
ba
|
0
sqft
|
built
1984
10613 White Oak Canyon Rd, Oklahoma City, OK 73162
$226
Cash flow
10.3%
Cash-on-Cash Return
8.6%
Cap rate
1.2%
Rent to Value Ratio
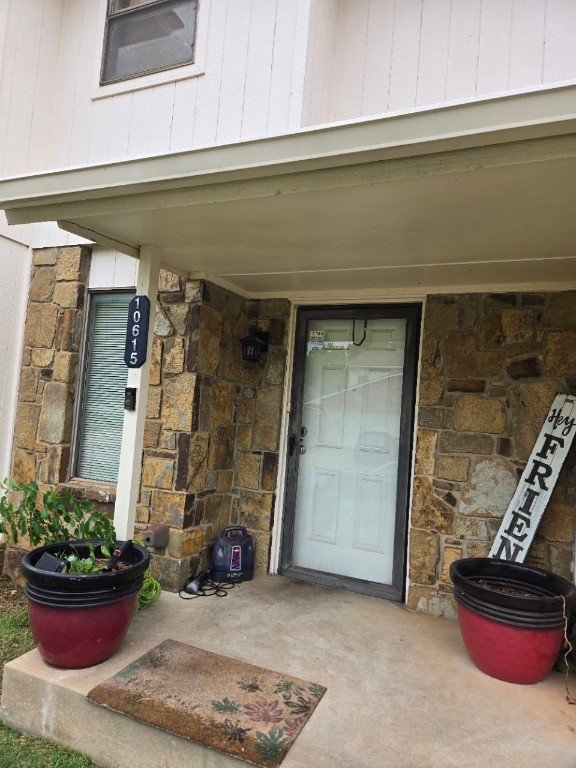
Pending
$148,500
3
bds
|
3
ba
|
0
sqft
|
built
1984
10615 White Oak Canyon Rd, Oklahoma City, OK 73162
$48
Cash flow
1.7%
Cash-on-Cash Return
6.7%
Cap rate
0.9%
Rent to Value Ratio
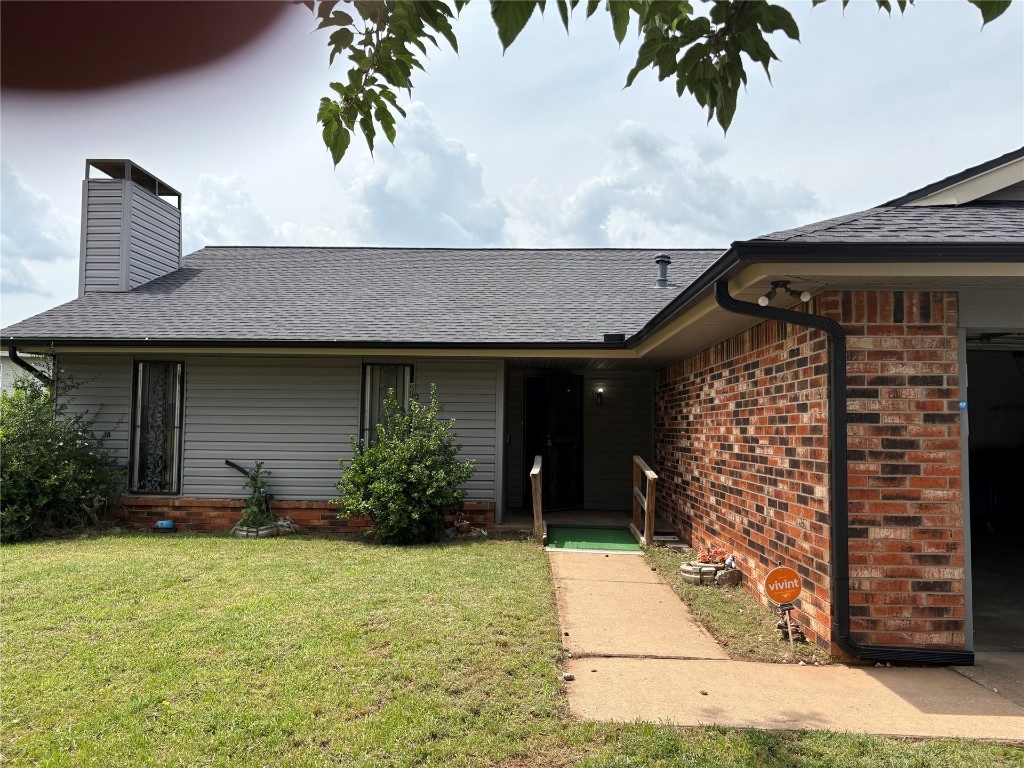
Active
$178,000
3
bds
|
2
ba
|
0
sqft
|
built
1979
833 NW 118th St, Oklahoma City, OK 73114
$-52
Cash flow
-1.5%
Cash-on-Cash Return
5.9%
Cap rate
0.8%
Rent to Value Ratio

Pending
$215,000
3
bds
|
2
ba
|
0
sqft
|
built
2016
1424 NW 127th St, Oklahoma City, OK 73120
$-266
Cash flow
-6.5%
Cash-on-Cash Return
4.8%
Cap rate
0.7%
Rent to Value Ratio
Active
$629,900
4
bds
|
4
ba
|
0
sqft
|
built
2018
11620 Mallorca Dr, Oklahoma City, OK 73173
$-1,693
Cash flow
-14.0%
Cash-on-Cash Return
3.1%
Cap rate
0.5%
Rent to Value Ratio
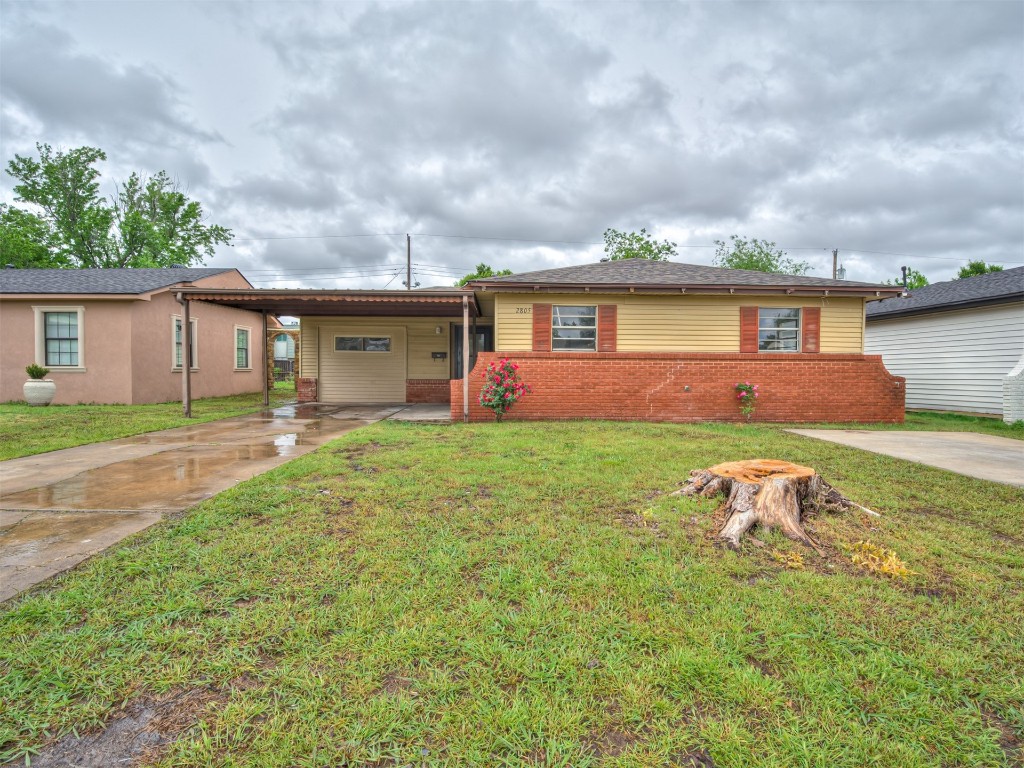
Active
$169,000
4
bds
|
1
ba
|
0
sqft
|
built
1959
2805 SW 60th St, Oklahoma City, OK 73159
$-222
Cash flow
-6.9%
Cash-on-Cash Return
4.7%
Cap rate
0.7%
Rent to Value Ratio
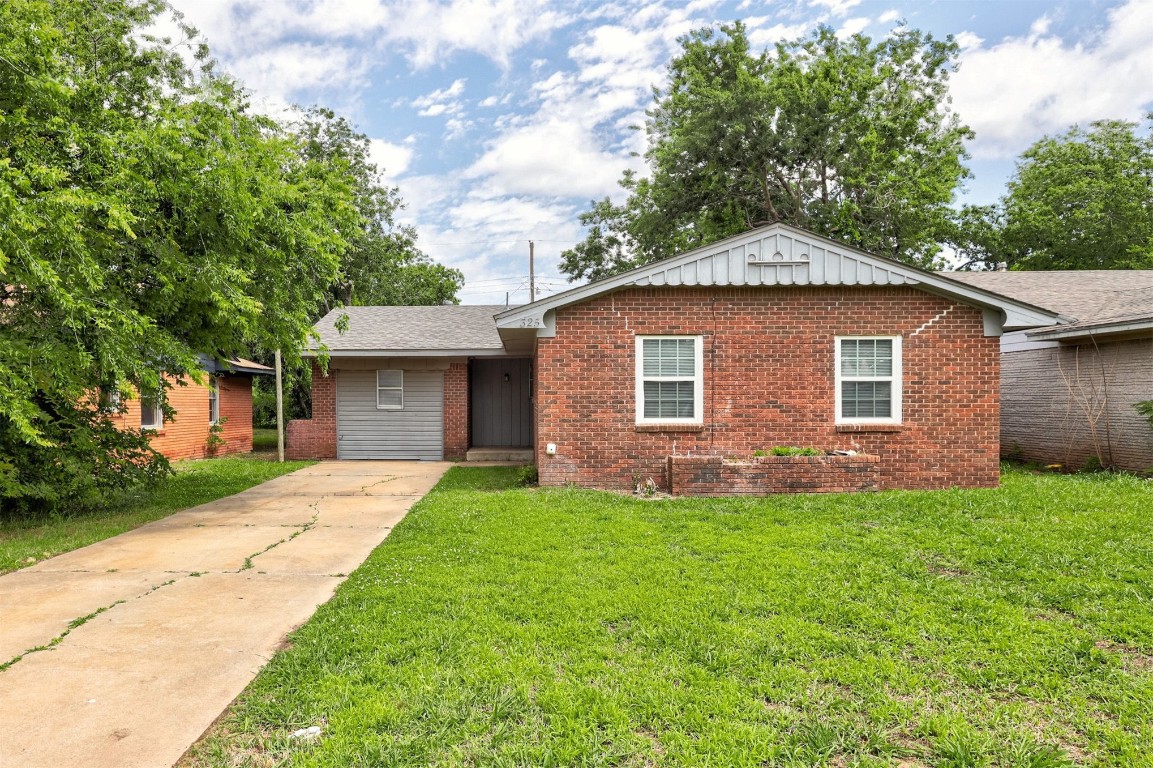
Active
$135,000
3
bds
|
2
ba
|
0
sqft
|
built
1961
325 NW 84th St, Oklahoma City, OK 73114
$-46
Cash flow
-1.8%
Cash-on-Cash Return
5.9%
Cap rate
0.8%
Rent to Value Ratio
Active
$360,000
3
bds
|
2
ba
|
0
sqft
|
built
2007
1604 W Palm Pl, Oklahoma City, OK 73128
$-1,084
Cash flow
-15.7%
Cash-on-Cash Return
2.7%
Cap rate
0.4%
Rent to Value Ratio
Active
$172,000
3
bds
|
2
ba
|
0
sqft
|
built
1966
1540 Bradley Pl, Oklahoma City, OK 73127
$-140
Cash flow
-4.2%
Cash-on-Cash Return
5.3%
Cap rate
0.8%
Rent to Value Ratio
Pending
$148,500
3
bds
|
3
ba
|
0
sqft
|
built
1984
10623 White Oak Canyon Rd, Oklahoma City, OK 73162
$48
Cash flow
1.7%
Cash-on-Cash Return
6.7%
Cap rate
0.9%
Rent to Value Ratio
Active
$750,000
3
bds
|
3
ba
|
0
sqft
|
built
2014
925 NW 8th St, Oklahoma City, OK 73106
$-2,745
Cash flow
-19.1%
Cash-on-Cash Return
1.9%
Cap rate
0.3%
Rent to Value Ratio
Pending
$445,000
5
bds
|
3
ba
|
0
sqft
|
built
2021
12709 Pinewood Ln, Oklahoma City, OK 73142
$-683
Cash flow
-8.0%
Cash-on-Cash Return
4.4%
Cap rate
0.7%
Rent to Value Ratio
Active
$316,630
3
bds
|
2
ba
|
0
sqft
|
built
2025
8616 SW 75th St, Oklahoma City, OK 73169
$-510
Cash flow
-8.4%
Cash-on-Cash Return
4.4%
Cap rate
0.5%
Rent to Value Ratio
Active
$995,000
4
bds
|
5
ba
|
0
sqft
|
built
1973
3312 E Hefner Rd, Oklahoma City, OK 73131
$-3,492
Cash flow
-18.3%
Cash-on-Cash Return
2.1%
Cap rate
0.3%
Rent to Value Ratio
Active
$450,000
3
bds
|
2
ba
|
0
sqft
|
built
1920
1218 NW 21st St, Oklahoma City, OK 73106
$-782
Cash flow
-9.1%
Cash-on-Cash Return
4.2%
Cap rate
0.6%
Rent to Value Ratio
Active
$350,000
4
bds
|
3
ba
|
0
sqft
|
built
1982
6513 NW 95th St, Oklahoma City, OK 73162
$-654
Cash flow
-9.7%
Cash-on-Cash Return
4.0%
Cap rate
0.6%
Rent to Value Ratio
Pending
$264,900
4
bds
|
3
ba
|
0
sqft
|
built
1973
1200 SW 97th St, Oklahoma City, OK 73139
$-357
Cash flow
-7.0%
Cash-on-Cash Return
4.7%
Cap rate
0.7%
Rent to Value Ratio
Active
$400,000
3
bds
|
3
ba
|
0
sqft
|
built
1940
2310 N Francis Ave, Oklahoma City, OK 73106
$-1,023
Cash flow
-13.3%
Cash-on-Cash Return
3.2%
Cap rate
0.4%
Rent to Value Ratio
Active
$296,904
3
bds
|
2
ba
|
0
sqft
|
built
2025
8608 SW 75th St, Oklahoma City, OK 73169
$-407
Cash flow
-7.2%
Cash-on-Cash Return
4.6%
Cap rate
0.6%
Rent to Value Ratio
Active
$625,000
3
bds
|
4
ba
|
0
sqft
|
built
1961
2917 Pelham Dr, Oklahoma City, OK 73120
$-1,558
Cash flow
-13.0%
Cash-on-Cash Return
3.3%
Cap rate
0.5%
Rent to Value Ratio
Active
$340,000
6
bds
|
5
ba
|
0
sqft
|
built
1984
11519 N Lincoln Blvd, Oklahoma City, OK 73114
$-713
Cash flow
-10.9%
Cash-on-Cash Return
3.8%
Cap rate
0.5%
Rent to Value Ratio
Active
$215,000
3
bds
|
2
ba
|
0
sqft
|
built
1962
7017 S Miller Blvd, Oklahoma City, OK 73159
$-220
Cash flow
-5.3%
Cash-on-Cash Return
5.1%
Cap rate
0.7%
Rent to Value Ratio
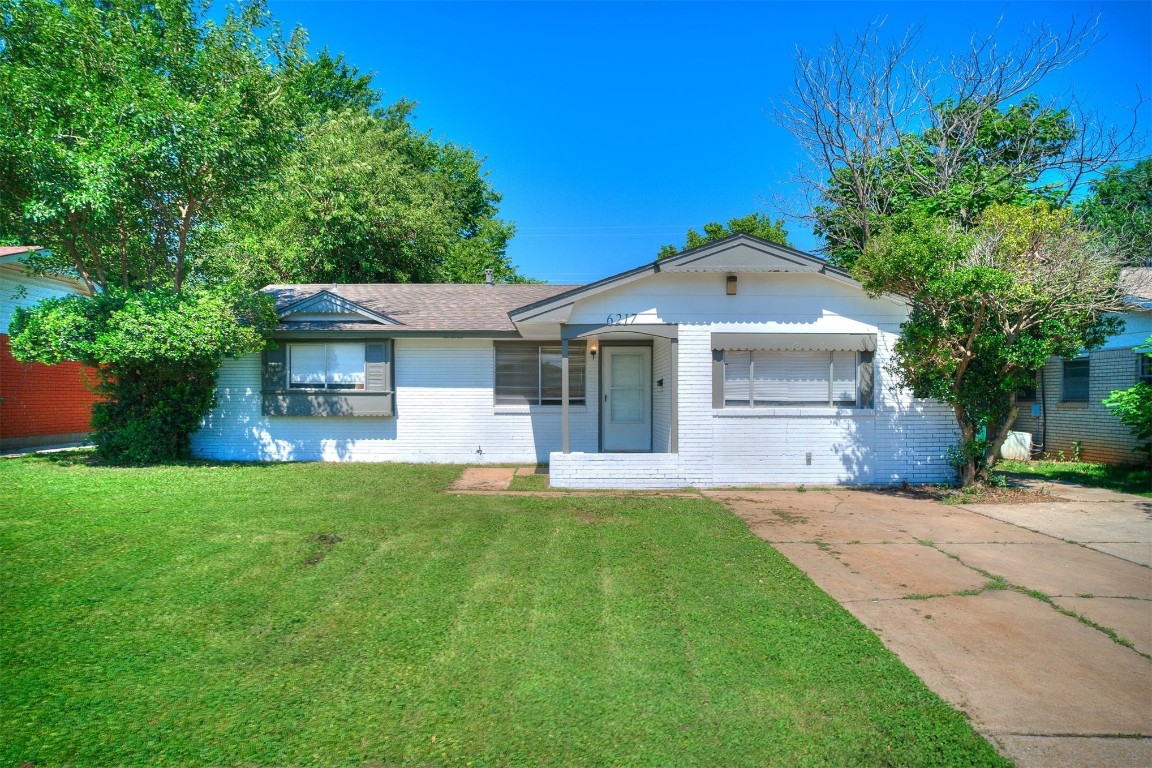
Active
$179,000
4
bds
|
2
ba
|
0
sqft
|
built
1965
6217 S Drexel Ave, Oklahoma City, OK 73159
$-70
Cash flow
-2.0%
Cash-on-Cash Return
5.8%
Cap rate
0.8%
Rent to Value Ratio
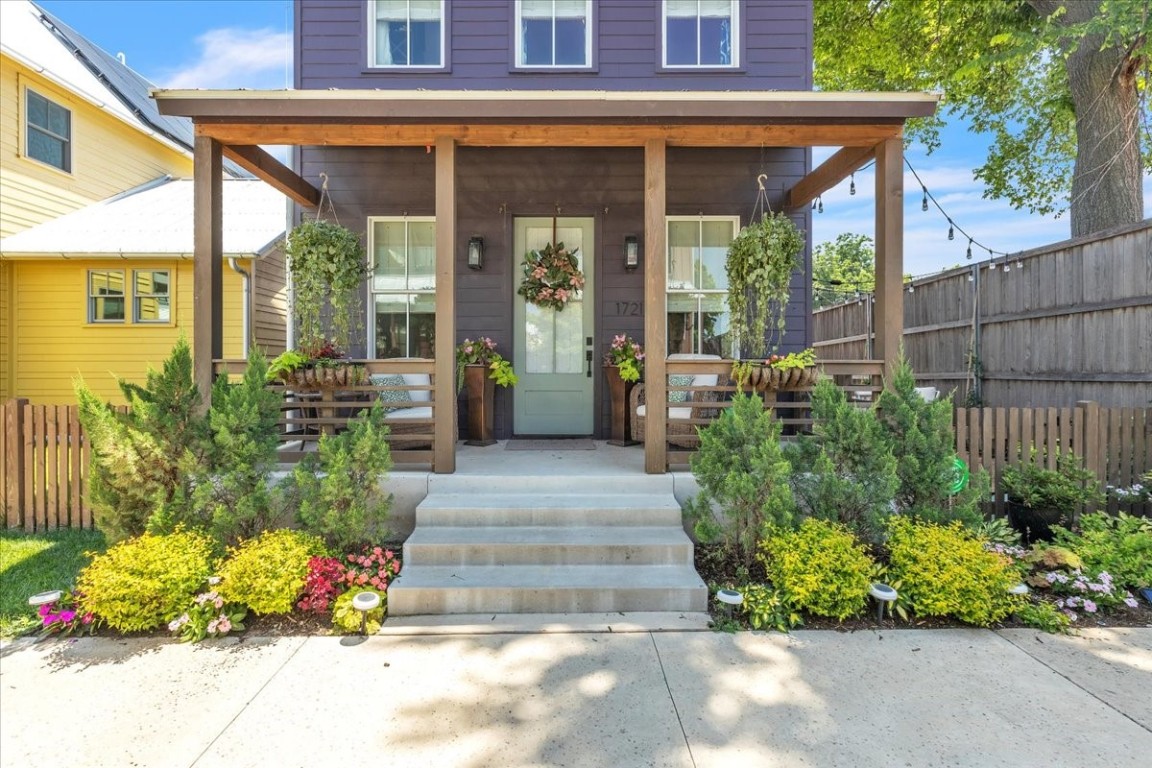
Active
$495,000
3
bds
|
3
ba
|
0
sqft
|
built
2022
1721 Oso Ave, Oklahoma City, OK 73108
$-1,716
Cash flow
-18.1%
Cash-on-Cash Return
2.1%
Cap rate
0.4%
Rent to Value Ratio
Pending
$100,000
2
bds
|
2
ba
|
0
sqft
|
built
1982
4400 Hemingway Dr, Oklahoma City, OK 73118
$-166
Cash flow
-8.7%
Cash-on-Cash Return
4.3%
Cap rate
1.1%
Rent to Value Ratio
Active
$260,000
3
bds
|
2
ba
|
0
sqft
|
built
2020
8728 SW 37th St, Oklahoma City, OK 73179
$-141
Cash flow
-2.8%
Cash-on-Cash Return
5.6%
Cap rate
0.7%
Rent to Value Ratio
Active
$269,000
4
bds
|
3
ba
|
0
sqft
|
built
1977
5201 SE 53rd St, Oklahoma City, OK 73135
$-386
Cash flow
-7.5%
Cash-on-Cash Return
4.6%
Cap rate
0.7%
Rent to Value Ratio
Pending
$220,000
3
bds
|
2
ba
|
0
sqft
|
built
1963
10620 Lyndon Rd, Oklahoma City, OK 73120
$-321
Cash flow
-7.6%
Cash-on-Cash Return
4.5%
Cap rate
0.7%
Rent to Value Ratio
Active
$297,990
3
bds
|
2
ba
|
0
sqft
|
built
2025
8601 SW 76th St, Oklahoma City, OK 73169
$-205
Cash flow
-3.6%
Cash-on-Cash Return
5.5%
Cap rate
0.7%
Rent to Value Ratio
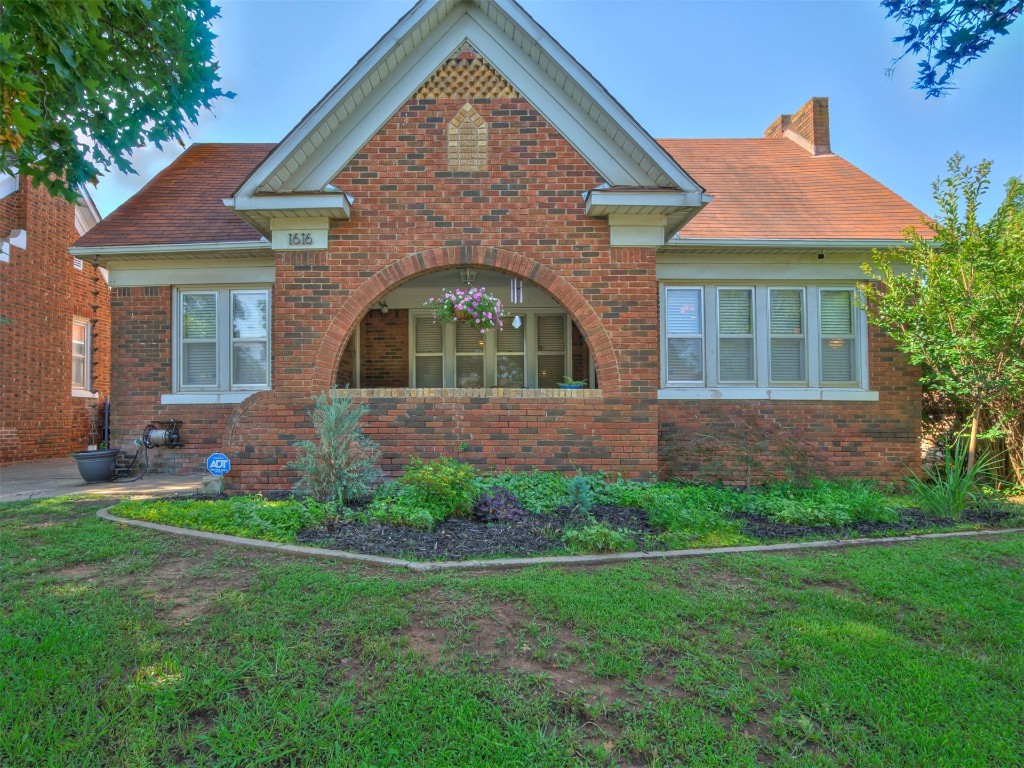
Active
$248,000
3
bds
|
1
ba
|
0
sqft
|
built
1925
1616 NW 41st St, Oklahoma City, OK 73118
$-448
Cash flow
-9.4%
Cash-on-Cash Return
4.1%
Cap rate
0.6%
Rent to Value Ratio
Pending
$240,000
2
bds
|
1
ba
|
0
sqft
|
built
1929
2629 NW 14th St, Oklahoma City, OK 73107
$-337
Cash flow
-7.3%
Cash-on-Cash Return
4.6%
Cap rate
0.7%
Rent to Value Ratio
Pending
$169,000
3
bds
|
1
ba
|
0
sqft
|
built
1950
4033 NW 28th St, Oklahoma City, OK 73107
$-81
Cash flow
-2.5%
Cash-on-Cash Return
5.7%
Cap rate
0.8%
Rent to Value Ratio
Active
$360,000
3
bds
|
2
ba
|
0
sqft
|
built
1923
1408 NW 22nd St, Oklahoma City, OK 73106
$-787
Cash flow
-11.4%
Cash-on-Cash Return
3.7%
Cap rate
0.5%
Rent to Value Ratio
Active
$124,990
2
bds
|
3
ba
|
0
sqft
|
built
1982
4400 Hemingway Dr, Oklahoma City, OK 73118
$-154
Cash flow
-6.4%
Cash-on-Cash Return
4.8%
Cap rate
1.1%
Rent to Value Ratio
Pending
$140,000
2
bds
|
1
ba
|
0
sqft
|
built
1949
741 SW 49th St, Oklahoma City, OK 73109
$-82
Cash flow
-3.1%
Cash-on-Cash Return
5.6%
Cap rate
0.8%
Rent to Value Ratio
Active
$219,000
3
bds
|
2
ba
|
0
sqft
|
built
1958
3914 NW 58th Ter, Oklahoma City, OK 73112
$-129
Cash flow
-3.1%
Cash-on-Cash Return
5.6%
Cap rate
0.7%
Rent to Value Ratio