Oklahoma City, OK Investment Properties for Sale
Browse homes for sale and investment properties in Oklahoma City, OK. Refine your search by price, property type, or more.
Best cash flowing properties in Oklahoma City, OK
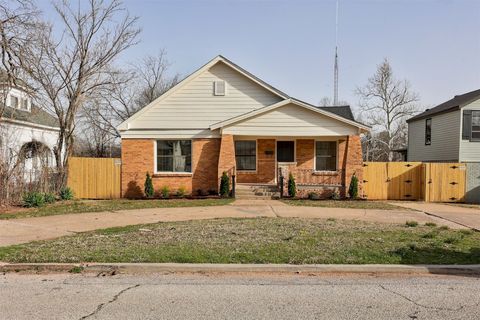
Active
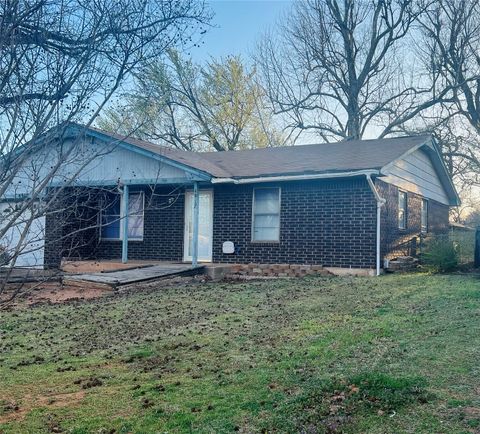
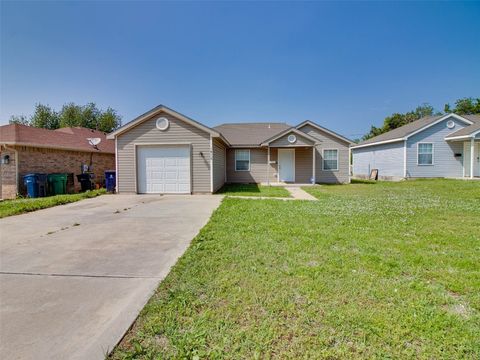
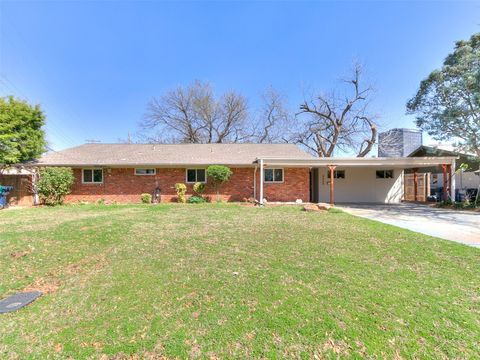
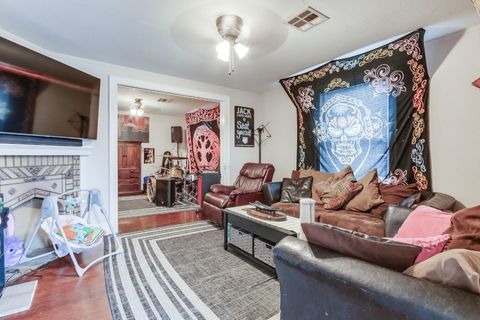
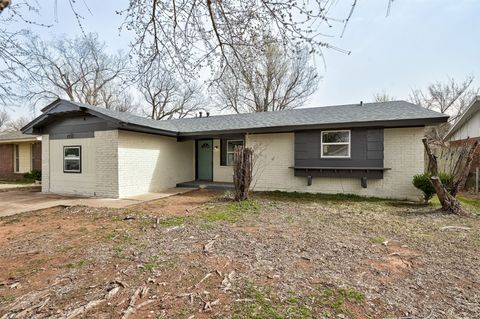
$120,000
2
bds
|
1
ba
|
0
sqft
|
built
1976
4912 Cinderella Dr, Oklahoma City, OK 73129
$250
Cash flow
10.9%
Cash-on-Cash Return
8.2%
Cap rate
1.1%
Rent to Value Ratio
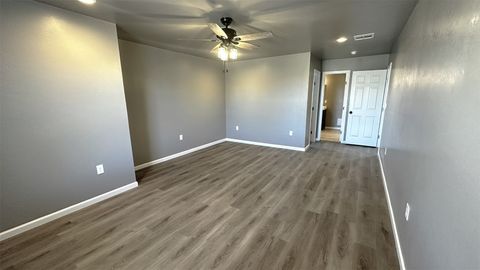
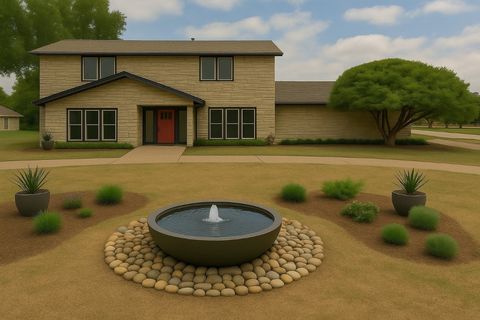
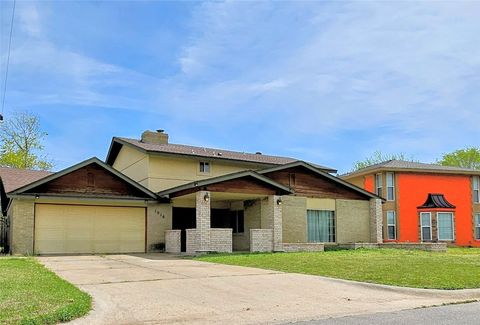
Active
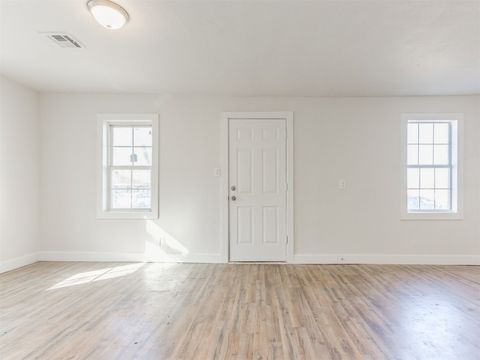
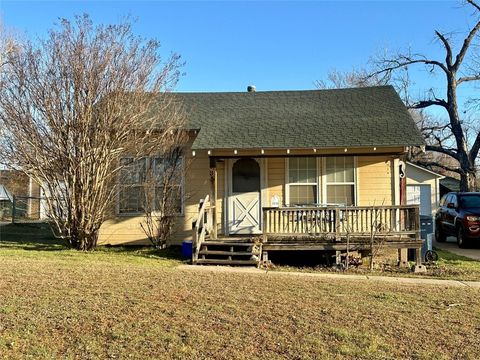
$279,000
4
bds
|
3
ba
|
0
sqft
|
built
2021
2921 SE 56th St, Oklahoma City, OK 73129
$164
Cash flow
3.1%
Cash-on-Cash Return
6.4%
Cap rate
0.8%
Rent to Value Ratio
1,420 out of 1,798 properties for sale in Oklahoma City, OK
Limited Results Shown
Create a free account, or log in to reveal all property listings and enjoy the complete experience.
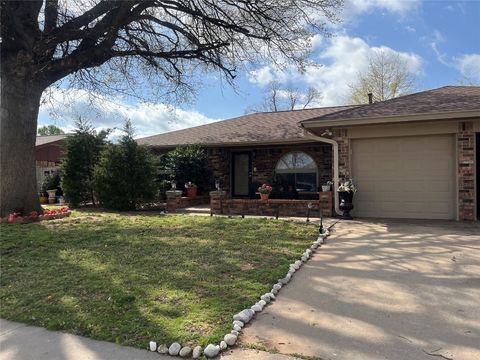
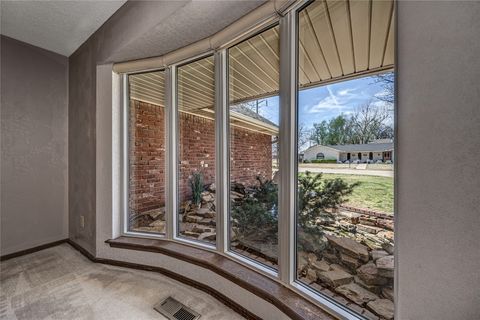
Active
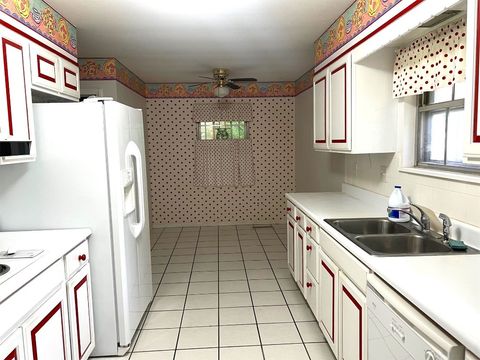
$298,500
3
bds
|
2
ba
|
0
sqft
|
built
1971
2416 SW 92nd St, Oklahoma City, OK 73159
$-383
Cash flow
-6.7%
Cash-on-Cash Return
4.1%
Cap rate
0.6%
Rent to Value Ratio
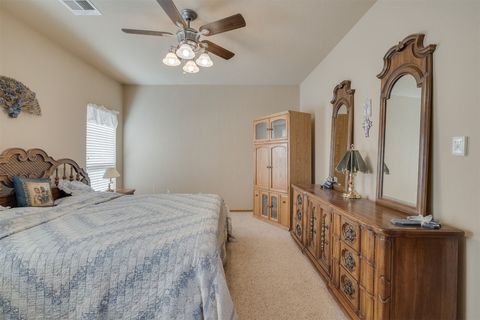
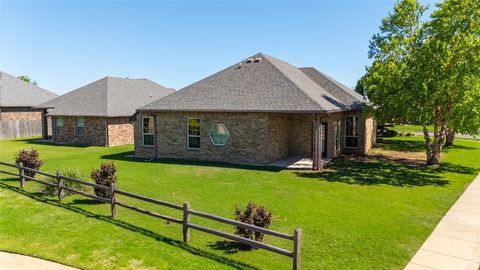
Active
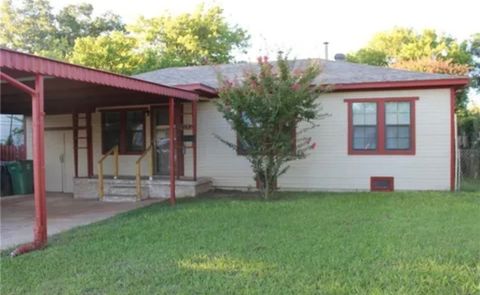
$245,000
2
bds
|
2
ba
|
0
sqft
|
built
2004
13440 Prairie View Ln, Oklahoma City, OK 73142
$-272
Cash flow
-5.8%
Cash-on-Cash Return
4.3%
Cap rate
0.7%
Rent to Value Ratio

Active
$474,900
4
bds
|
4
ba
|
0
sqft
|
built
2018
1413 N Mc Kinley Ave, Oklahoma City, OK 73106
$-735
Cash flow
-8.1%
Cash-on-Cash Return
3.8%
Cap rate
0.7%
Rent to Value Ratio
Active
$279,000
4
bds
|
3
ba
|
0
sqft
|
built
2021
2921 SE 56th St, Oklahoma City, OK 73129
$164
Cash flow
3.1%
Cash-on-Cash Return
6.4%
Cap rate
0.8%
Rent to Value Ratio
Active
$170,000
2
bds
|
2
ba
|
0
sqft
|
built
2007
1419 NW 98th St, Oklahoma City, OK 73114
$-113
Cash flow
-3.5%
Cash-on-Cash Return
4.9%
Cap rate
0.7%
Rent to Value Ratio
Active
$1,298,000
4
bds
|
4
ba
|
0
sqft
|
built
2023
13425 Creek Pointe Ln, Oklahoma City, OK 73131
$-5,639
Cash flow
-22.7%
Cash-on-Cash Return
0.5%
Cap rate
0.2%
Rent to Value Ratio
Active
$270,000
3
bds
|
2
ba
|
0
sqft
|
built
2002
14021 Harvest Cir, Oklahoma City, OK 73170
$-240
Cash flow
-4.6%
Cash-on-Cash Return
4.6%
Cap rate
0.7%
Rent to Value Ratio
Active
$240,000
4
bds
|
2
ba
|
0
sqft
|
built
1997
2213 SW 136th Pl, Oklahoma City, OK 73170
$-254
Cash flow
-5.5%
Cash-on-Cash Return
4.4%
Cap rate
0.7%
Rent to Value Ratio
Active
$255,000
4
bds
|
2
ba
|
0
sqft
|
built
1962
3225 NW 52nd St, Oklahoma City, OK 73112
$-131
Cash flow
-2.7%
Cash-on-Cash Return
5.1%
Cap rate
0.7%
Rent to Value Ratio
Active
$320,000
4
bds
|
3
ba
|
0
sqft
|
built
1964
3000 Kerry Ln, Oklahoma City, OK 73120
$-304
Cash flow
-5.0%
Cash-on-Cash Return
4.5%
Cap rate
0.7%
Rent to Value Ratio
Active
$395,000
4
bds
|
4
ba
|
0
sqft
|
built
1968
10900 Willow Grove Rd, Oklahoma City, OK 73120
$-361
Cash flow
-4.8%
Cash-on-Cash Return
4.6%
Cap rate
0.7%
Rent to Value Ratio
Active
$339,900
3
bds
|
2
ba
|
0
sqft
|
built
2013
17113 Avila Ln, Oklahoma City, OK 73170
$-546
Cash flow
-8.4%
Cash-on-Cash Return
3.8%
Cap rate
0.6%
Rent to Value Ratio
Active
$275,000
4
bds
|
2
ba
|
0
sqft
|
built
2014
8013 Hillers Rd, Oklahoma City, OK 73132
$-372
Cash flow
-7.1%
Cash-on-Cash Return
4.1%
Cap rate
0.6%
Rent to Value Ratio
Active
$249,900
3
bds
|
3
ba
|
0
sqft
|
built
2023
10332 NW 18th St, Oklahoma City, OK 73127
$-206
Cash flow
-4.3%
Cash-on-Cash Return
4.7%
Cap rate
0.7%
Rent to Value Ratio
Active
$249,000
3
bds
|
2
ba
|
0
sqft
|
built
1998
12500 Saint Andrews Dr, Oklahoma City, OK 73120
$-472
Cash flow
-9.9%
Cash-on-Cash Return
3.4%
Cap rate
0.7%
Rent to Value Ratio

Active
$135,000
2
bds
|
2
ba
|
0
sqft
|
built
1977
11435 N May Ave, Oklahoma City, OK 73120
$-189
Cash flow
-7.3%
Cash-on-Cash Return
4.0%
Cap rate
0.9%
Rent to Value Ratio
Active
$659,000
4
bds
|
3
ba
|
0
sqft
|
built
1968
10912 Willow Grove Rd, Oklahoma City, OK 73120
$-619
Cash flow
-4.9%
Cash-on-Cash Return
4.6%
Cap rate
0.6%
Rent to Value Ratio
Active
$500,000
5
bds
|
3
ba
|
0
sqft
|
built
1929
212 NW 32nd St, Oklahoma City, OK 73118
$-953
Cash flow
-9.9%
Cash-on-Cash Return
3.4%
Cap rate
0.6%
Rent to Value Ratio
Active
$225,000
3
bds
|
2
ba
|
0
sqft
|
built
1964
2612 SW 71st St, Oklahoma City, OK 73159
$-131
Cash flow
-3.0%
Cash-on-Cash Return
5.0%
Cap rate
0.7%
Rent to Value Ratio
Active
$359,000
3
bds
|
2
ba
|
0
sqft
|
built
2001
7416 NW 131st St, Oklahoma City, OK 73142
$-468
Cash flow
-6.8%
Cash-on-Cash Return
4.1%
Cap rate
0.6%
Rent to Value Ratio
Active
$169,900
3
bds
|
2
ba
|
0
sqft
|
built
1963
1310 SW 77th Ter, Oklahoma City, OK 73159
$-113
Cash flow
-3.5%
Cash-on-Cash Return
4.9%
Cap rate
0.7%
Rent to Value Ratio
Active
$180,000
2
bds
|
2
ba
|
0
sqft
|
built
1922
1011 NW 31st St, Oklahoma City, OK 73118
$-89
Cash flow
-2.6%
Cash-on-Cash Return
5.1%
Cap rate
0.7%
Rent to Value Ratio
Active
$159,000
3
bds
|
2
ba
|
0
sqft
|
built
1947
2644 SW 40th St, Oklahoma City, OK 73119
$-176
Cash flow
-5.8%
Cash-on-Cash Return
4.3%
Cap rate
0.6%
Rent to Value Ratio
Active
$404,000
3
bds
|
3
ba
|
0
sqft
|
built
1929
2715 NW 17th St, Oklahoma City, OK 73107
$-157
Cash flow
-2.0%
Cash-on-Cash Return
5.2%
Cap rate
0.7%
Rent to Value Ratio
Active
$169,903
3
bds
|
2
ba
|
0
sqft
|
built
1922
1604 NE Euclid St, Oklahoma City, OK 73117
$128
Cash flow
3.9%
Cash-on-Cash Return
6.6%
Cap rate
0.9%
Rent to Value Ratio
Active
$155,000
3
bds
|
1
ba
|
0
sqft
|
built
1970
4936 S Briarwood Dr, Oklahoma City, OK 73135
$24
Cash flow
0.8%
Cash-on-Cash Return
5.9%
Cap rate
0.8%
Rent to Value Ratio
Active
$120,000
2
bds
|
1
ba
|
0
sqft
|
built
1976
4912 Cinderella Dr, Oklahoma City, OK 73129
$250
Cash flow
10.9%
Cash-on-Cash Return
8.2%
Cap rate
1.1%
Rent to Value Ratio
Active
$580,000
2
bds
|
1
ba
|
0
sqft
|
built
1930
2929 NW 12th St, Oklahoma City, OK 73107
$-1,244
Cash flow
-11.2%
Cash-on-Cash Return
3.1%
Cap rate
0.4%
Rent to Value Ratio
Active
$359,000
3
bds
|
3
ba
|
0
sqft
|
built
1959
5709 N Florida Ave, Oklahoma City, OK 73118
$-500
Cash flow
-7.3%
Cash-on-Cash Return
4.0%
Cap rate
0.6%
Rent to Value Ratio
Active
$149,900
2
bds
|
1
ba
|
0
sqft
|
built
1954
2941 SW 48th St, Oklahoma City, OK 73119
$29
Cash flow
1.0%
Cash-on-Cash Return
5.9%
Cap rate
0.8%
Rent to Value Ratio
Active
$579,000
10
bds
|
10
ba
|
0
sqft
|
built
1965
3333 S Walker Ave, Oklahoma City, OK 73109
$-1,938
Cash flow
-17.5%
Cash-on-Cash Return
1.7%
Cap rate
0.3%
Rent to Value Ratio
Active
$254,900
3
bds
|
2
ba
|
0
sqft
|
built
1948
2935 NW Grand Blvd, Oklahoma City, OK 73116
$-237
Cash flow
-4.9%
Cash-on-Cash Return
4.6%
Cap rate
0.6%
Rent to Value Ratio
Active
$399,000
3
bds
|
2
ba
|
0
sqft
|
built
2022
16304 Steppe Dr, Oklahoma City, OK 73170
$-770
Cash flow
-10.1%
Cash-on-Cash Return
3.4%
Cap rate
0.7%
Rent to Value Ratio
Active
$995,000
3
bds
|
4
ba
|
0
sqft
|
built
2023
619 NE 5th St, Oklahoma City, OK 73104
$-1,190
Cash flow
-6.2%
Cash-on-Cash Return
4.2%
Cap rate
0.5%
Rent to Value Ratio
Active
$159,900
3
bds
|
2
ba
|
0
sqft
|
built
1940
3604 NW 27th St, Oklahoma City, OK 73107
$19
Cash flow
0.6%
Cash-on-Cash Return
5.8%
Cap rate
0.8%
Rent to Value Ratio
Active
$238,000
2
bds
|
1
ba
|
0
sqft
|
built
1940
1721 NW 35th St, Oklahoma City, OK 73118
$-344
Cash flow
-7.5%
Cash-on-Cash Return
3.9%
Cap rate
0.5%
Rent to Value Ratio
Active
$415,000
3
bds
|
3
ba
|
0
sqft
|
built
1968
1916 N Ann Arbor Pl, Oklahoma City, OK 73127
$-964
Cash flow
-12.1%
Cash-on-Cash Return
2.9%
Cap rate
0.4%
Rent to Value Ratio
Active
$215,000
2
bds
|
1
ba
|
0
sqft
|
built
1949
2832 Warwick Dr, Oklahoma City, OK 73116
$-161
Cash flow
-3.9%
Cash-on-Cash Return
4.8%
Cap rate
0.7%
Rent to Value Ratio
Active
$124,900
3
bds
|
1
ba
|
0
sqft
|
built
1946
501 SE 15th St, Oklahoma City, OK 73129
$124
Cash flow
5.2%
Cash-on-Cash Return
6.9%
Cap rate
0.9%
Rent to Value Ratio

Active
$995,000
2
bds
|
2
ba
|
0
sqft
|
built
2021
1200 Classen Dr, Oklahoma City, OK 73103
$-4,145
Cash flow
-21.7%
Cash-on-Cash Return
0.7%
Cap rate
0.4%
Rent to Value Ratio