Oklahoma City, OK Investment Properties for Sale
Browse homes for sale and investment properties in Oklahoma City, OK. Refine your search by price, property type, or more.
Best cash flowing properties in Oklahoma City, OK
Pending
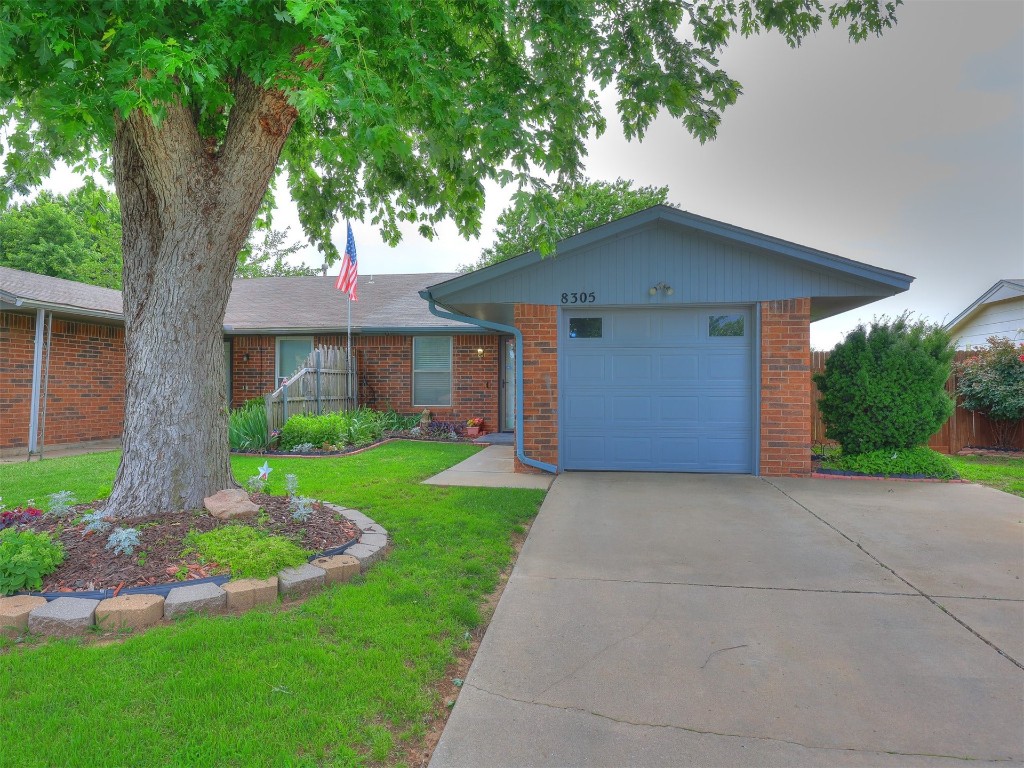
$131,000
2
bds
|
2
ba
|
0
sqft
|
built
1982
8305 S Brookline Pl, Oklahoma City, OK 73159
$194
Cash flow
7.7%
Cash-on-Cash Return
7.5%
Cap rate
1.0%
Rent to Value Ratio
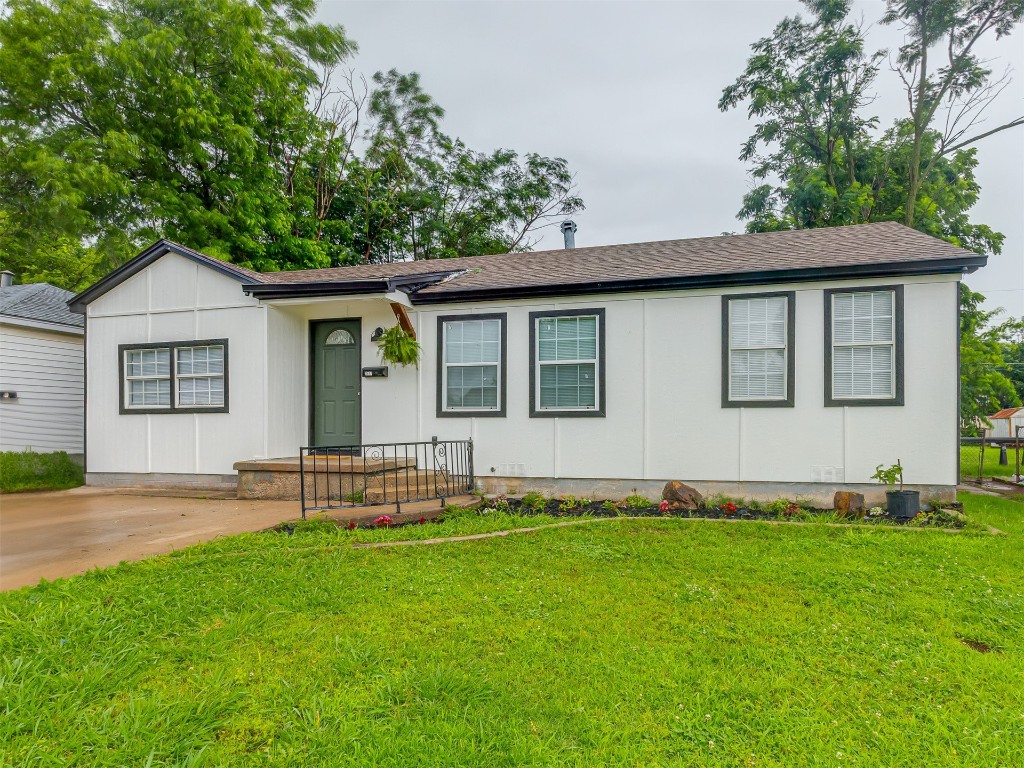
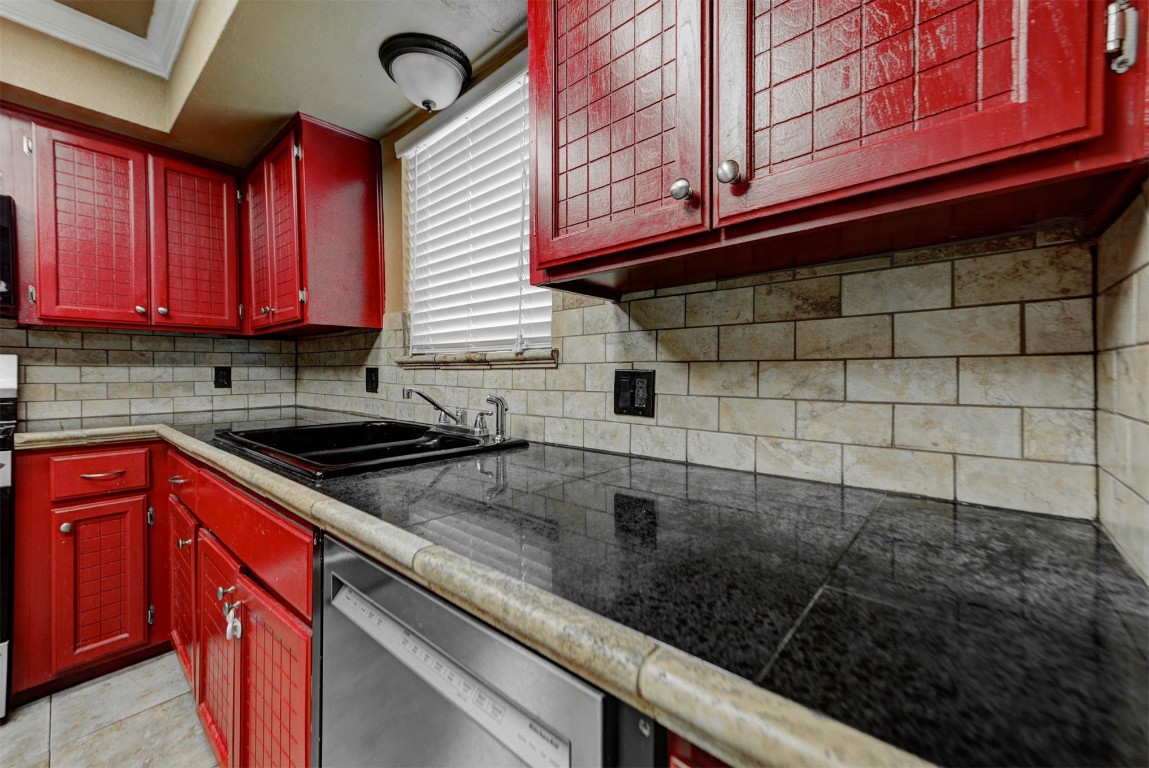
Pending
$149,900
3
bds
|
1
ba
|
0
sqft
|
built
1954
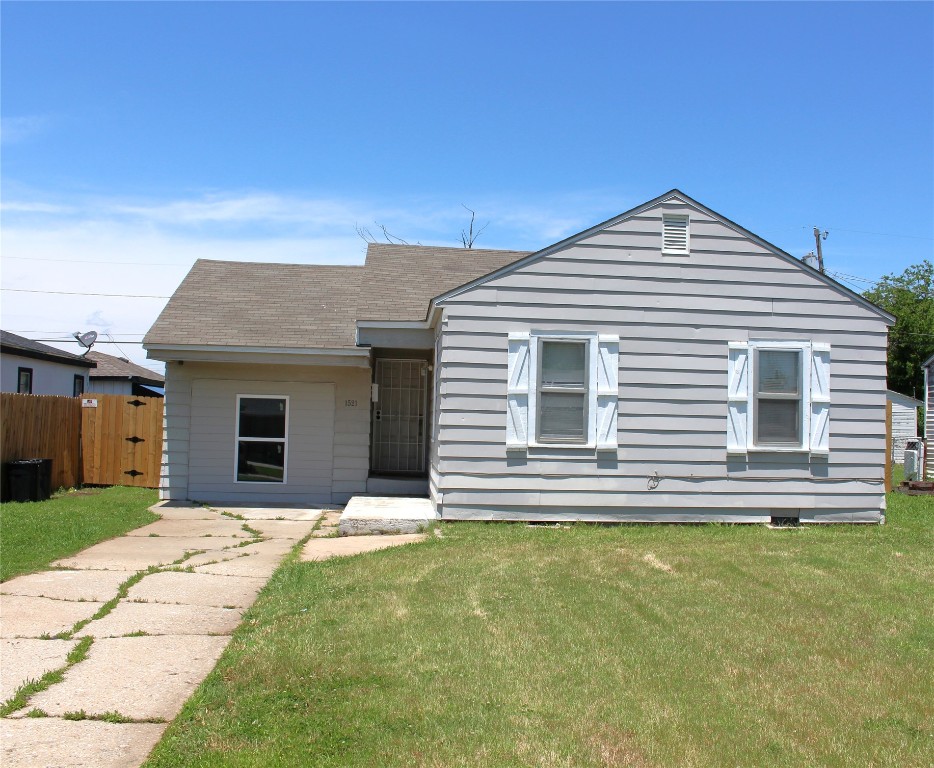
2417 SE 47th St, Oklahoma City, OK 73129
$188
Cash flow
6.5%
Cash-on-Cash Return
7.2%
Cap rate
0.9%
Rent to Value Ratio
1,305 out of 1,668 properties for sale in Oklahoma City, OK
Limited Results Shown
Create a free account, or log in to reveal all property listings and enjoy the complete experience.
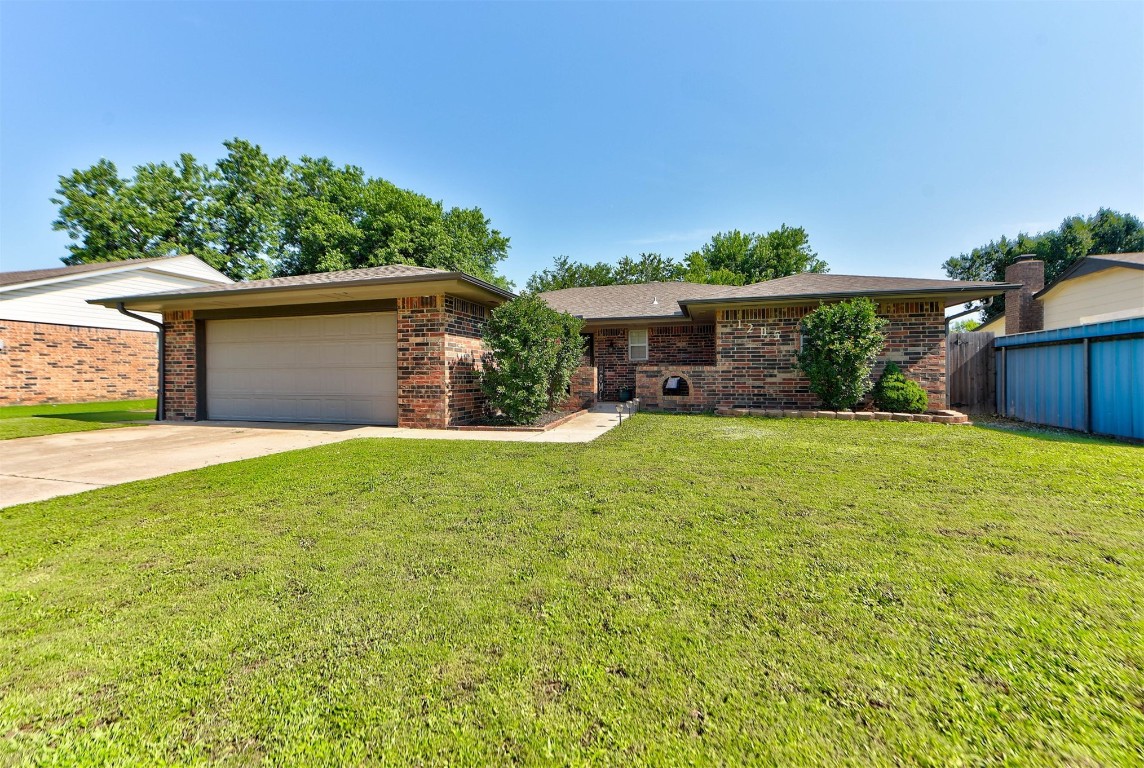
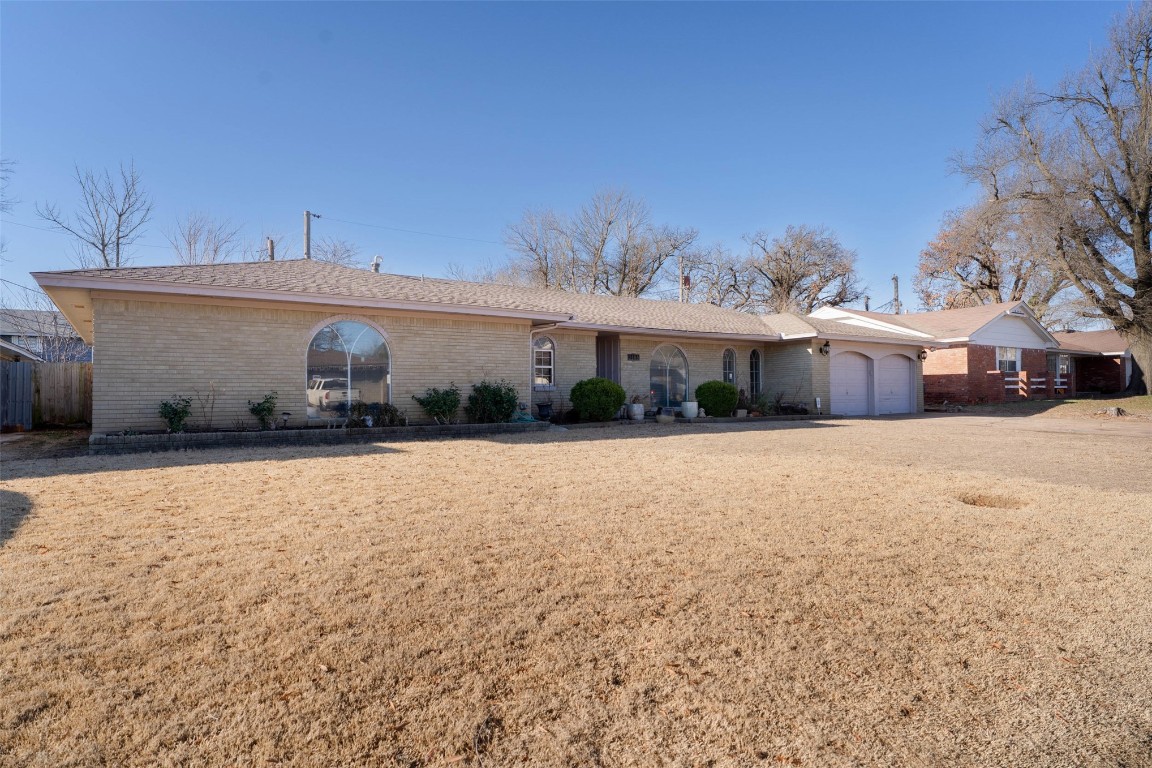
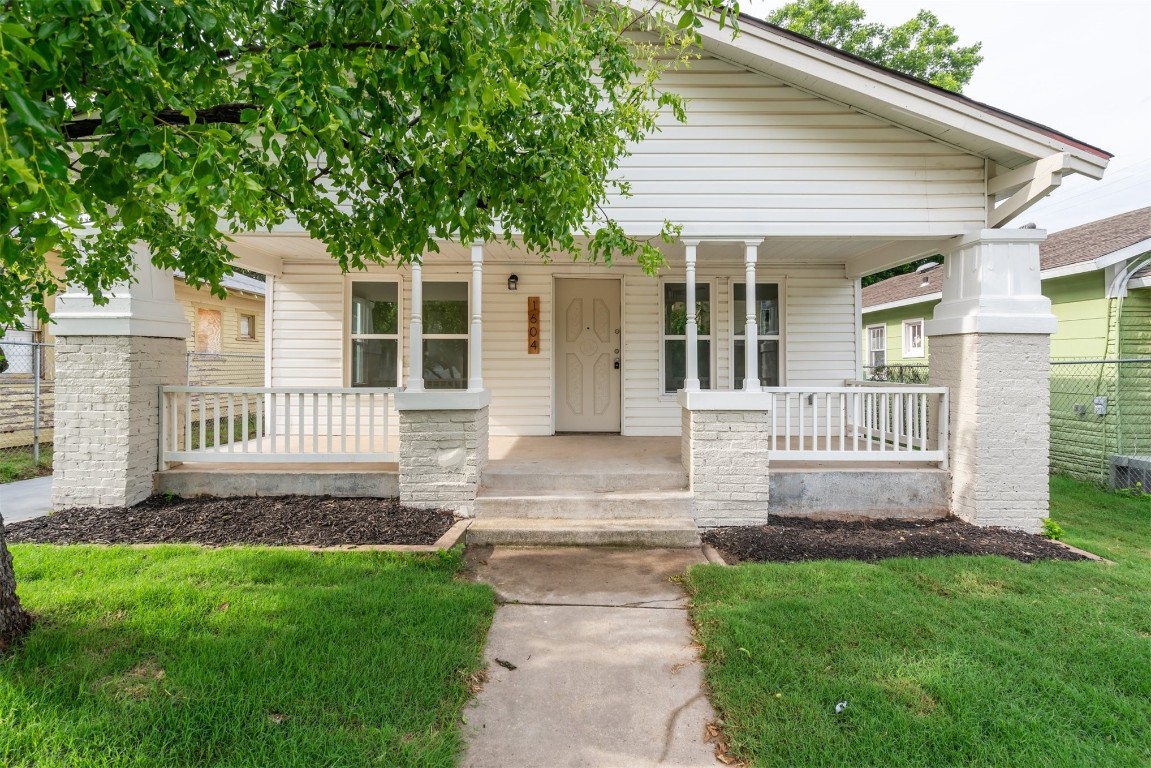
Active
$219,000
3
bds
|
2
ba
|
0
sqft
|
built
1958
3914 NW 58th Ter, Oklahoma City, OK 73112
$-18
Cash flow
-0.4%
Cash-on-Cash Return
5.6%
Cap rate
0.7%
Rent to Value Ratio
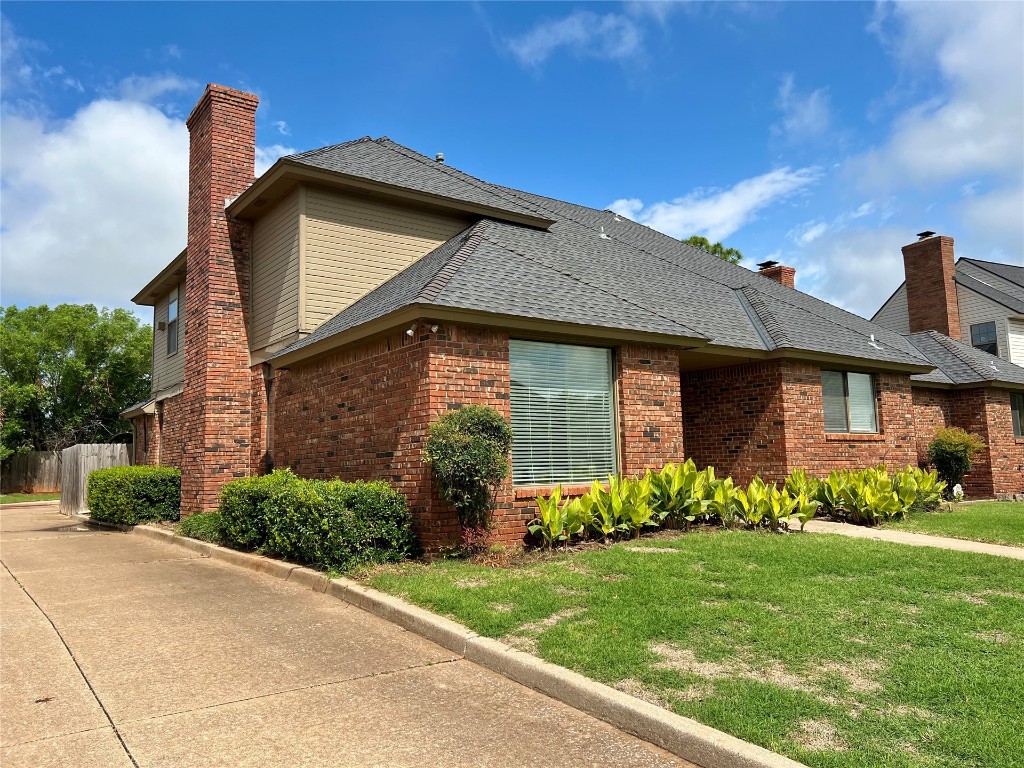
Active
$269,000
3
bds
|
2
ba
|
0
sqft
|
built
2017
8721 SW 39th St, Oklahoma City, OK 73179
$-292
Cash flow
-5.7%
Cash-on-Cash Return
4.4%
Cap rate
0.7%
Rent to Value Ratio
Pending
$244,900
3
bds
|
2
ba
|
0
sqft
|
built
1976
1205 SW 94th St, Oklahoma City, OK 73139
$-151
Cash flow
-3.2%
Cash-on-Cash Return
4.9%
Cap rate
0.7%
Rent to Value Ratio
Pending
$149,900
3
bds
|
1
ba
|
0
sqft
|
built
1954
2417 SE 47th St, Oklahoma City, OK 73129
$188
Cash flow
6.5%
Cash-on-Cash Return
7.2%
Cap rate
0.9%
Rent to Value Ratio
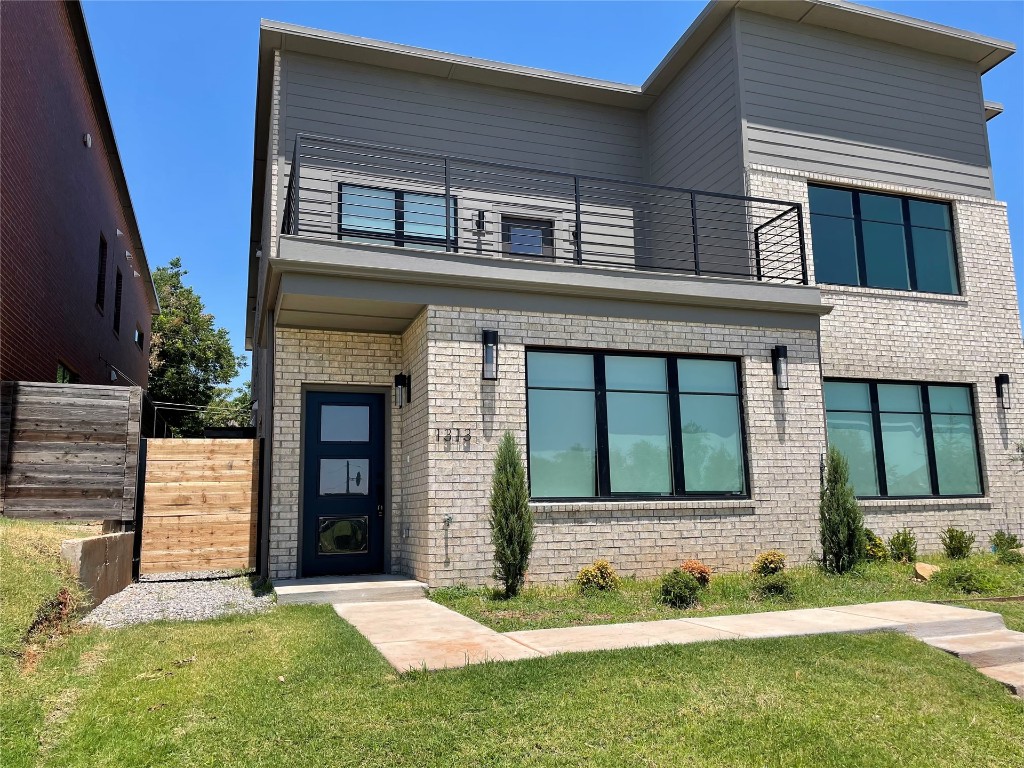
Active
$330,000
3
bds
|
3
ba
|
0
sqft
|
built
2022
1313 NE 6th St, Oklahoma City, OK 73117
$-874
Cash flow
-13.8%
Cash-on-Cash Return
2.5%
Cap rate
0.4%
Rent to Value Ratio
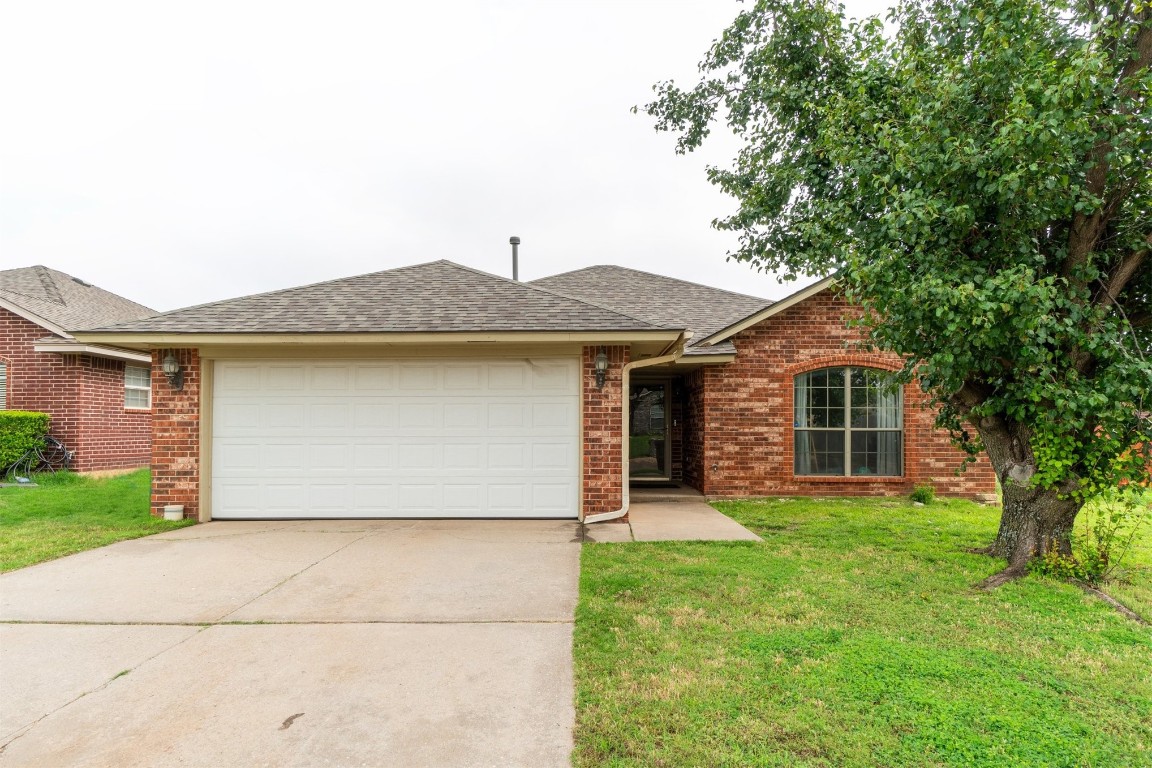
Active
$250,000
3
bds
|
2
ba
|
0
sqft
|
built
2001
4921 SE 87th Ter, Oklahoma City, OK 73135
$-297
Cash flow
-6.2%
Cash-on-Cash Return
4.3%
Cap rate
0.6%
Rent to Value Ratio
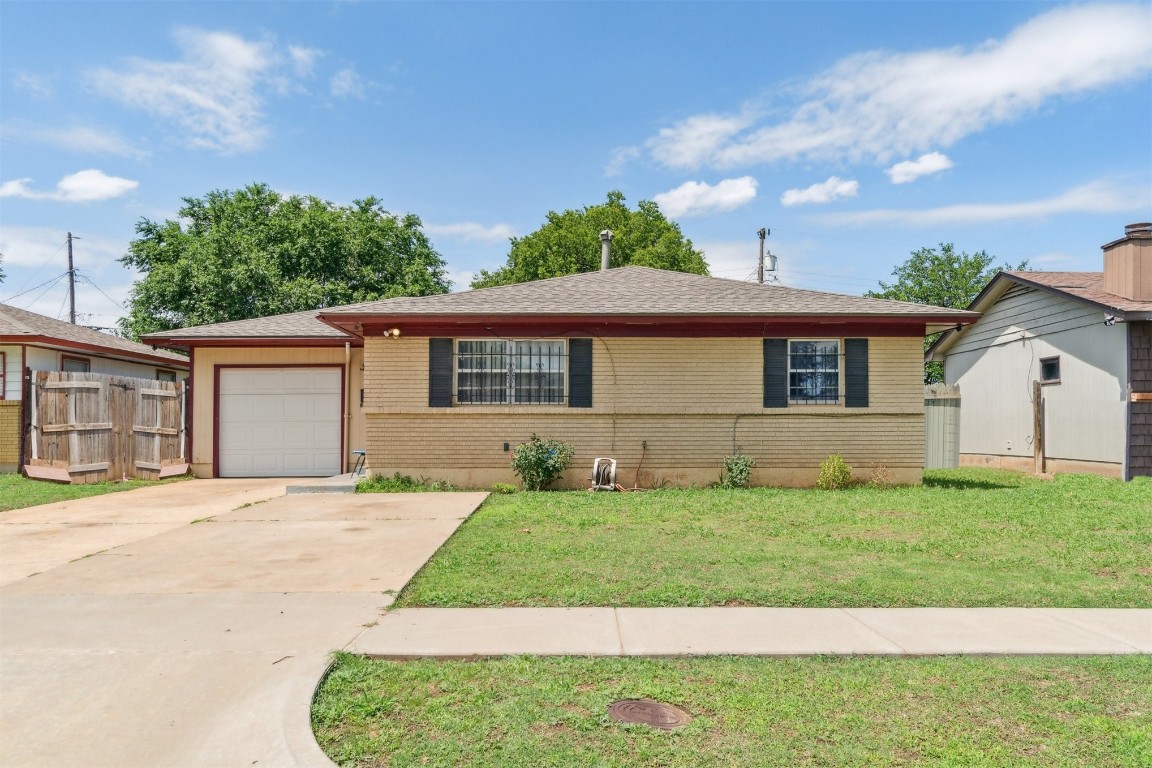
Active
$160,333
3
bds
|
1
ba
|
0
sqft
|
built
1961
3333 SW 50th St, Oklahoma City, OK 73119
$-13
Cash flow
-0.4%
Cash-on-Cash Return
5.6%
Cap rate
0.7%
Rent to Value Ratio
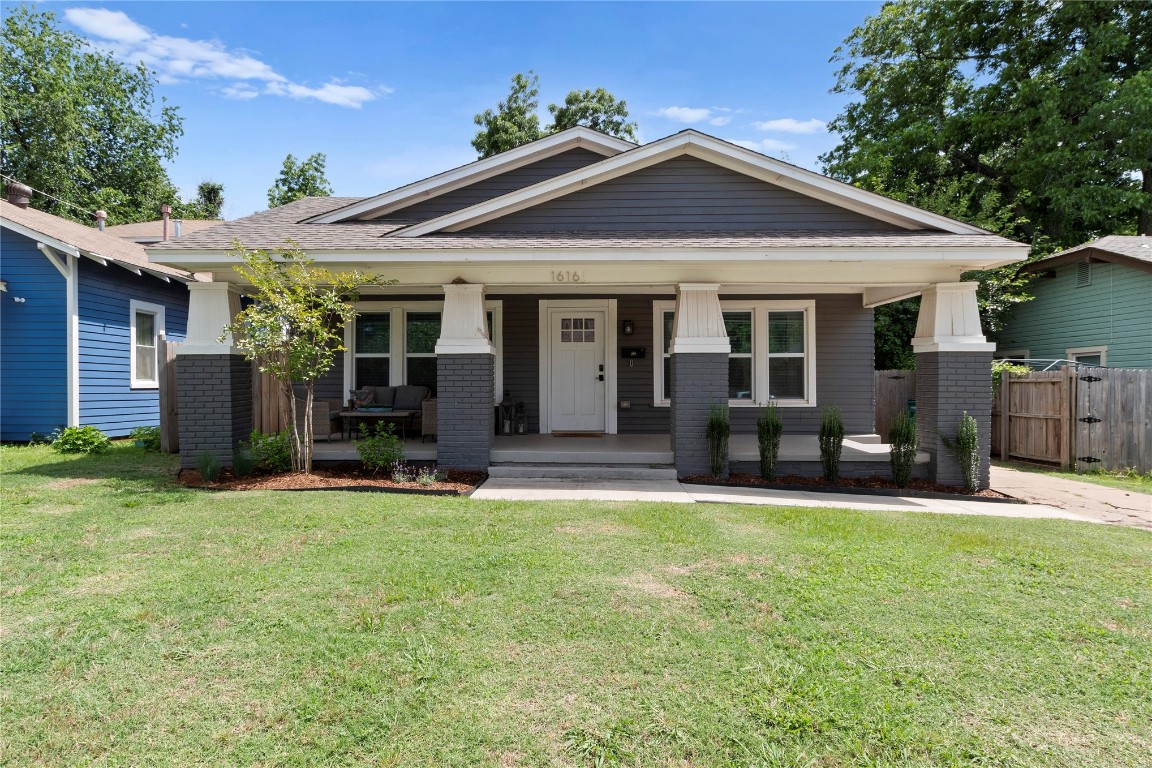
Active
$499,000
4
bds
|
3
ba
|
0
sqft
|
built
1921
1616 NW 15th St, Oklahoma City, OK 73106
$-613
Cash flow
-6.4%
Cash-on-Cash Return
4.2%
Cap rate
0.6%
Rent to Value Ratio
Active
$215,000
3
bds
|
2
ba
|
0
sqft
|
built
1977
12217 Cork Rd, Oklahoma City, OK 73162
$-309
Cash flow
-7.5%
Cash-on-Cash Return
4.0%
Cap rate
0.7%
Rent to Value Ratio
Active
$264,900
3
bds
|
2
ba
|
0
sqft
|
built
1941
1212 NW 48th St, Oklahoma City, OK 73118
$-306
Cash flow
-6.0%
Cash-on-Cash Return
4.3%
Cap rate
0.5%
Rent to Value Ratio
Active
$220,000
3
bds
|
2
ba
|
0
sqft
|
built
1951
3208 N Roff Ave, Oklahoma City, OK 73112
$-301
Cash flow
-7.1%
Cash-on-Cash Return
4.0%
Cap rate
0.5%
Rent to Value Ratio
Pending
$131,000
2
bds
|
2
ba
|
0
sqft
|
built
1982
8305 S Brookline Pl, Oklahoma City, OK 73159
$194
Cash flow
7.7%
Cash-on-Cash Return
7.5%
Cap rate
1.0%
Rent to Value Ratio
Active
$90,000
2
bds
|
2
ba
|
0
sqft
|
built
1979
846 Two Forty Pl, Oklahoma City, OK 73139
$27
Cash flow
1.6%
Cash-on-Cash Return
6.0%
Cap rate
1.6%
Rent to Value Ratio
Active
$320,000
4
bds
|
2
ba
|
0
sqft
|
built
1969
5108 NW 19th Ter, Oklahoma City, OK 73127
$-501
Cash flow
-8.2%
Cash-on-Cash Return
3.8%
Cap rate
0.6%
Rent to Value Ratio
Active
$289,000
3
bds
|
2
ba
|
0
sqft
|
built
1982
11921 Shady Trail Ln, Oklahoma City, OK 73120
$-461
Cash flow
-8.3%
Cash-on-Cash Return
3.8%
Cap rate
0.6%
Rent to Value Ratio
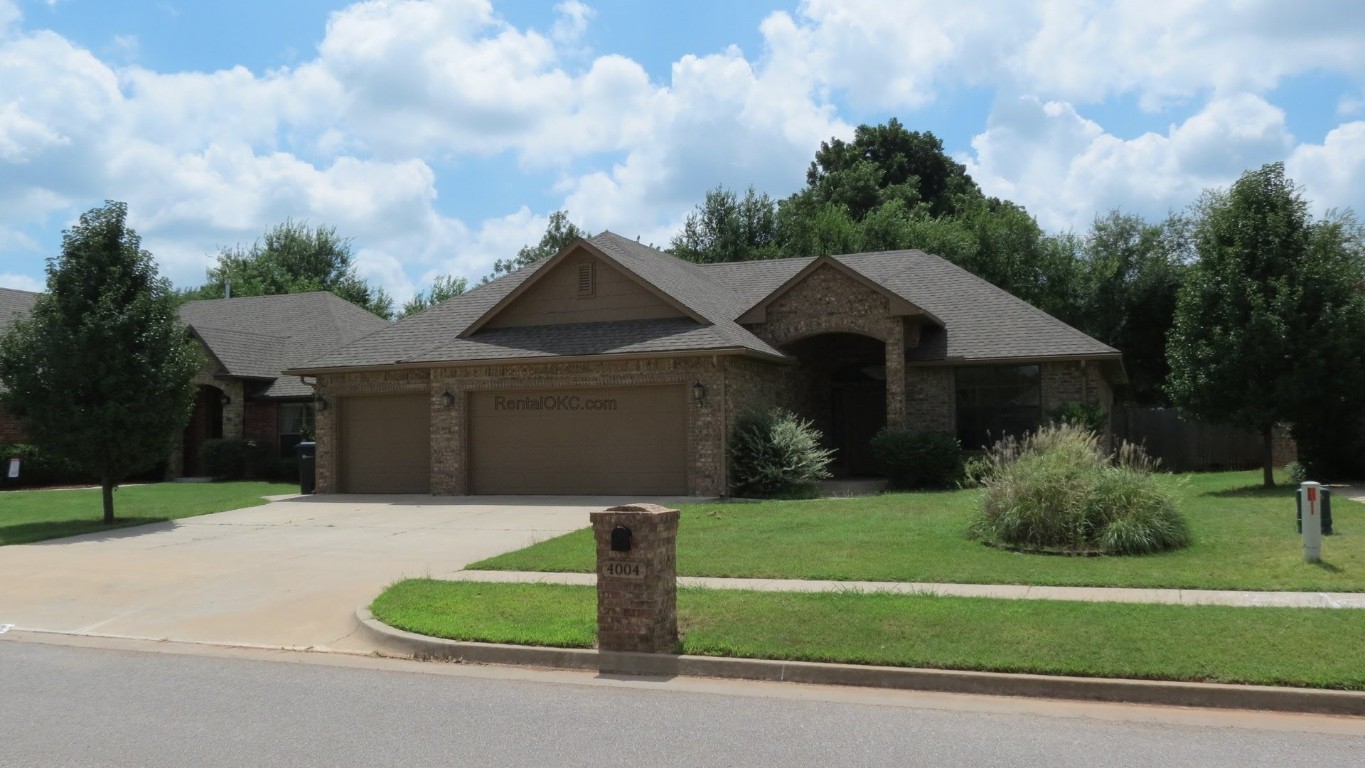
Pending
$240,000
3
bds
|
2
ba
|
0
sqft
|
built
2008
4004 SE 89th Ter, Oklahoma City, OK 73135
$-186
Cash flow
-4.0%
Cash-on-Cash Return
4.8%
Cap rate
0.7%
Rent to Value Ratio
Active
$450,000
4
bds
|
3
ba
|
0
sqft
|
built
1978
4017 Cherry Hill Ln, Oklahoma City, OK 73120
$-689
Cash flow
-8.0%
Cash-on-Cash Return
3.8%
Cap rate
0.6%
Rent to Value Ratio
Active
$539,000
3
bds
|
3
ba
|
0
sqft
|
built
2021
8416 NW 130th St, Oklahoma City, OK 73142
$-868
Cash flow
-8.4%
Cash-on-Cash Return
3.7%
Cap rate
0.5%
Rent to Value Ratio

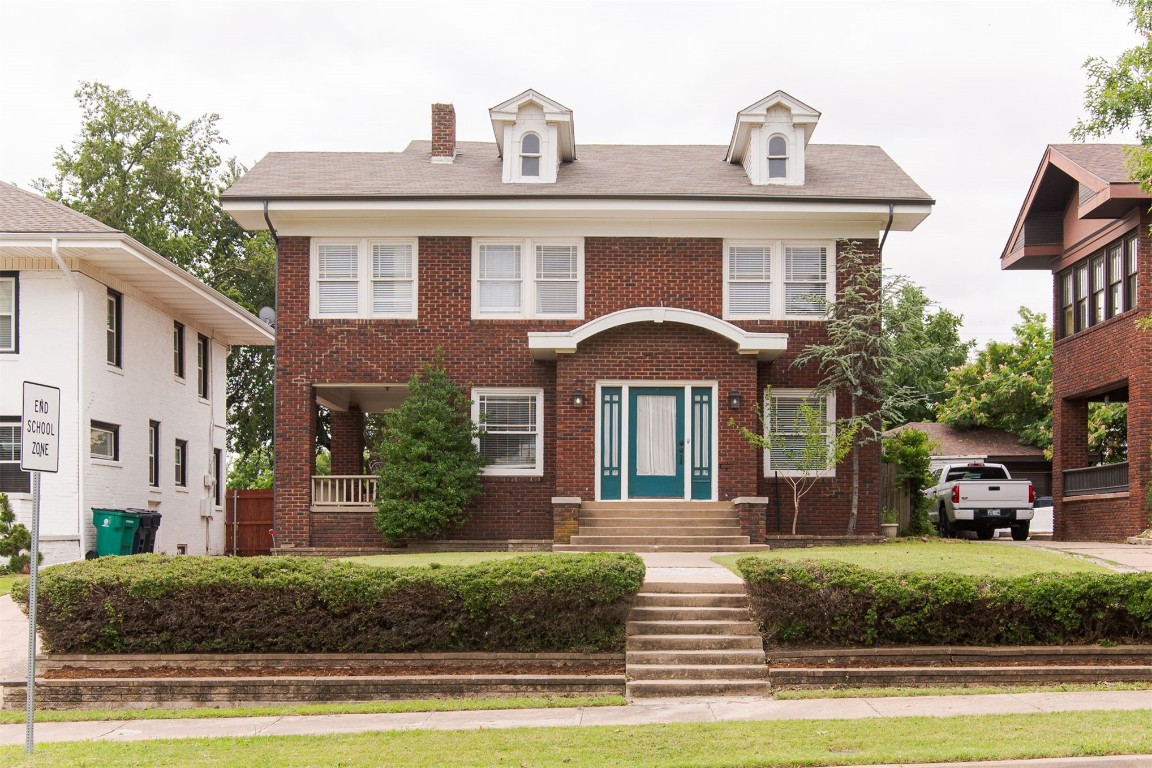
Pending
$339,750
3
bds
|
2
ba
|
0
sqft
|
built
1923
611 NW 22nd St, Oklahoma City, OK 73103
$-851
Cash flow
-13.1%
Cash-on-Cash Return
2.7%
Cap rate
0.4%
Rent to Value Ratio
Pending
$234,900
3
bds
|
2
ba
|
0
sqft
|
built
1976
11812 Bevenshire Rd, Oklahoma City, OK 73162
$-136
Cash flow
-3.0%
Cash-on-Cash Return
5.0%
Cap rate
0.7%
Rent to Value Ratio
Active
$249,000
3
bds
|
2
ba
|
0
sqft
|
built
1950
2901 Pine Ave, Oklahoma City, OK 73128
$-259
Cash flow
-5.4%
Cash-on-Cash Return
4.4%
Cap rate
0.6%
Rent to Value Ratio
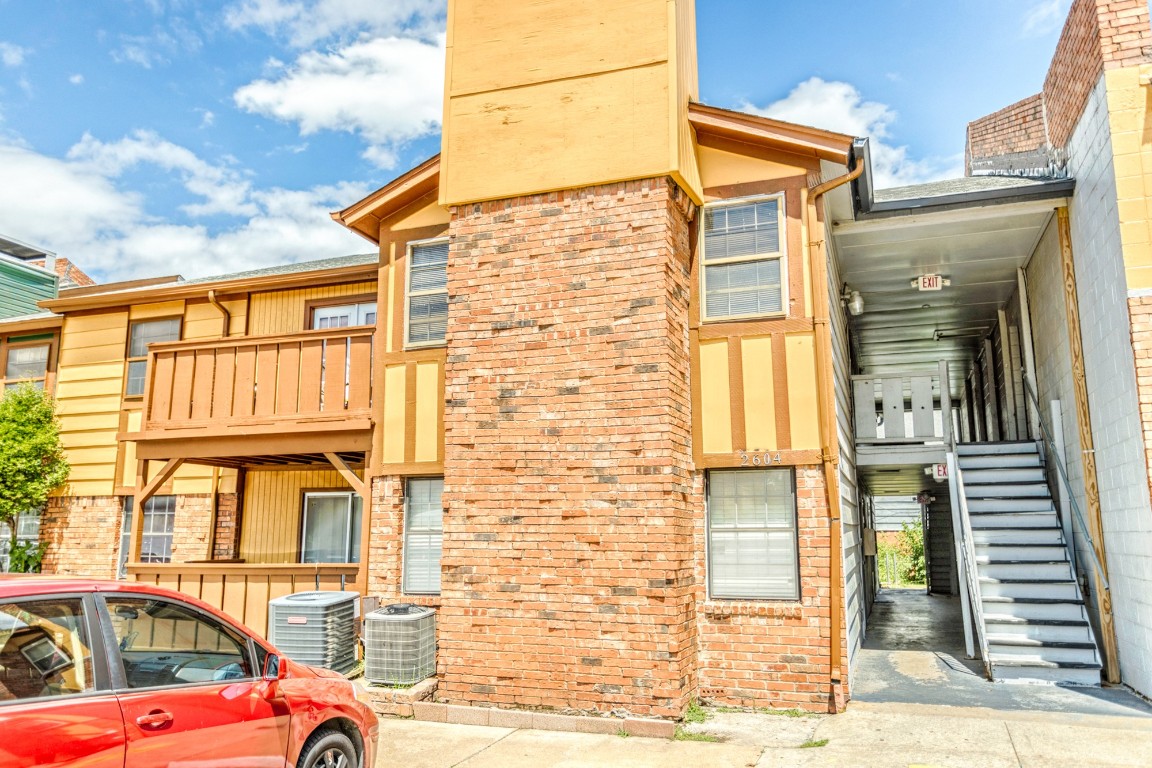
Active
$85,000
3
bds
|
2
ba
|
0
sqft
|
built
1975
2604 N Ann Arbor Ave, Oklahoma City, OK 73127
$-93
Cash flow
-5.7%
Cash-on-Cash Return
4.4%
Cap rate
1.3%
Rent to Value Ratio
Active
$359,900
4
bds
|
3
ba
|
0
sqft
|
built
1976
2109 Tuttington, Oklahoma City, OK 73170
$-267
Cash flow
-3.9%
Cash-on-Cash Return
4.8%
Cap rate
0.7%
Rent to Value Ratio
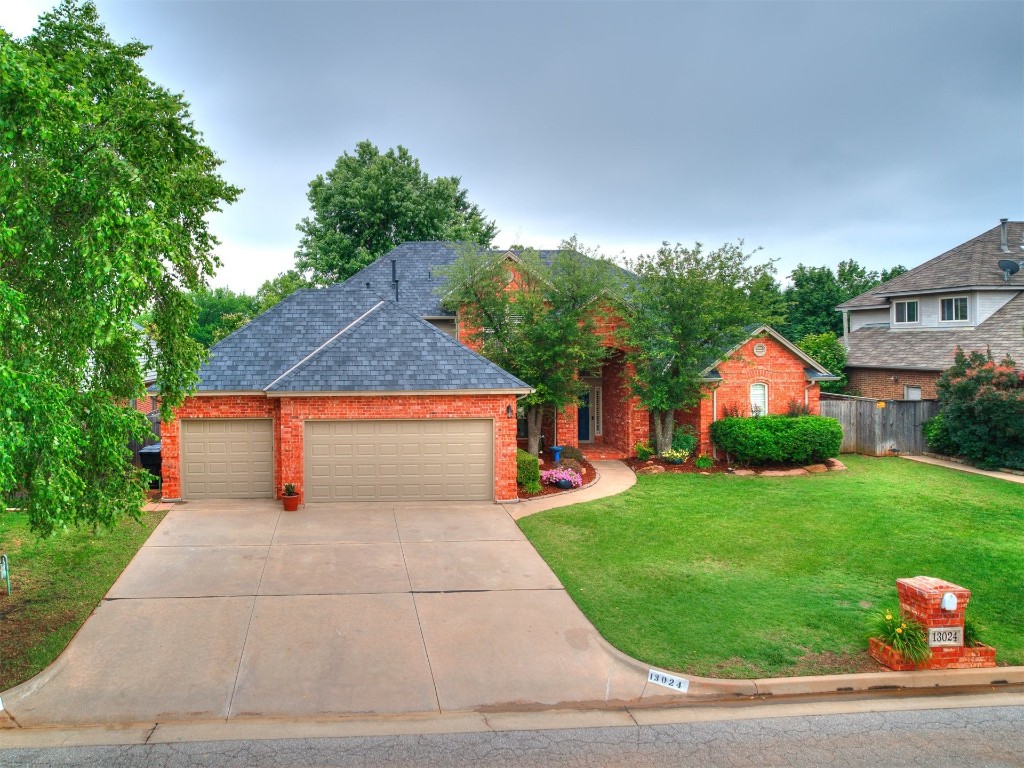
Active
$524,900
5
bds
|
4
ba
|
0
sqft
|
built
1998
13024 Green Cedar Ter, Oklahoma City, OK 73131
$-1,014
Cash flow
-10.1%
Cash-on-Cash Return
3.4%
Cap rate
0.5%
Rent to Value Ratio
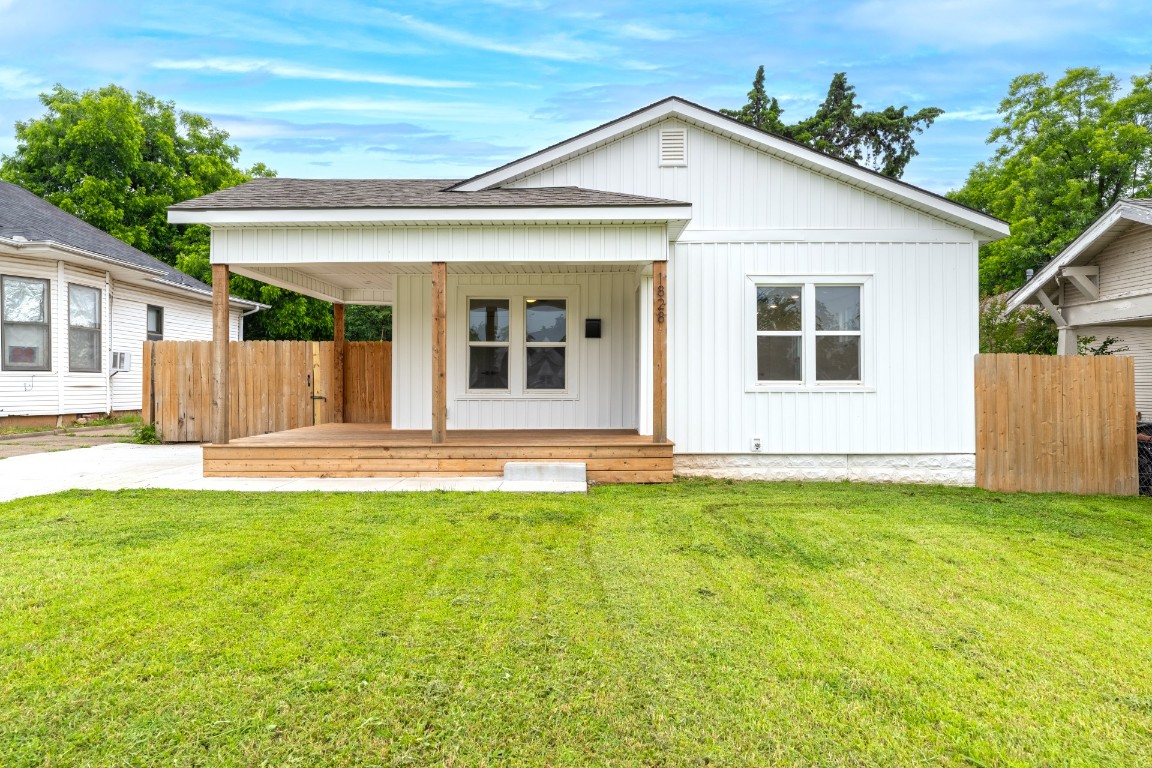
Active
$240,000
2
bds
|
1
ba
|
0
sqft
|
built
1920
1828 NW 38th St, Oklahoma City, OK 73118
$-362
Cash flow
-7.9%
Cash-on-Cash Return
3.9%
Cap rate
0.6%
Rent to Value Ratio
Active
$189,900
3
bds
|
2
ba
|
0
sqft
|
built
1964
2617 SW 69th St, Oklahoma City, OK 73159
$-235
Cash flow
-6.5%
Cash-on-Cash Return
4.2%
Cap rate
0.6%
Rent to Value Ratio
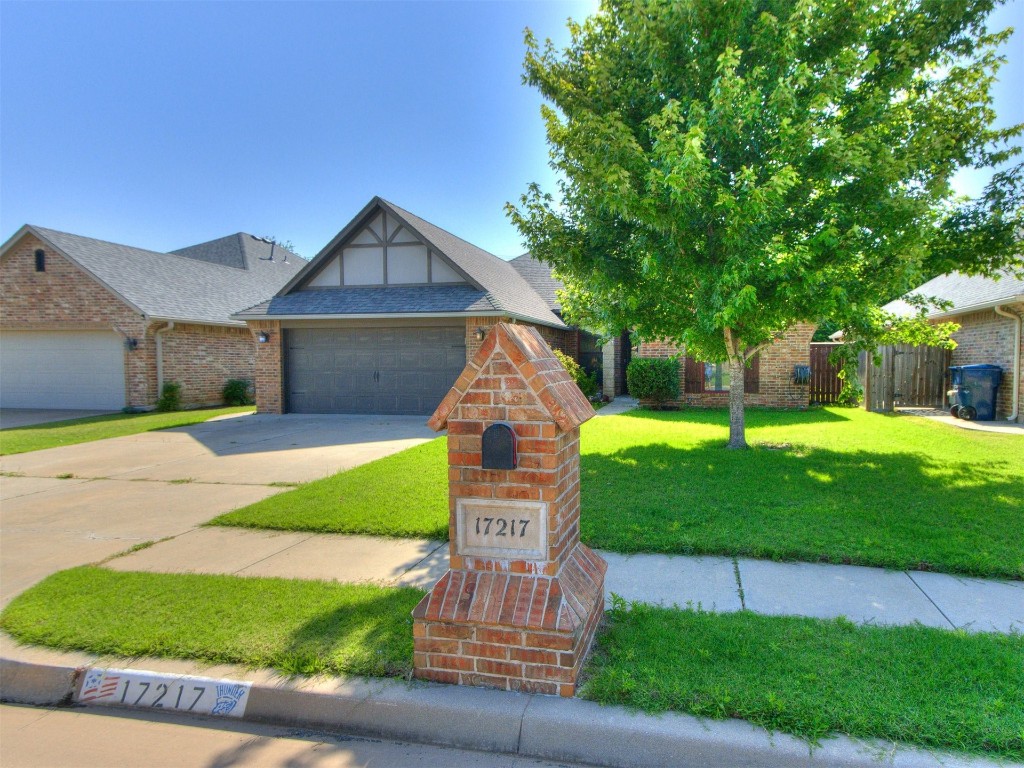
Active
$309,900
4
bds
|
2
ba
|
0
sqft
|
built
2011
17217 Prado Dr, Oklahoma City, OK 73170
$-375
Cash flow
-6.3%
Cash-on-Cash Return
4.2%
Cap rate
0.6%
Rent to Value Ratio
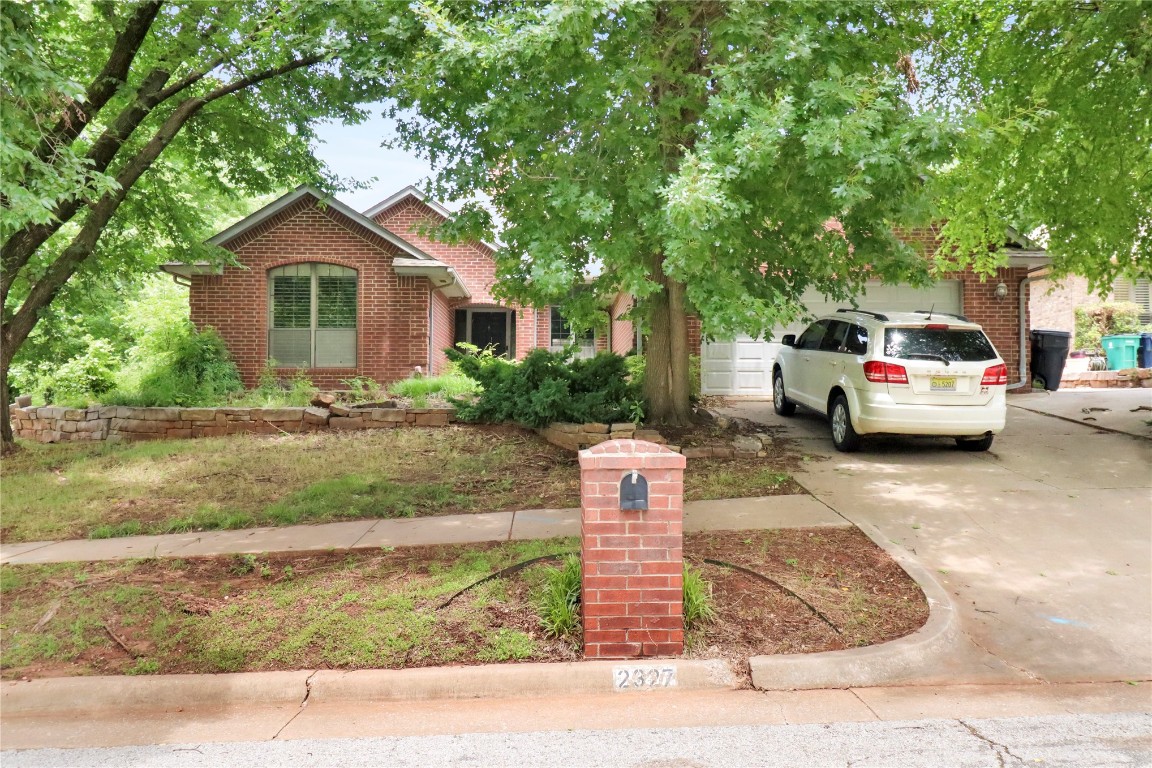
Active
$260,000
3
bds
|
2
ba
|
0
sqft
|
built
1991
2327 SW 122nd St, Oklahoma City, OK 73170
$-213
Cash flow
-4.3%
Cash-on-Cash Return
4.7%
Cap rate
0.7%
Rent to Value Ratio
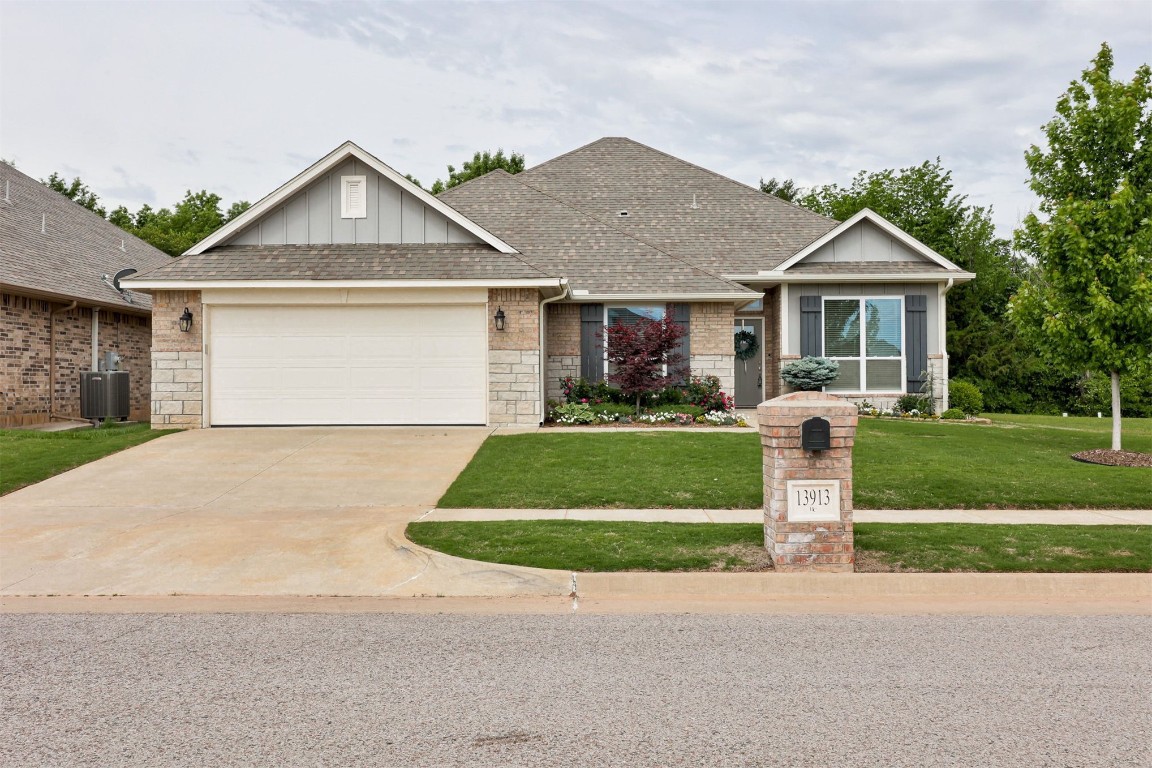
Active
$369,999
4
bds
|
3
ba
|
0
sqft
|
built
2019
13913 Pasaro Trl, Oklahoma City, OK 73170
$-587
Cash flow
-8.3%
Cash-on-Cash Return
3.8%
Cap rate
0.6%
Rent to Value Ratio
Active
$209,900
2
bds
|
1
ba
|
0
sqft
|
built
1924
1604 NW 13th St, Oklahoma City, OK 73106
$-259
Cash flow
-6.4%
Cash-on-Cash Return
4.2%
Cap rate
0.5%
Rent to Value Ratio
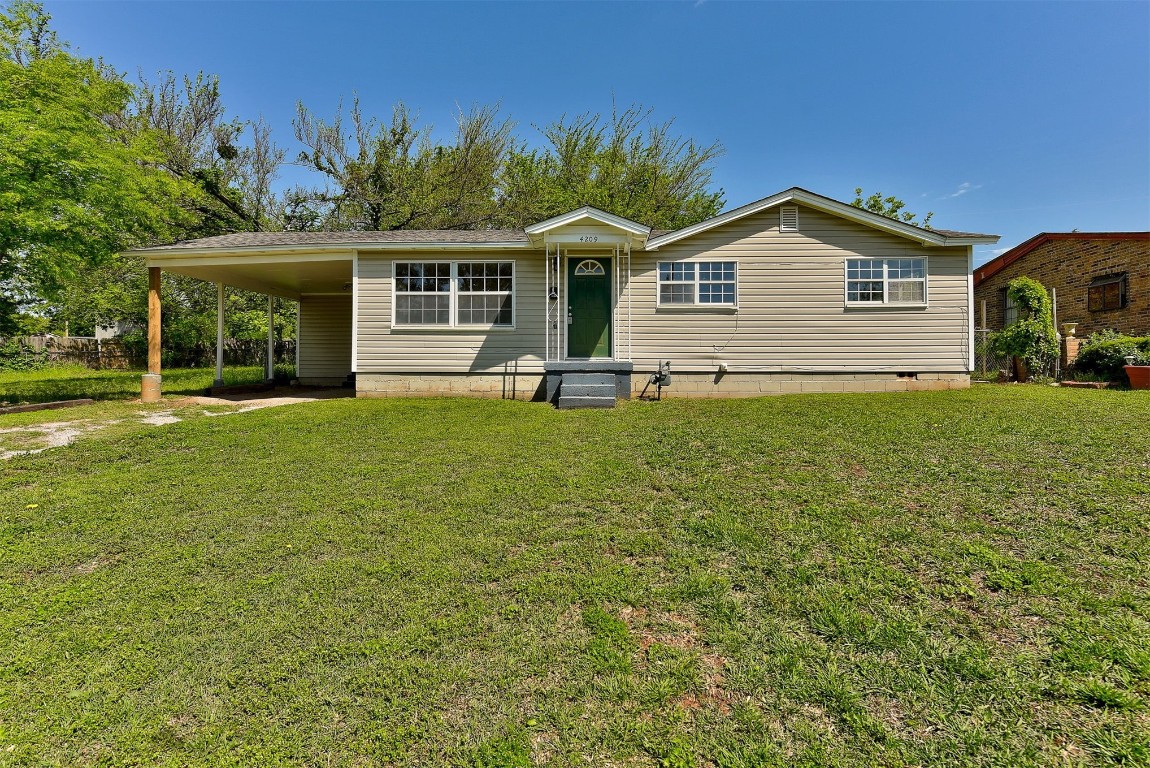
Active
$115,000
3
bds
|
1
ba
|
0
sqft
|
built
1962
4209 NE 16th St, Oklahoma City, OK 73117
$110
Cash flow
5.0%
Cash-on-Cash Return
6.8%
Cap rate
1.0%
Rent to Value Ratio
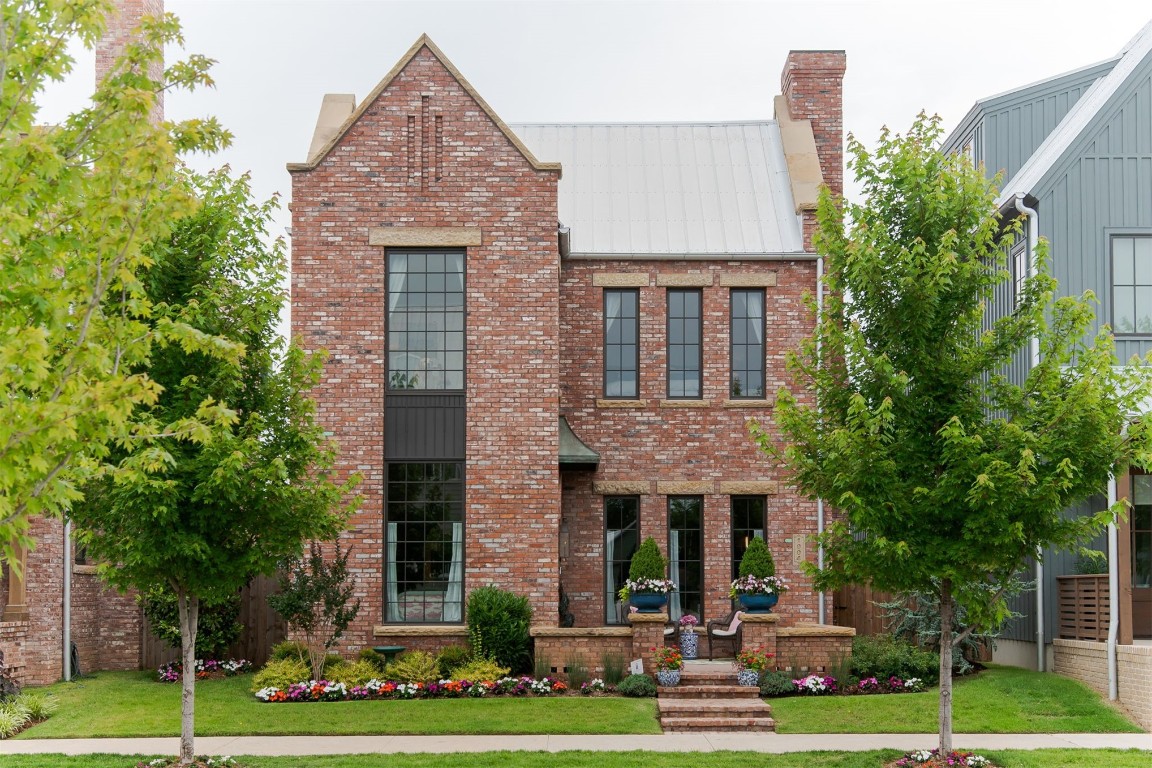
Active
$965,000
3
bds
|
3
ba
|
0
sqft
|
built
2023
1904 Oso Ave, Oklahoma City, OK 73108
$-1,895
Cash flow
-10.2%
Cash-on-Cash Return
3.3%
Cap rate
0.6%
Rent to Value Ratio
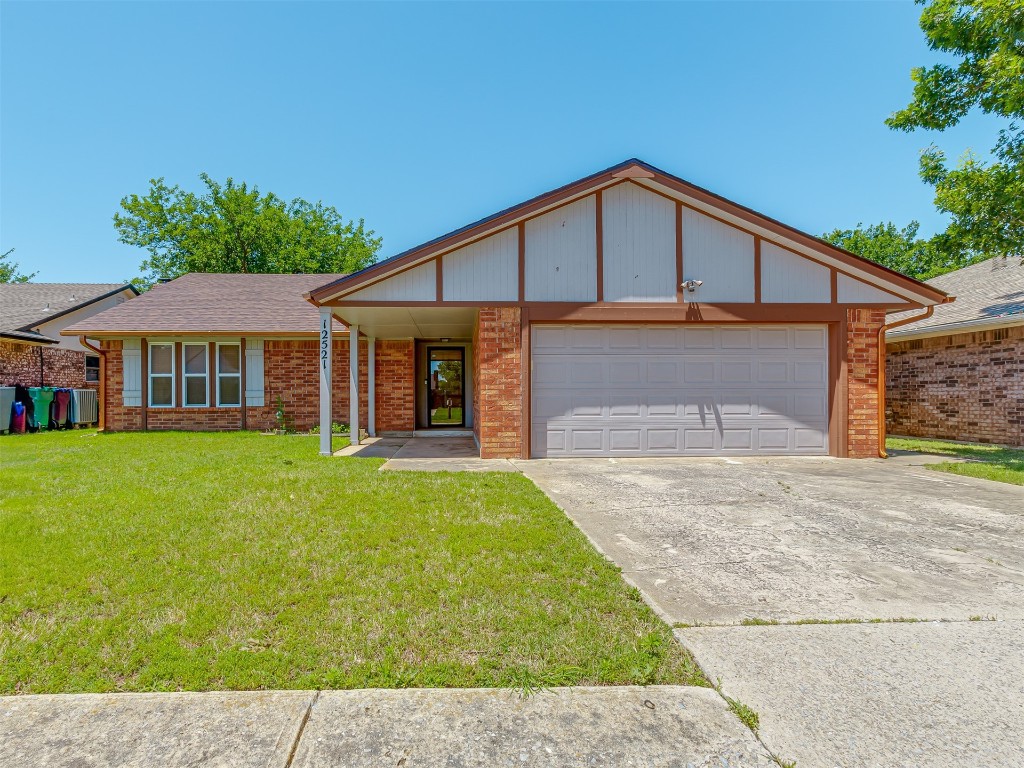
Pending
$199,900
3
bds
|
2
ba
|
0
sqft
|
built
1984
12521 Hickory Hollow Dr, Oklahoma City, OK 73142
$-6
Cash flow
-0.2%
Cash-on-Cash Return
5.6%
Cap rate
0.8%
Rent to Value Ratio
Active
$130,000
2
bds
|
1
ba
|
0
sqft
|
built
1949
1521 SW 45th St, Oklahoma City, OK 73119
$14
Cash flow
0.6%
Cash-on-Cash Return
5.8%
Cap rate
0.8%
Rent to Value Ratio
Pending
$254,000
3
bds
|
2
ba
|
0
sqft
|
built
2017
2617 Snapper Ln, Oklahoma City, OK 73130
$-210
Cash flow
-4.3%
Cash-on-Cash Return
4.7%
Cap rate
0.7%
Rent to Value Ratio
Active
$172,000
3
bds
|
1
ba
|
0
sqft
|
built
1949
724 SW 48th St, Oklahoma City, OK 73109
$-48
Cash flow
-1.5%
Cash-on-Cash Return
5.3%
Cap rate
0.7%
Rent to Value Ratio
Pending
$158,000
3
bds
|
1
ba
|
0
sqft
|
built
1962
520 SE 47th St, Oklahoma City, OK 73129
$70
Cash flow
2.3%
Cash-on-Cash Return
6.2%
Cap rate
0.8%
Rent to Value Ratio
Active
$650,000
3
bds
|
3
ba
|
0
sqft
|
built
1920
1218 NW 19th St, Oklahoma City, OK 73106
$-953
Cash flow
-7.6%
Cash-on-Cash Return
3.9%
Cap rate
0.6%
Rent to Value Ratio
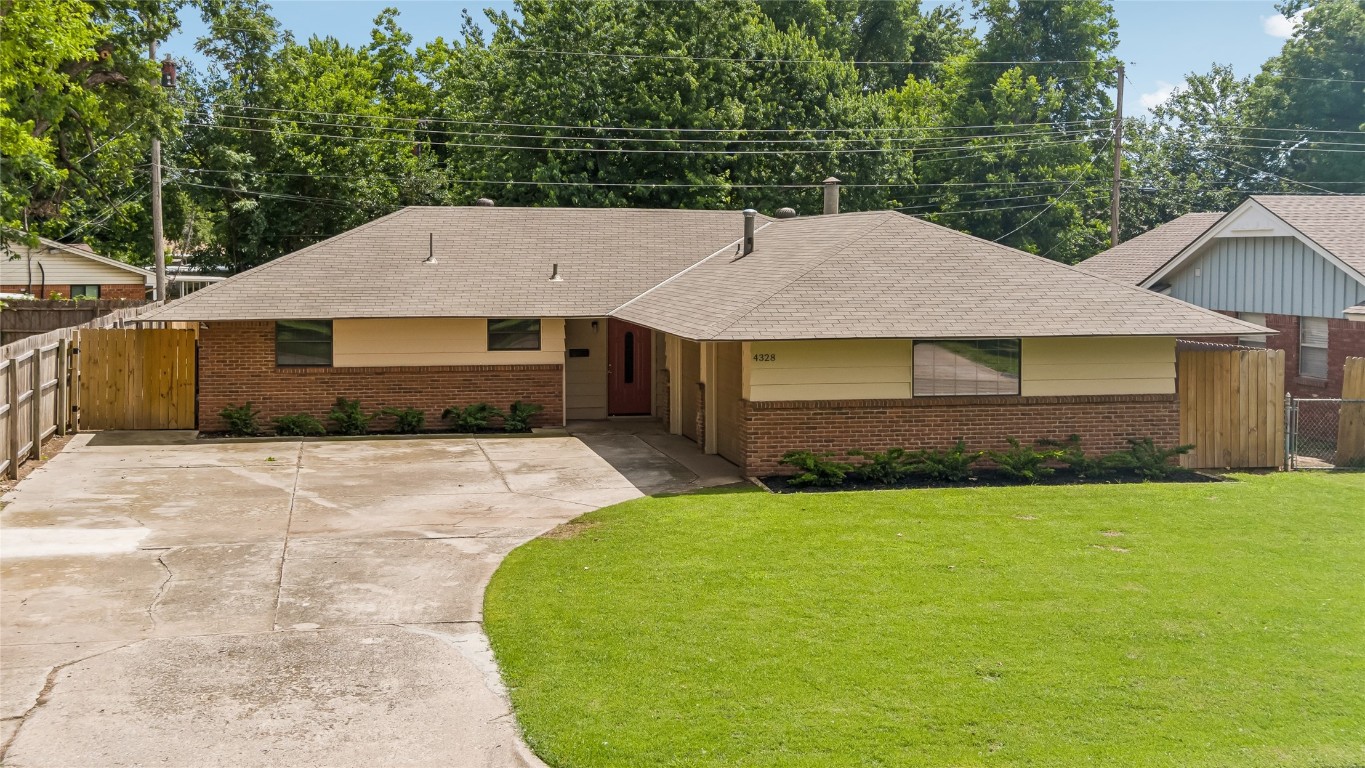
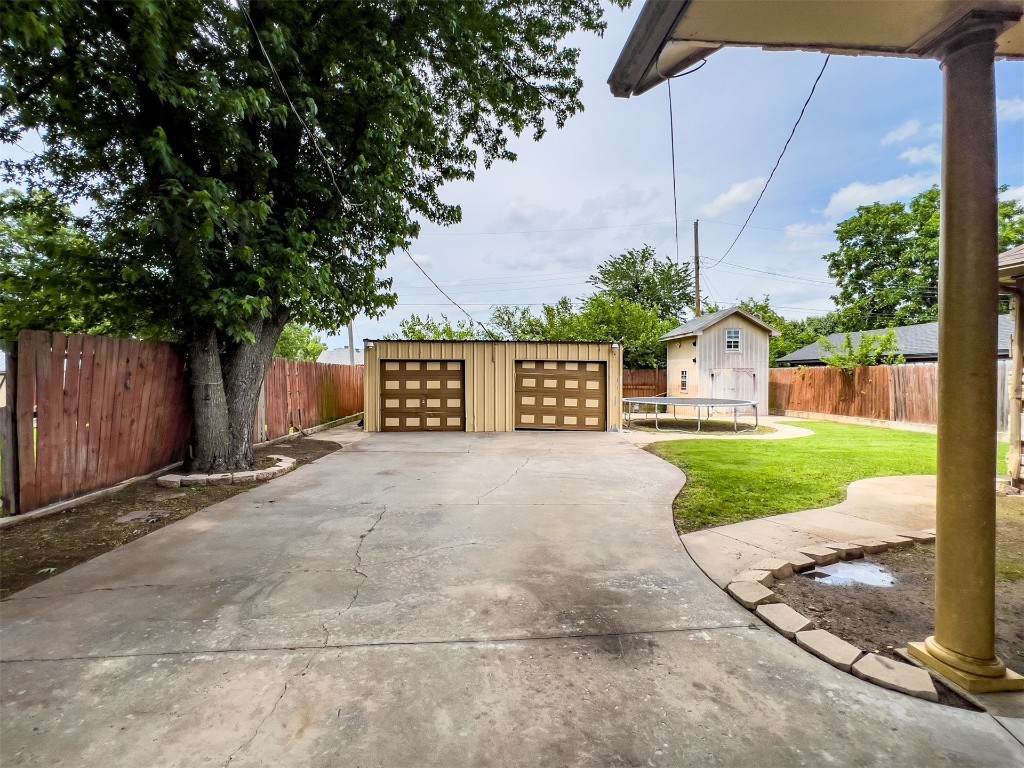
Active
$249,900
3
bds
|
2
ba
|
0
sqft
|
built
1958
4328 NW 12th St, Oklahoma City, OK 73107
$-303
Cash flow
-6.3%
Cash-on-Cash Return
4.2%
Cap rate
0.6%
Rent to Value Ratio
Active
$198,000
3
bds
|
3
ba
|
0
sqft
|
built
1941
1117 SW 37th St, Oklahoma City, OK 73109
$-45
Cash flow
-1.2%
Cash-on-Cash Return
5.4%
Cap rate
0.8%
Rent to Value Ratio