Oklahoma City, OK Investment Properties for Sale
Browse homes for sale and investment properties in Oklahoma City, OK. Refine your search by price, property type, or more.
Best cash flowing properties in Oklahoma City, OK

Active
$137,000
3
bds
|
2
ba
|
0
sqft
|
built
1963
2525 NE 18th St, Oklahoma City, OK 73111
$243
Cash flow
9.3%
Cash-on-Cash Return
7.8%
Cap rate
1.0%
Rent to Value Ratio
Active
$99,000
2
bds
|
2
ba
|
0
sqft
|
built
1984
11130 Stratford Dr, Oklahoma City, OK 73120
$205
Cash flow
10.8%
Cash-on-Cash Return
8.2%
Cap rate
1.1%
Rent to Value Ratio
1,423 out of 1,802 properties for sale in Oklahoma City, OK
Limited Results Shown
Create a free account, or log in to reveal all property listings and enjoy the complete experience.
Active
$124,900
3
bds
|
1
ba
|
0
sqft
|
built
1946
501 SE 15th St, Oklahoma City, OK 73129
$124
Cash flow
5.2%
Cash-on-Cash Return
6.9%
Cap rate
0.9%
Rent to Value Ratio

Active
$995,000
2
bds
|
2
ba
|
0
sqft
|
built
2021
1200 Classen Dr, Oklahoma City, OK 73103
$-4,145
Cash flow
-21.7%
Cash-on-Cash Return
0.7%
Cap rate
0.4%
Rent to Value Ratio
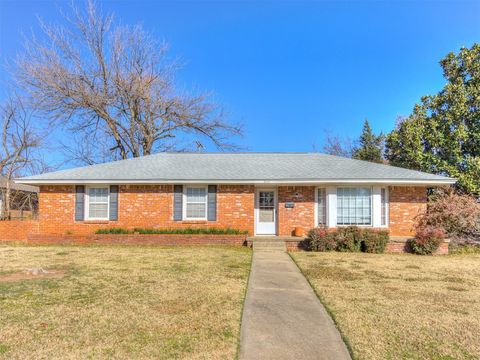
Active
$341,900
2
bds
|
3
ba
|
0
sqft
|
built
1954
3316 NW 60th St, Oklahoma City, OK 73112
$-687
Cash flow
-10.5%
Cash-on-Cash Return
3.3%
Cap rate
0.5%
Rent to Value Ratio
Active
$265,000
3
bds
|
2
ba
|
0
sqft
|
built
1952
9203 Nichols Rd, Oklahoma City, OK 73120
$-339
Cash flow
-6.7%
Cash-on-Cash Return
4.1%
Cap rate
0.6%
Rent to Value Ratio
Active
$465,000
4
bds
|
4
ba
|
0
sqft
|
built
1991
13500 Green Cedar Ln, Oklahoma City, OK 73131
$-512
Cash flow
-5.7%
Cash-on-Cash Return
4.4%
Cap rate
0.6%
Rent to Value Ratio
Active
$99,000
2
bds
|
2
ba
|
0
sqft
|
built
1984
11130 Stratford Dr, Oklahoma City, OK 73120
$205
Cash flow
10.8%
Cash-on-Cash Return
8.2%
Cap rate
1.1%
Rent to Value Ratio
Active
$180,000
3
bds
|
2
ba
|
0
sqft
|
built
1947
3216 NW 31st St, Oklahoma City, OK 73112
$35
Cash flow
1.0%
Cash-on-Cash Return
5.9%
Cap rate
0.8%
Rent to Value Ratio
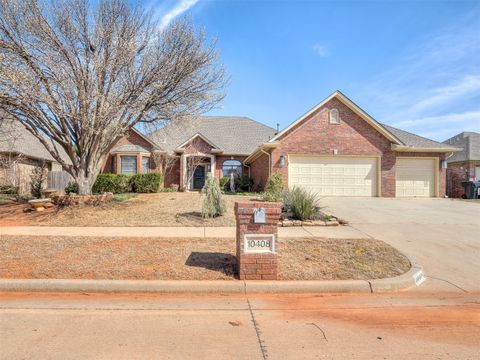
Active
$359,900
4
bds
|
3
ba
|
0
sqft
|
built
1995
10408 Bishops Gate, Oklahoma City, OK 73162
$-424
Cash flow
-6.1%
Cash-on-Cash Return
4.3%
Cap rate
0.6%
Rent to Value Ratio
Active
$674,900
4
bds
|
5
ba
|
0
sqft
|
built
2006
13108 Lorien Way, Oklahoma City, OK 73170
$-827
Cash flow
-6.4%
Cash-on-Cash Return
4.2%
Cap rate
0.7%
Rent to Value Ratio
Active
$448,000
3
bds
|
2
ba
|
0
sqft
|
built
1958
5700 N Billen Ave, Oklahoma City, OK 73112
$-1,079
Cash flow
-12.6%
Cash-on-Cash Return
2.8%
Cap rate
0.4%
Rent to Value Ratio
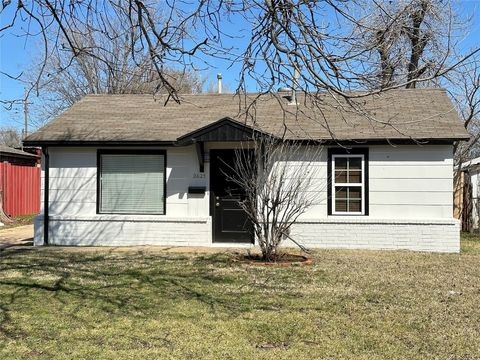
Active
$129,700
2
bds
|
1
ba
|
0
sqft
|
built
1928
3221 NW 15th St, Oklahoma City, OK 73107
$88
Cash flow
3.5%
Cash-on-Cash Return
6.5%
Cap rate
0.8%
Rent to Value Ratio
Active
$220,000
3
bds
|
2
ba
|
0
sqft
|
built
1961
3731 Newport St, Oklahoma City, OK 73112
$-48
Cash flow
-1.1%
Cash-on-Cash Return
5.4%
Cap rate
0.7%
Rent to Value Ratio

Active
$269,900
4
bds
|
2
ba
|
0
sqft
|
built
1964
2008 Lyndon Cir, Oklahoma City, OK 73120
$-232
Cash flow
-4.5%
Cash-on-Cash Return
4.6%
Cap rate
0.7%
Rent to Value Ratio
Active
$850,000
4
bds
|
4
ba
|
0
sqft
|
built
1925
324 NW 24th St, Oklahoma City, OK 73103
$-2,435
Cash flow
-14.9%
Cash-on-Cash Return
2.2%
Cap rate
0.3%
Rent to Value Ratio
Active
$166,250
5
bds
|
2
ba
|
0
sqft
|
built
1949
3216 NW 30th St, Oklahoma City, OK 73112
$52
Cash flow
1.6%
Cash-on-Cash Return
6.1%
Cap rate
0.8%
Rent to Value Ratio
Active
$145,700
3
bds
|
1
ba
|
0
sqft
|
built
1954
1621 SW 65th St, Oklahoma City, OK 73159
$175
Cash flow
6.3%
Cash-on-Cash Return
7.1%
Cap rate
1.0%
Rent to Value Ratio
Active
$220,000
3
bds
|
2
ba
|
0
sqft
|
built
2012
5610 Clearwater Dr, Oklahoma City, OK 73179
$-158
Cash flow
-3.7%
Cash-on-Cash Return
4.8%
Cap rate
0.7%
Rent to Value Ratio
Active
$159,700
3
bds
|
2
ba
|
0
sqft
|
built
1953
729 NW 86th St, Oklahoma City, OK 73114
$-1
Cash flow
0.0%
Cash-on-Cash Return
5.7%
Cap rate
0.8%
Rent to Value Ratio

Active
$400,000
3
bds
|
3
ba
|
0
sqft
|
built
1910
1723 N Mc Kinley Ave, Oklahoma City, OK 73106
$-627
Cash flow
-8.2%
Cash-on-Cash Return
3.8%
Cap rate
0.6%
Rent to Value Ratio
Active
$499,980
4
bds
|
3
ba
|
0
sqft
|
built
2024
16200 Native Dr, Oklahoma City, OK 73170
$-1,316
Cash flow
-13.7%
Cash-on-Cash Return
2.5%
Cap rate
0.4%
Rent to Value Ratio
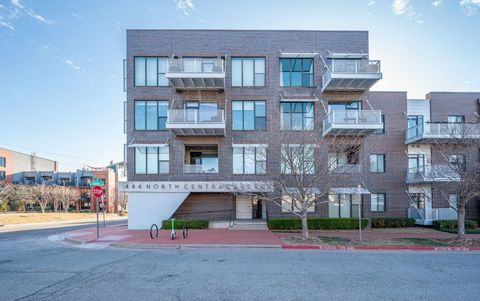
Active
$319,000
2
bds
|
2
ba
|
0
sqft
|
built
2008
444 N Central Ave, Oklahoma City, OK 73104
$-1,074
Cash flow
-17.6%
Cash-on-Cash Return
1.6%
Cap rate
0.5%
Rent to Value Ratio
Active
$204,000
4
bds
|
2
ba
|
0
sqft
|
built
1915
2820 N Ann Dr, Oklahoma City, OK 73107
$-379
Cash flow
-9.7%
Cash-on-Cash Return
3.4%
Cap rate
0.5%
Rent to Value Ratio
Active
$598,500
4
bds
|
4
ba
|
0
sqft
|
built
2014
13216 Knight Island Dr, Oklahoma City, OK 73142
$-1,248
Cash flow
-10.9%
Cash-on-Cash Return
3.2%
Cap rate
0.6%
Rent to Value Ratio
Active
$304,999
4
bds
|
3
ba
|
0
sqft
|
built
1983
7217 NW 118th St, Oklahoma City, OK 73162
$-305
Cash flow
-5.2%
Cash-on-Cash Return
4.5%
Cap rate
0.7%
Rent to Value Ratio
Active
$132,000
2
bds
|
1
ba
|
0
sqft
|
built
1952
2625 SW 43rd St, Oklahoma City, OK 73119
$15
Cash flow
0.6%
Cash-on-Cash Return
5.8%
Cap rate
0.8%
Rent to Value Ratio
Active
$199,000
2
bds
|
1
ba
|
0
sqft
|
built
1929
4315 Granger St, Oklahoma City, OK 73118
$-33
Cash flow
-0.9%
Cash-on-Cash Return
5.5%
Cap rate
0.8%
Rent to Value Ratio

Active
$550,000
5
bds
|
3
ba
|
0
sqft
|
built
1910
1612 N Klein Ave, Oklahoma City, OK 73106
$-672
Cash flow
-6.4%
Cash-on-Cash Return
4.2%
Cap rate
0.6%
Rent to Value Ratio
Active
$255,000
3
bds
|
2
ba
|
0
sqft
|
built
1956
2601 Chaucer Dr, Oklahoma City, OK 73120
$-181
Cash flow
-3.7%
Cash-on-Cash Return
4.8%
Cap rate
0.7%
Rent to Value Ratio
Active
$112,000
3
bds
|
1
ba
|
0
sqft
|
built
1950
1400 NE 27th St, Oklahoma City, OK 73111
$79
Cash flow
3.7%
Cash-on-Cash Return
6.5%
Cap rate
0.9%
Rent to Value Ratio

Active
$168,000
2
bds
|
1
ba
|
0
sqft
|
built
1915
1626 NW 12th St, Oklahoma City, OK 73106
$19
Cash flow
0.6%
Cash-on-Cash Return
5.8%
Cap rate
0.7%
Rent to Value Ratio
Active
$137,000
3
bds
|
2
ba
|
0
sqft
|
built
1963
2525 NE 18th St, Oklahoma City, OK 73111
$243
Cash flow
9.3%
Cash-on-Cash Return
7.8%
Cap rate
1.0%
Rent to Value Ratio
Active
$269,900
3
bds
|
3
ba
|
0
sqft
|
built
1937
1227 NW 92nd St, Oklahoma City, OK 73114
$-83
Cash flow
-1.6%
Cash-on-Cash Return
5.3%
Cap rate
0.7%
Rent to Value Ratio

Active
$875,000
2
bds
|
3
ba
|
0
sqft
|
built
1995
2825 NW Grand Blvd, Oklahoma City, OK 73116
$-2,715
Cash flow
-16.2%
Cash-on-Cash Return
2.0%
Cap rate
0.5%
Rent to Value Ratio
Active
$215,000
3
bds
|
2
ba
|
0
sqft
|
built
1930
1420 NE 15th St, Oklahoma City, OK 73117
$-66
Cash flow
-1.6%
Cash-on-Cash Return
5.3%
Cap rate
0.7%
Rent to Value Ratio
Active
$839,000
3
bds
|
3
ba
|
0
sqft
|
built
2022
815 NW 68th St, Oklahoma City, OK 73116
$-2,594
Cash flow
-16.1%
Cash-on-Cash Return
2.0%
Cap rate
0.3%
Rent to Value Ratio
Active
$245,000
1
bds
|
2
ba
|
0
sqft
|
built
1960
5900 Mosteller Dr, Oklahoma City, OK 73112
$82
Cash flow
1.7%
Cash-on-Cash Return
6.1%
Cap rate
0.9%
Rent to Value Ratio
Active
$799,900
2
bds
|
3
ba
|
0
sqft
|
built
2008
17 NE 3rd St, Oklahoma City, OK 73104
$-2,247
Cash flow
-14.7%
Cash-on-Cash Return
2.3%
Cap rate
0.4%
Rent to Value Ratio
Active
$369,245
4
bds
|
3
ba
|
0
sqft
|
built
1950
1731 Carlisle Rd, Oklahoma City, OK 73120
$-790
Cash flow
-11.2%
Cash-on-Cash Return
3.1%
Cap rate
0.4%
Rent to Value Ratio
Active
$239,500
3
bds
|
2
ba
|
0
sqft
|
built
1954
3301 NW 60th St, Oklahoma City, OK 73112
$-80
Cash flow
-1.7%
Cash-on-Cash Return
5.3%
Cap rate
0.8%
Rent to Value Ratio
Active
$1,124,999
5
bds
|
7
ba
|
0
sqft
|
built
1978
3108 Brush Creek Rd, Oklahoma City, OK 73120
$-2,855
Cash flow
-13.2%
Cash-on-Cash Return
2.6%
Cap rate
0.4%
Rent to Value Ratio