Oklahoma City, OK Investment Properties for Sale
Browse homes for sale and investment properties in Oklahoma City, OK. Refine your search by price, property type, or more.
Best cash flowing properties in Oklahoma City, OK
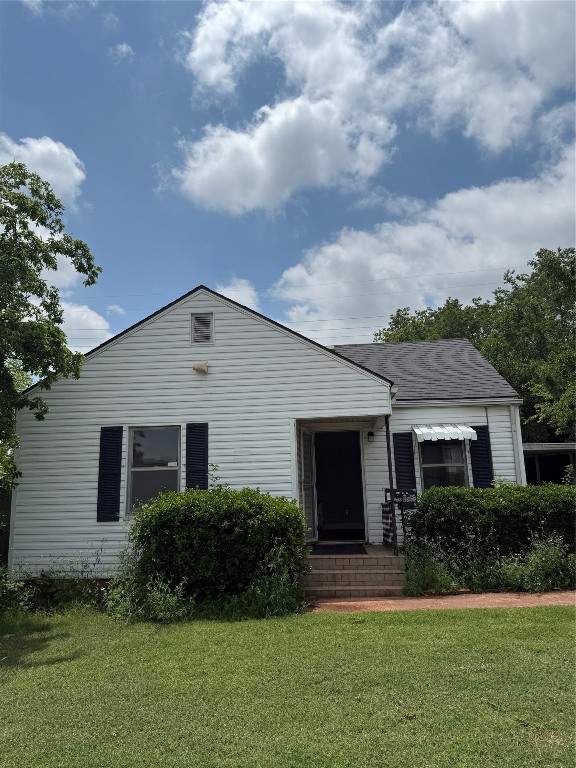
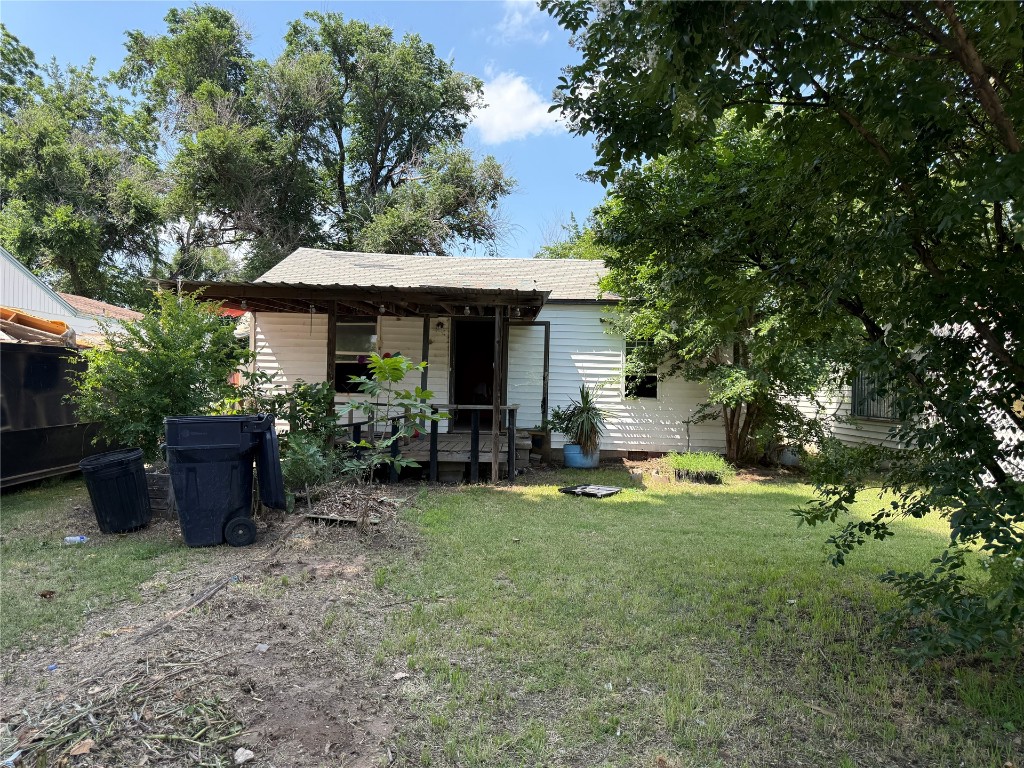
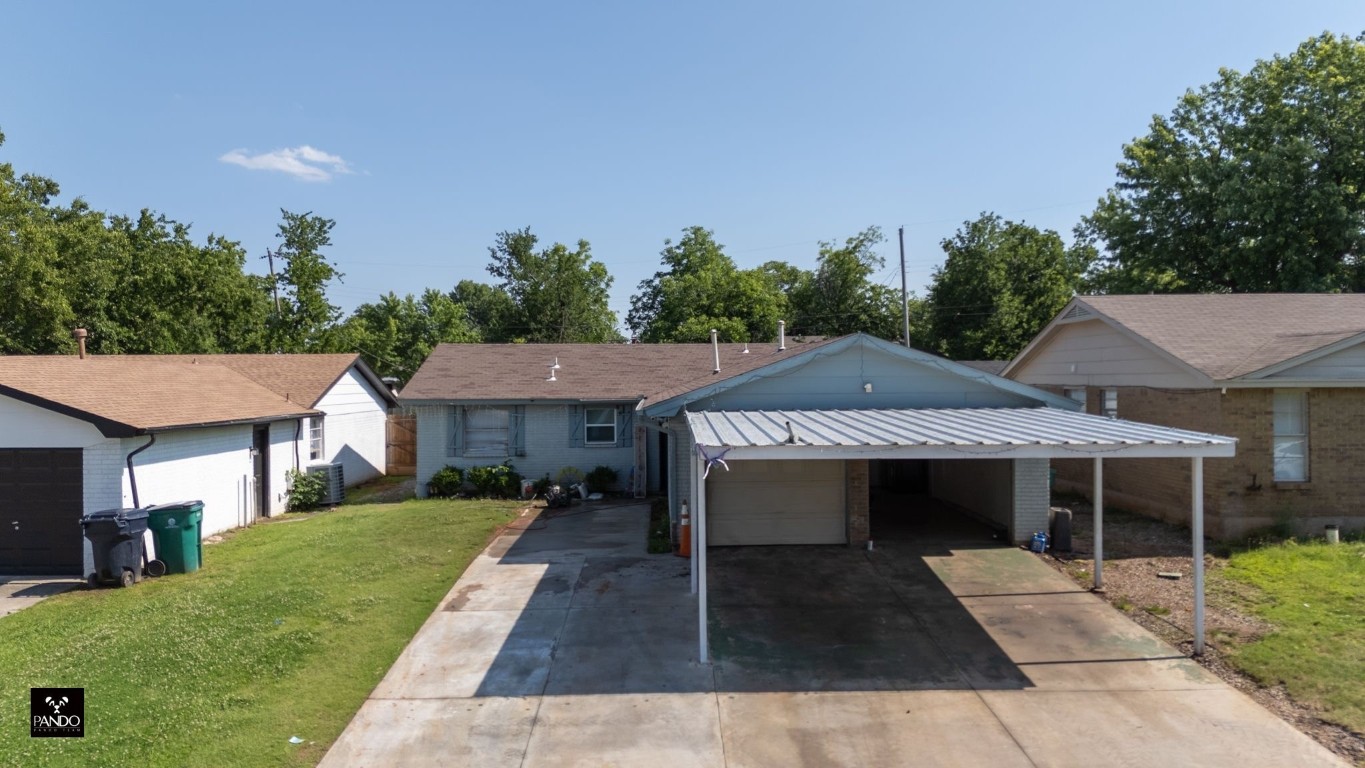
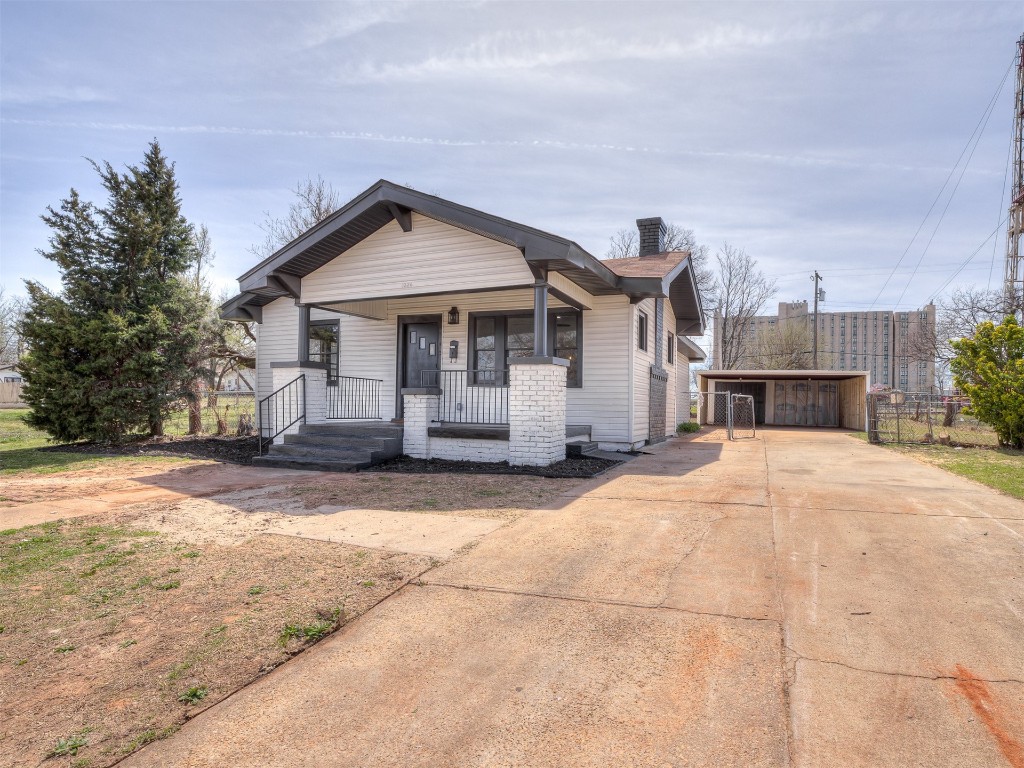
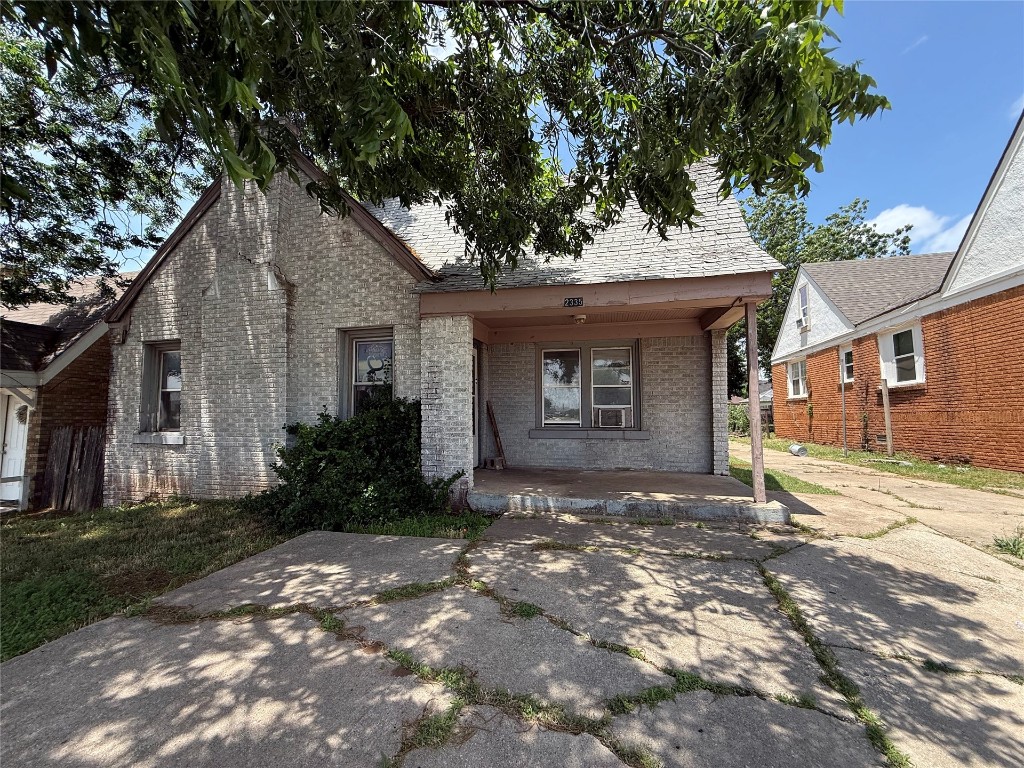
Active
$25,000
2
bds
|
1
ba
|
0
sqft
|
built
1940
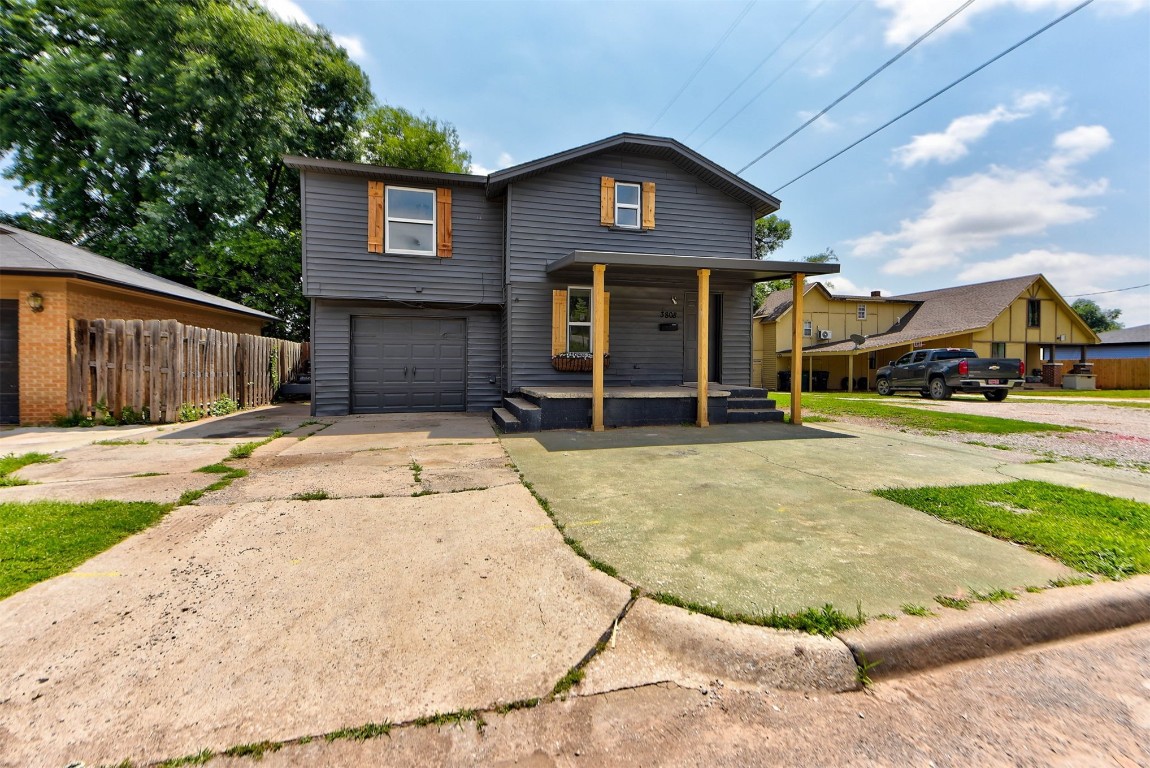
1120 NW 56th St, Oklahoma City, OK 73118
$966
Cash flow
45.0%
Cash-on-Cash Return
46.4%
Cap rate
5.6%
Rent to Value Ratio
Active
$86,500
3
bds
|
2
ba
|
0
sqft
|
built
1950
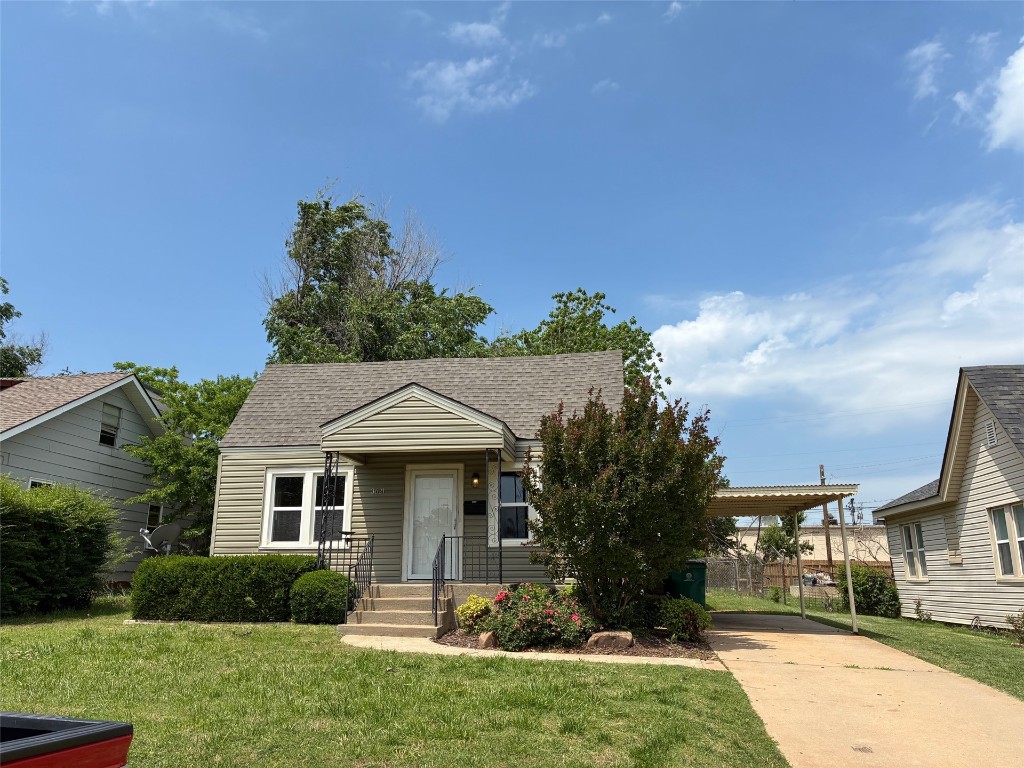
1321 SW 13th St, Oklahoma City, OK 73108
$495
Cash flow
29.9%
Cash-on-Cash Return
13.2%
Cap rate
1.6%
Rent to Value Ratio
1,305 out of 1,668 properties for sale in Oklahoma City, OK
Limited Results Shown
Create a free account, or log in to reveal all property listings and enjoy the complete experience.
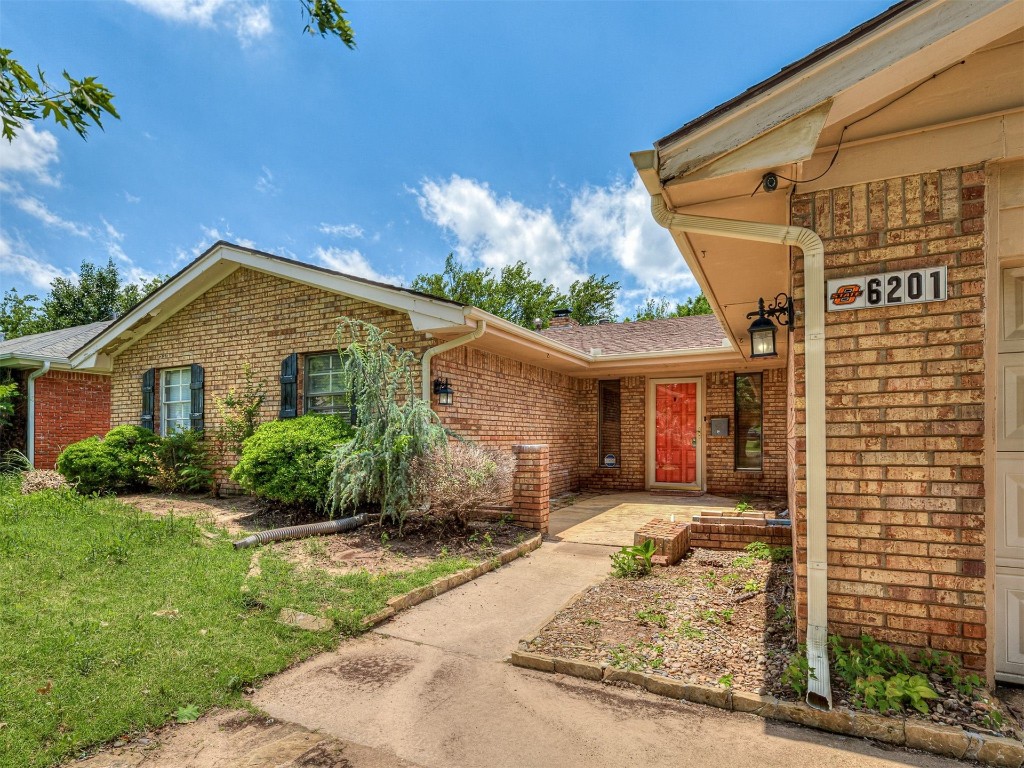
Active
$225,000
4
bds
|
2
ba
|
0
sqft
|
built
1964
6201 N Allison Dr, Oklahoma City, OK 73112
$-130
Cash flow
-3.0%
Cash-on-Cash Return
5.6%
Cap rate
0.8%
Rent to Value Ratio
Active
$195,000
3
bds
|
2
ba
|
0
sqft
|
built
2008
933 NE 84th St, Oklahoma City, OK 73114
$-122
Cash flow
-3.3%
Cash-on-Cash Return
5.5%
Cap rate
0.8%
Rent to Value Ratio
Active
$180,000
3
bds
|
2
ba
|
0
sqft
|
built
1971
428 NW 91st St, Oklahoma City, OK 73114
$-211
Cash flow
-6.1%
Cash-on-Cash Return
4.9%
Cap rate
0.7%
Rent to Value Ratio
Active
$595,000
5
bds
|
4
ba
|
0
sqft
|
built
1973
13229 Cedar Springs Rd, Oklahoma City, OK 73120
$-1,244
Cash flow
-10.9%
Cash-on-Cash Return
3.8%
Cap rate
0.6%
Rent to Value Ratio
Active
$96,000
2
bds
|
1
ba
|
0
sqft
|
built
1920
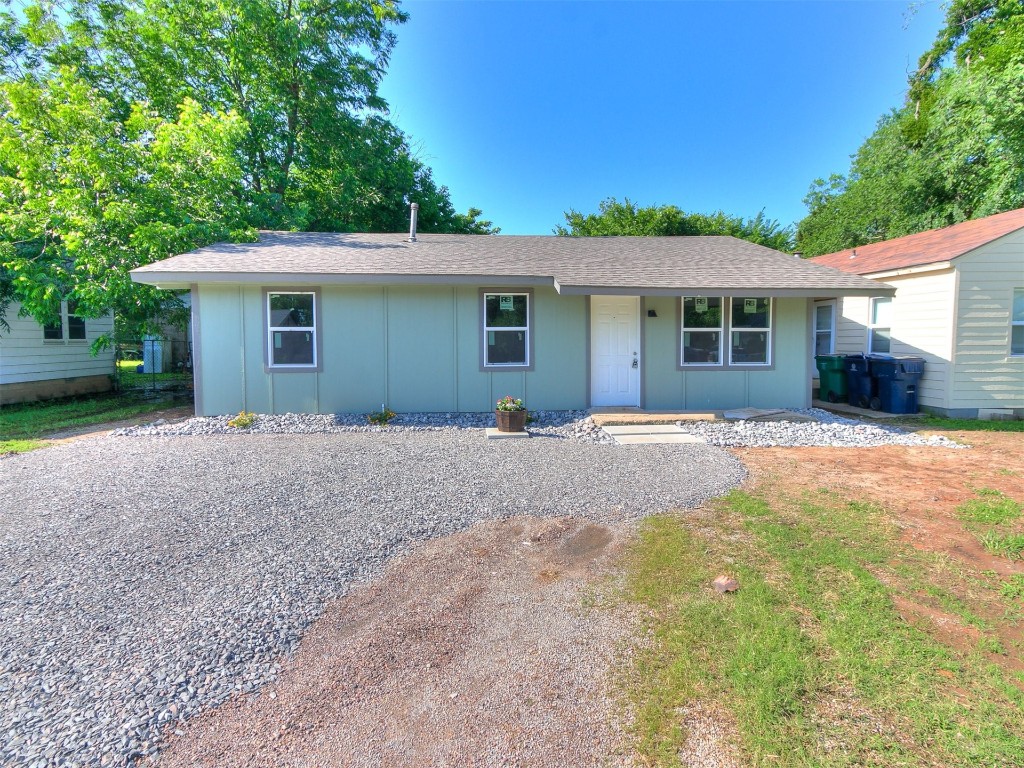
1725 NE 11th St, Oklahoma City, OK 73117
$167
Cash flow
9.1%
Cash-on-Cash Return
8.4%
Cap rate
1.0%
Rent to Value Ratio
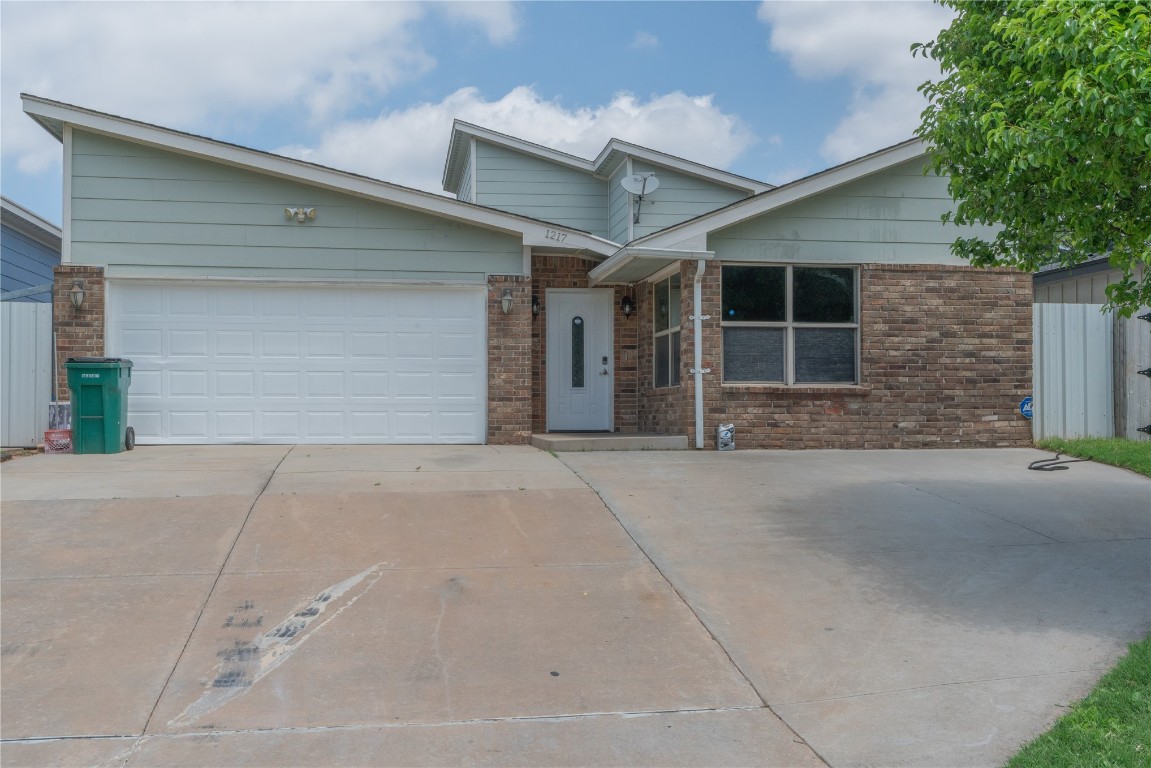
Active
$249,900
5
bds
|
4
ba
|
0
sqft
|
built
2009
1217 SW 18th St, Oklahoma City, OK 73108
$-305
Cash flow
-6.4%
Cash-on-Cash Return
4.8%
Cap rate
0.6%
Rent to Value Ratio
Active
$199,000
3
bds
|
2
ba
|
0
sqft
|
built
1921
1324 NE 14th St, Oklahoma City, OK 73117
$-221
Cash flow
-5.8%
Cash-on-Cash Return
5.0%
Cap rate
0.7%
Rent to Value Ratio
Active
$910,000
8
bds
|
8
ba
|
0
sqft
|
built
2021
1138 N Blackwelder Ave, Oklahoma City, OK 73106
$-3,981
Cash flow
-22.8%
Cash-on-Cash Return
1.0%
Cap rate
0.2%
Rent to Value Ratio
Active
$280,000
4
bds
|
2
ba
|
0
sqft
|
built
1990
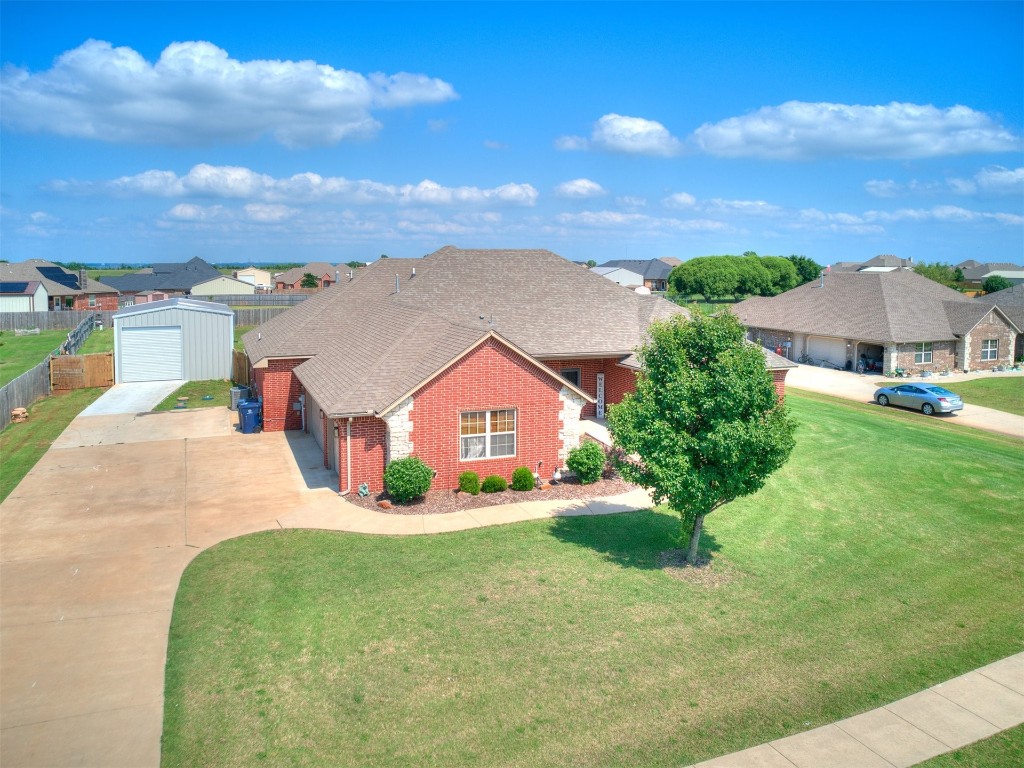
3033 SW 126th St, Oklahoma City, OK 73170
$-403
Cash flow
-7.5%
Cash-on-Cash Return
4.6%
Cap rate
0.7%
Rent to Value Ratio
Active
$172,000
3
bds
|
2
ba
|
0
sqft
|
built
1959
3217 NW 34th St, Oklahoma City, OK 73112
$-118
Cash flow
-3.6%
Cash-on-Cash Return
5.5%
Cap rate
0.8%
Rent to Value Ratio
Active
$138,000
4
bds
|
2
ba
|
0
sqft
|
built
1940
3808 S Hudson Ave, Oklahoma City, OK 73109
$257
Cash flow
9.7%
Cash-on-Cash Return
8.5%
Cap rate
1.2%
Rent to Value Ratio
Active
$329,900
4
bds
|
2
ba
|
0
sqft
|
built
2000
10700 S Miller Ave, Oklahoma City, OK 73170
$-827
Cash flow
-13.1%
Cash-on-Cash Return
3.3%
Cap rate
0.5%
Rent to Value Ratio
Pending
$155,000
2
bds
|
1
ba
|
0
sqft
|
built
1937
3621 N Westmont St, Oklahoma City, OK 73118
$44
Cash flow
1.5%
Cash-on-Cash Return
6.6%
Cap rate
0.9%
Rent to Value Ratio
Active
$239,000
4
bds
|
2
ba
|
0
sqft
|
built
1950
3838 NW 32nd St, Oklahoma City, OK 73112
$-218
Cash flow
-4.8%
Cash-on-Cash Return
5.2%
Cap rate
0.7%
Rent to Value Ratio
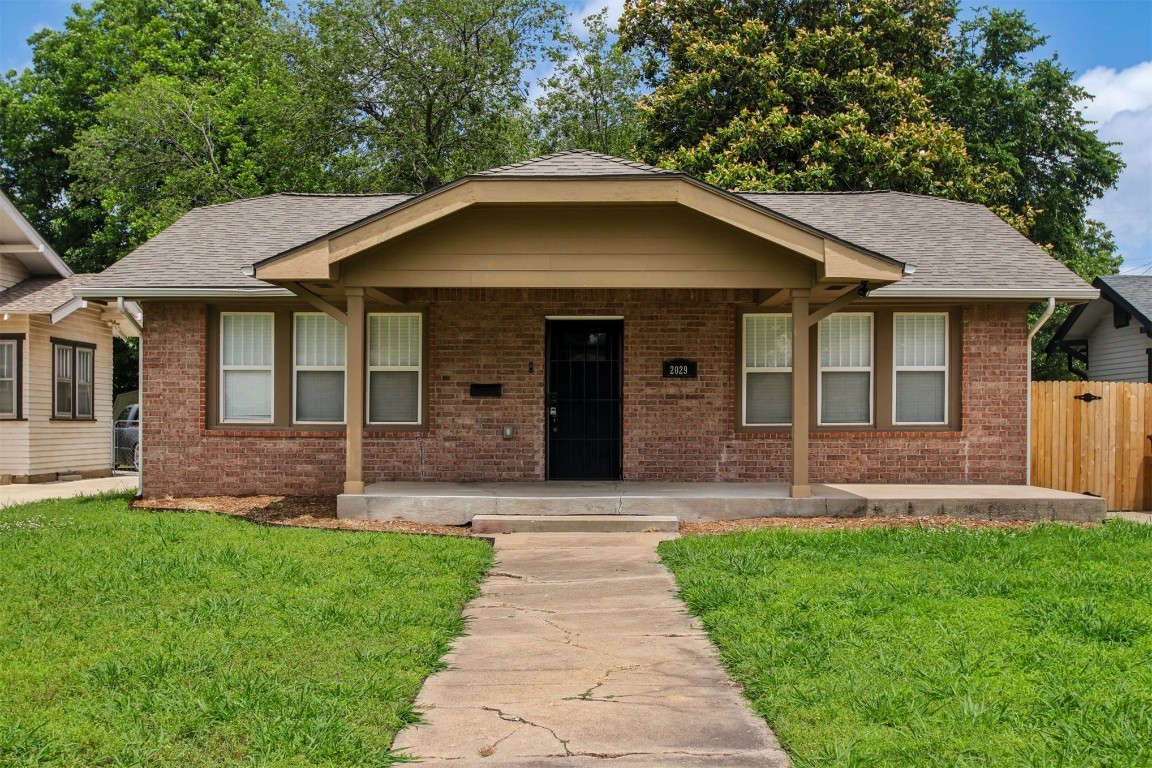
Active
$283,000
3
bds
|
2
ba
|
0
sqft
|
built
1926
2029 NW 18th St, Oklahoma City, OK 73106
$-571
Cash flow
-10.5%
Cash-on-Cash Return
3.9%
Cap rate
0.6%
Rent to Value Ratio
Active
$780,000
3
bds
|
4
ba
|
0
sqft
|
built
2008
23 NE 3rd St, Oklahoma City, OK 73104
$-1,776
Cash flow
-11.9%
Cash-on-Cash Return
3.6%
Cap rate
0.6%
Rent to Value Ratio
Active
$230,000
3
bds
|
2
ba
|
0
sqft
|
built
2018
7621 Percheron Rd, Oklahoma City, OK 73132
$-441
Cash flow
-10.0%
Cash-on-Cash Return
4.0%
Cap rate
0.6%
Rent to Value Ratio
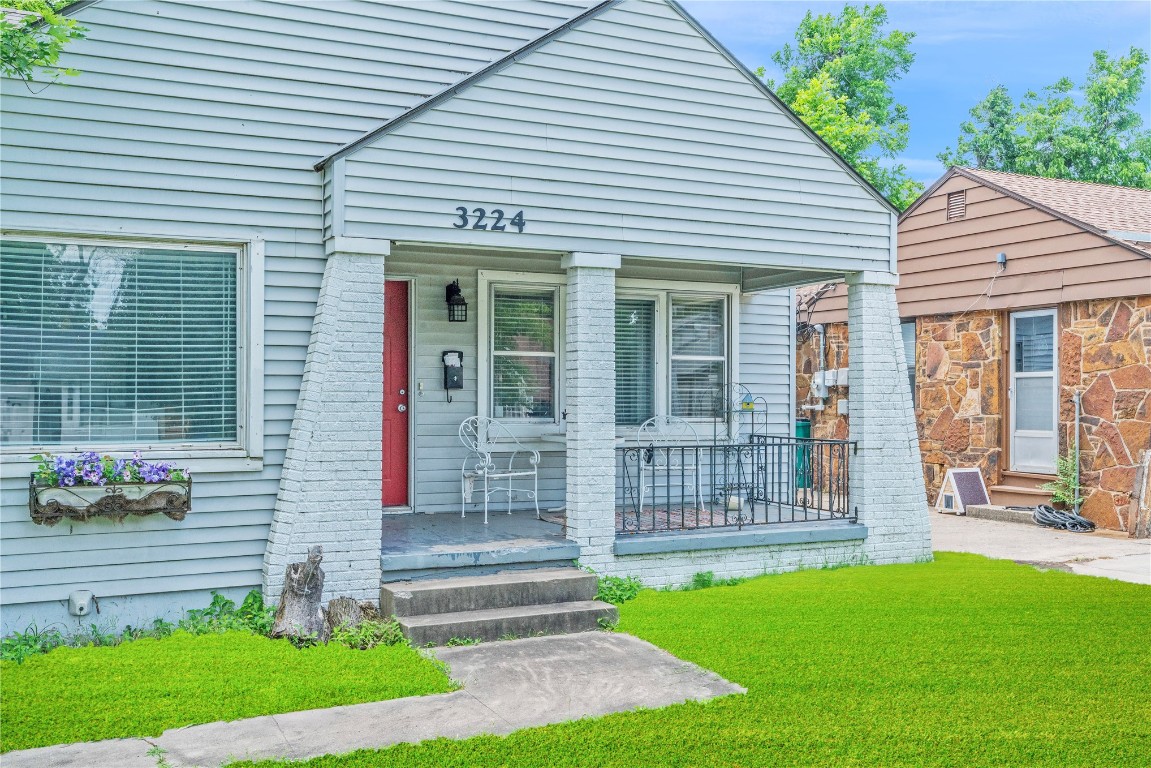
Active
$164,999
2
bds
|
1
ba
|
0
sqft
|
built
1936
3224 NW 24th St, Oklahoma City, OK 73107
$-181
Cash flow
-5.7%
Cash-on-Cash Return
5.0%
Cap rate
0.7%
Rent to Value Ratio
Active
$421,000
2
bds
|
2
ba
|
0
sqft
|
built
2025
1303 NW 2nd St, Oklahoma City, OK 73106
$-1,535
Cash flow
-19.0%
Cash-on-Cash Return
1.9%
Cap rate
0.3%
Rent to Value Ratio
Active
$489,000
3
bds
|
3
ba
|
0
sqft
|
built
1925
121 NW 27th St, Oklahoma City, OK 73103
$-942
Cash flow
-10.1%
Cash-on-Cash Return
4.0%
Cap rate
0.6%
Rent to Value Ratio
Active
$90,000
1
bds
|
2
ba
|
0
sqft
|
built
1979
823 Two Forty Pl, Oklahoma City, OK 73139
$-120
Cash flow
-7.0%
Cash-on-Cash Return
4.7%
Cap rate
1.3%
Rent to Value Ratio
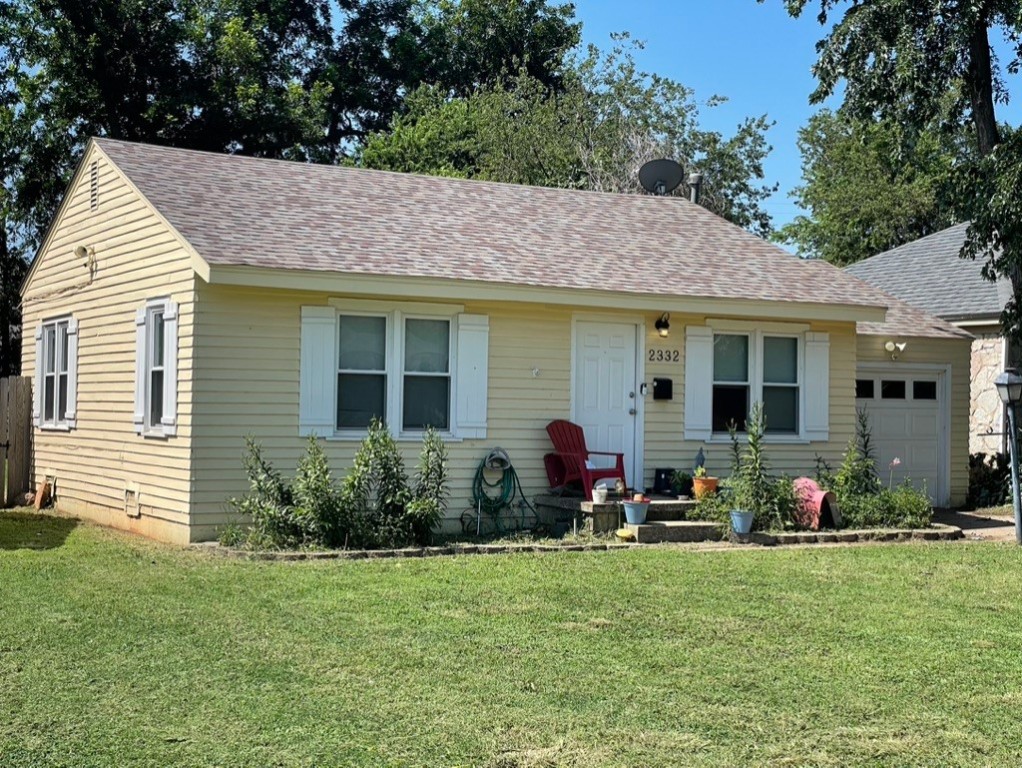
Active
$112,000
2
bds
|
1
ba
|
0
sqft
|
built
1947
2332 NW 36th St, Oklahoma City, OK 73112
$232
Cash flow
10.8%
Cash-on-Cash Return
8.8%
Cap rate
1.2%
Rent to Value Ratio
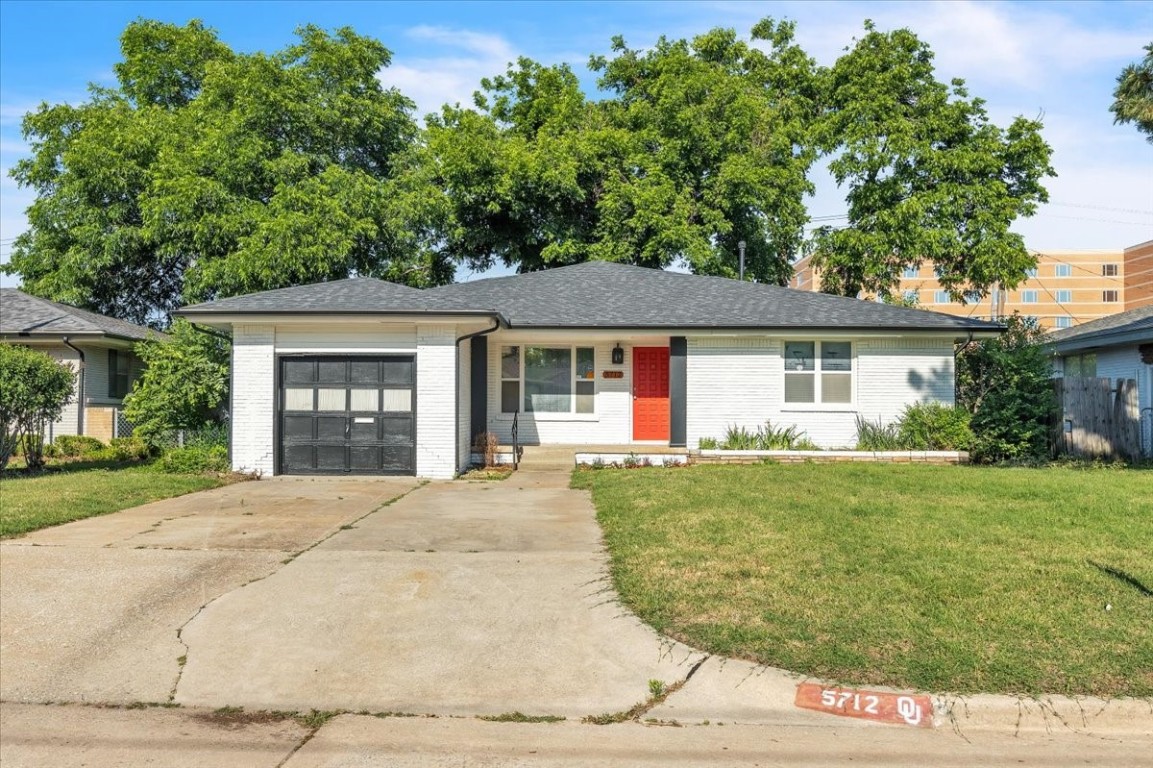
Active
$249,000
3
bds
|
3
ba
|
0
sqft
|
built
1955
5712 N Roff Ave, Oklahoma City, OK 73112
$-291
Cash flow
-6.1%
Cash-on-Cash Return
4.9%
Cap rate
0.7%
Rent to Value Ratio
Active
$695,000
4
bds
|
3
ba
|
0
sqft
|
built
1957
1401 Westchester Dr, Oklahoma City, OK 73120
$-2,121
Cash flow
-15.9%
Cash-on-Cash Return
2.6%
Cap rate
0.4%
Rent to Value Ratio
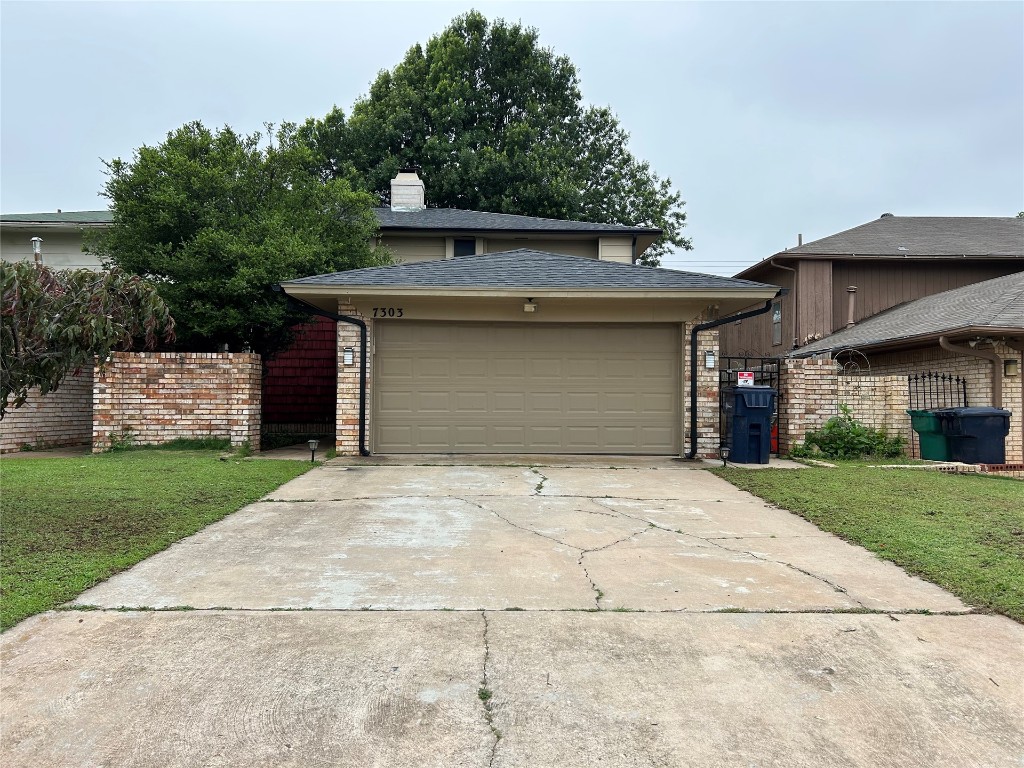
Active
$160,000
2
bds
|
3
ba
|
0
sqft
|
built
1973
7303 Edenborough Dr, Oklahoma City, OK 73132
$23
Cash flow
0.8%
Cash-on-Cash Return
6.5%
Cap rate
0.9%
Rent to Value Ratio
Active
$120,000
3
bds
|
1
ba
|
0
sqft
|
built
1954
2412 SE 12th St, Oklahoma City, OK 73129
$219
Cash flow
9.5%
Cash-on-Cash Return
8.5%
Cap rate
1.1%
Rent to Value Ratio
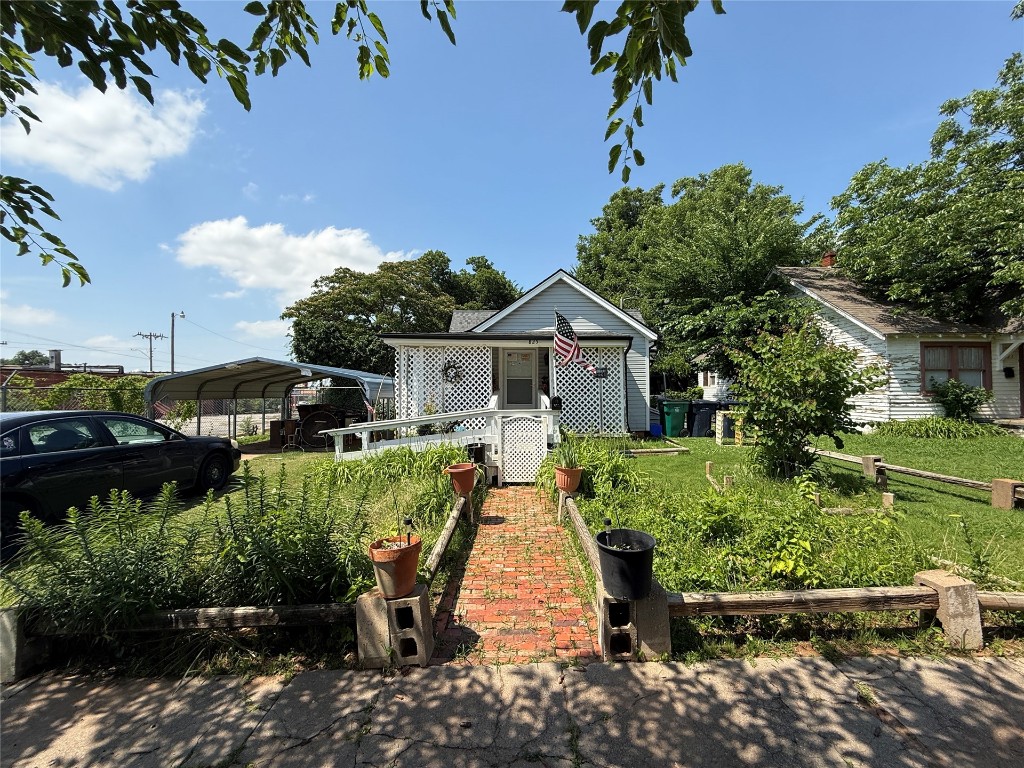
Active
$79,900
2
bds
|
1
ba
|
0
sqft
|
built
1920
825 SW 25th St, Oklahoma City, OK 73109
$385
Cash flow
25.1%
Cash-on-Cash Return
12.1%
Cap rate
1.5%
Rent to Value Ratio
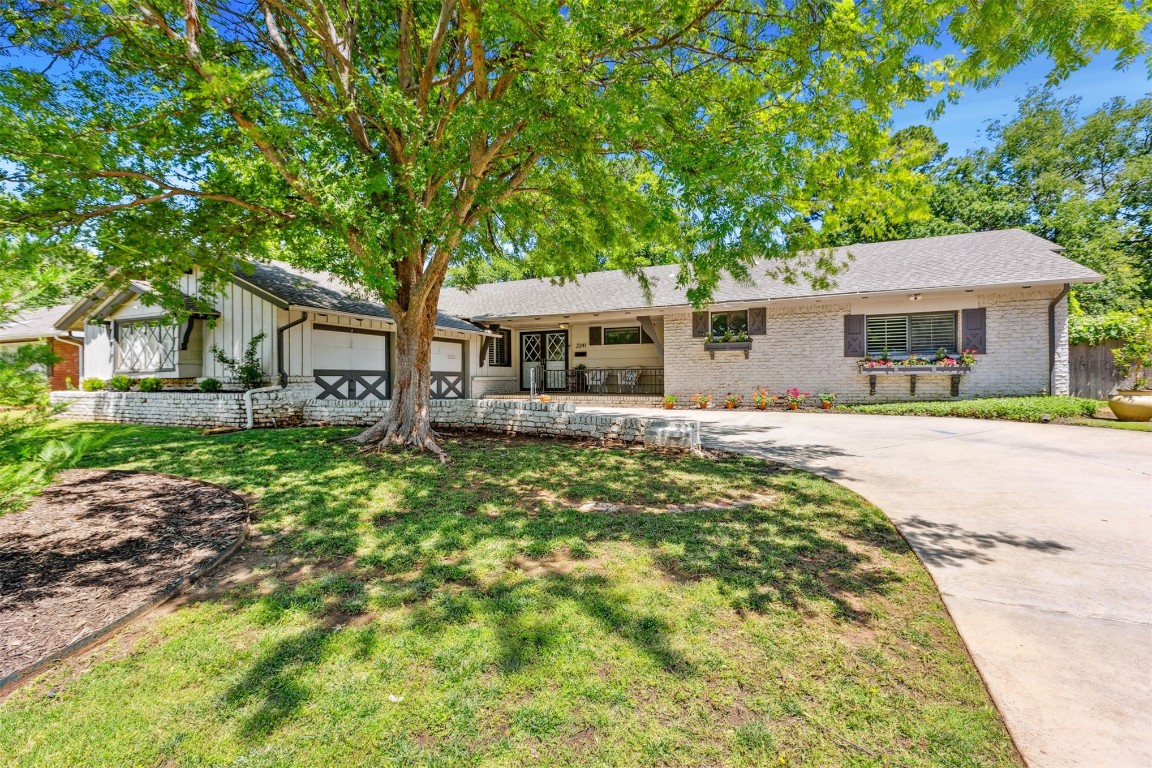
Active
$575,000
2
bds
|
2
ba
|
0
sqft
|
built
1956
2241 NW 56th St, Oklahoma City, OK 73112
$-1,737
Cash flow
-15.8%
Cash-on-Cash Return
2.7%
Cap rate
0.4%
Rent to Value Ratio
Active
$279,900
3
bds
|
2
ba
|
0
sqft
|
built
1939
2647 NW 24th St, Oklahoma City, OK 73107
$-500
Cash flow
-9.3%
Cash-on-Cash Return
4.1%
Cap rate
0.6%
Rent to Value Ratio
Active
$405,000
4
bds
|
2
ba
|
0
sqft
|
built
1997
7705 Dripping Springs Ln, Oklahoma City, OK 73150
$-936
Cash flow
-12.1%
Cash-on-Cash Return
3.5%
Cap rate
0.6%
Rent to Value Ratio
Active
$25,000
2
bds
|
1
ba
|
0
sqft
|
built
1940
1120 NW 56th St, Oklahoma City, OK 73118
$966
Cash flow
45.0%
Cash-on-Cash Return
46.4%
Cap rate
5.6%
Rent to Value Ratio
Active
$525,000
4
bds
|
3
ba
|
0
sqft
|
built
2012
14616 Almond Valley Dr, Oklahoma City, OK 73165
$-1,412
Cash flow
-14.0%
Cash-on-Cash Return
3.1%
Cap rate
0.5%
Rent to Value Ratio
Active
$150,000
3
bds
|
2
ba
|
0
sqft
|
built
1972
3522 SW 39th St, Oklahoma City, OK 73119
$-20
Cash flow
-0.7%
Cash-on-Cash Return
6.1%
Cap rate
0.8%
Rent to Value Ratio
Active
$86,500
3
bds
|
2
ba
|
0
sqft
|
built
1950
1321 SW 13th St, Oklahoma City, OK 73108
$495
Cash flow
29.9%
Cash-on-Cash Return
13.2%
Cap rate
1.6%
Rent to Value Ratio
Active
$223,000
3
bds
|
2
ba
|
0
sqft
|
built
1997
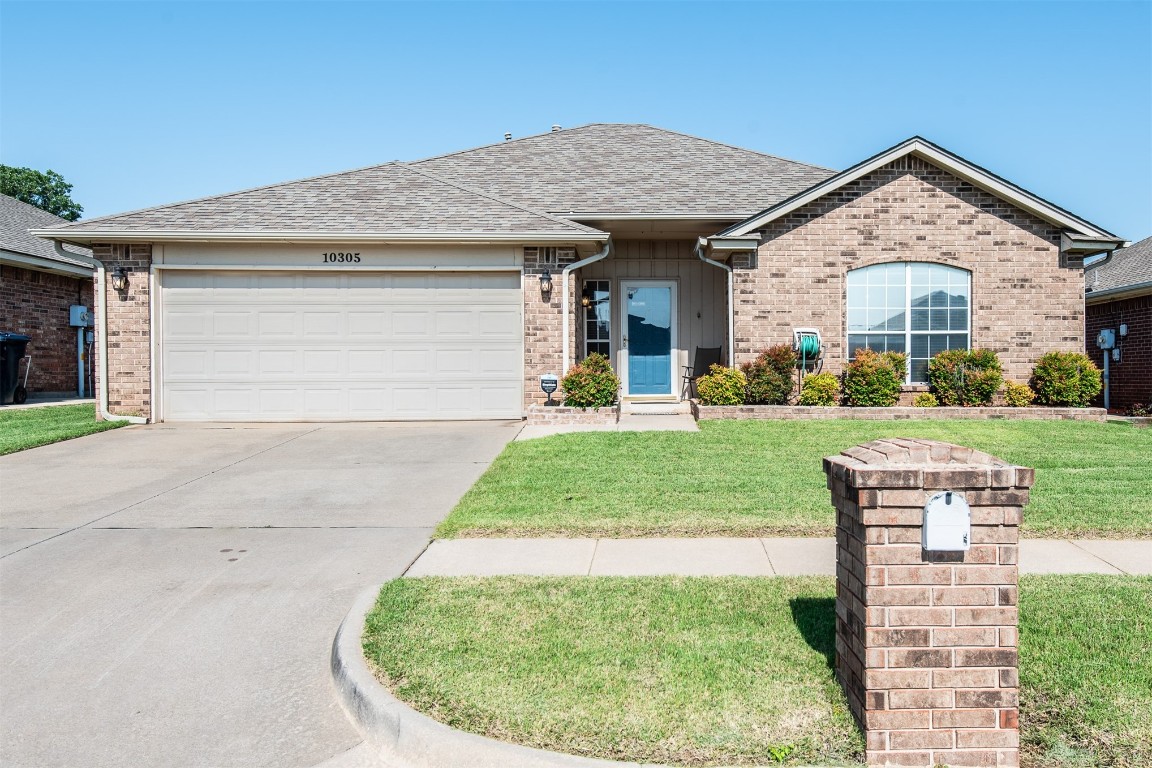
10305 Portsmouth Ct, Oklahoma City, OK 73159
$-233
Cash flow
-5.5%
Cash-on-Cash Return
5.0%
Cap rate
0.7%
Rent to Value Ratio
Active
$225,900
3
bds
|
2
ba
|
0
sqft
|
built
2019
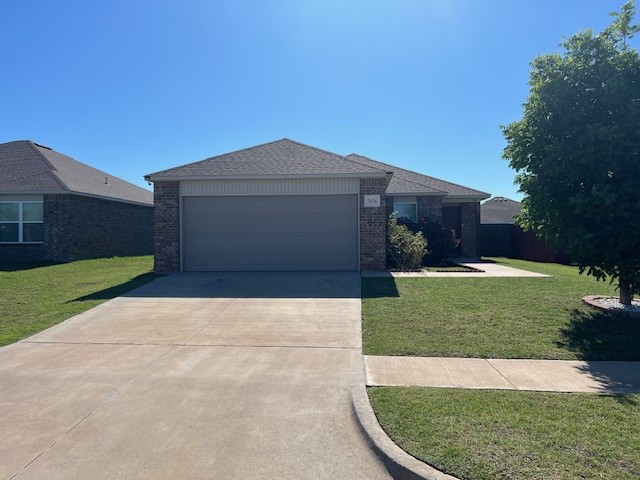
7636 Leichter Ave, Oklahoma City, OK 73132
$-310
Cash flow
-7.2%
Cash-on-Cash Return
4.6%
Cap rate
0.7%
Rent to Value Ratio
Active
$79,500
2
bds
|
1
ba
|
0
sqft
|
built
1930
2335 NW 10th St, Oklahoma City, OK 73107
$372
Cash flow
24.4%
Cash-on-Cash Return
11.9%
Cap rate
1.6%
Rent to Value Ratio
Active
$523,000
3
bds
|
3
ba
|
0
sqft
|
built
2006
2616 SW 139th St, Oklahoma City, OK 73170
$-1,289
Cash flow
-12.9%
Cash-on-Cash Return
3.3%
Cap rate
0.5%
Rent to Value Ratio
Active
$525,000
4
bds
|
4
ba
|
0
sqft
|
built
2009
13037 SE 94th St, Oklahoma City, OK 73165
$-1,342
Cash flow
-13.3%
Cash-on-Cash Return
3.2%
Cap rate
0.5%
Rent to Value Ratio
Active
$289,900
3
bds
|
2
ba
|
0
sqft
|
built
2020
3909 Palisade Ln, Oklahoma City, OK 73179
$-557
Cash flow
-10.0%
Cash-on-Cash Return
4.0%
Cap rate
0.6%
Rent to Value Ratio