Oklahoma City, OK Investment Properties for Sale
Browse homes for sale and investment properties in Oklahoma City, OK. Refine your search by price, property type, or more.
Best cash flowing properties in Oklahoma City, OK
Active
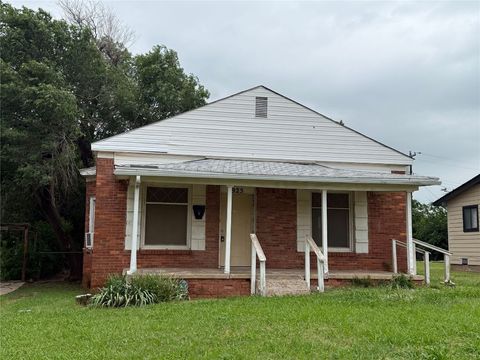
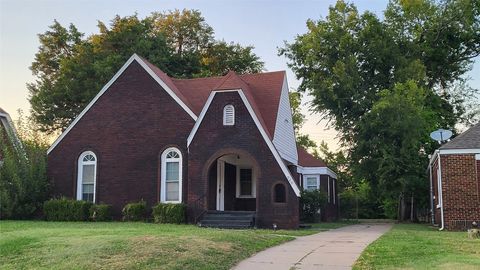
$90,000
3
bds
|
1
ba
|
0
sqft
|
built
1953
925 NE 31st St, Oklahoma City, OK 73105
$433
Cash flow
25.1%
Cash-on-Cash Return
11.5%
Cap rate
1.4%
Rent to Value Ratio

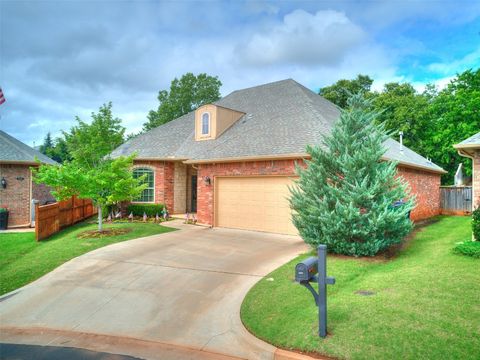
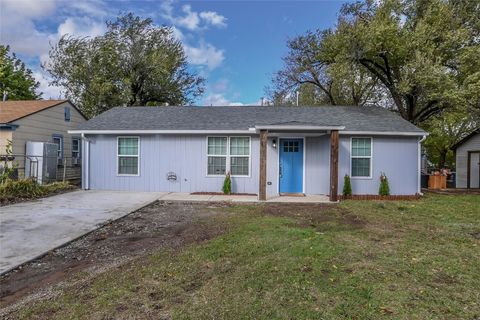
Active
$100,000
3
bds
|
2
ba
|
0
sqft
|
built
2014
1826 S Stonewall Ave, Oklahoma City, OK 73129
$332
Cash flow
17.3%
Cash-on-Cash Return
9.7%
Cap rate
1.3%
Rent to Value Ratio
1,276 out of 1,637 properties for sale in Oklahoma City, OK
Limited Results Shown
Create a free account, or log in to reveal all property listings and enjoy the complete experience.
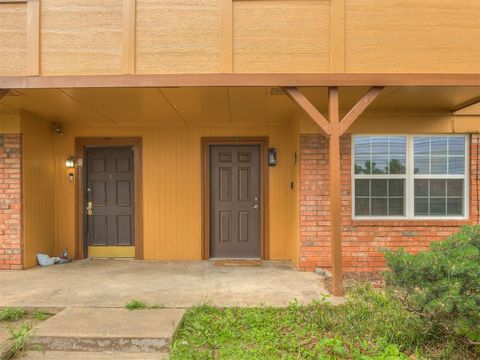
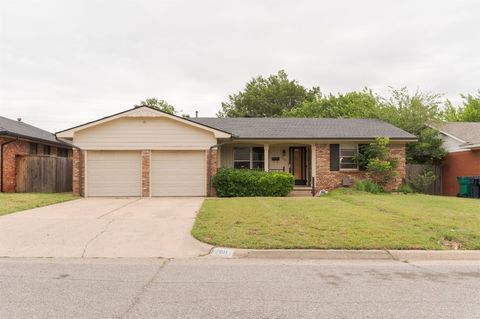
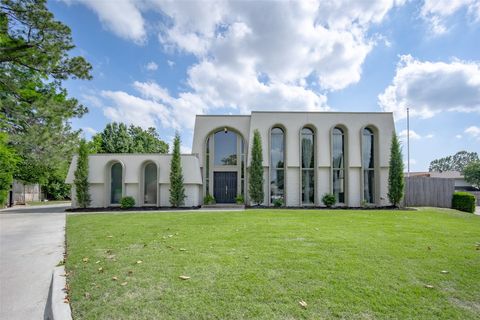
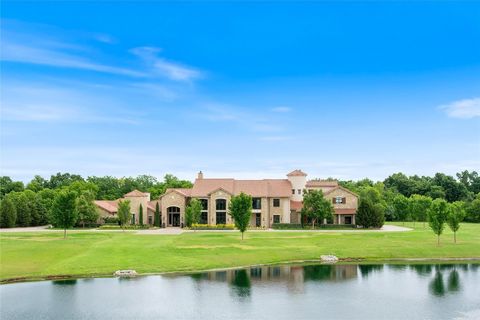
Active
$460,000
3
bds
|
2
ba
|
0
sqft
|
built
2018
5636 NW 126th St, Oklahoma City, OK 73142
$-976
Cash flow
-11.1%
Cash-on-Cash Return
3.1%
Cap rate
0.6%
Rent to Value Ratio
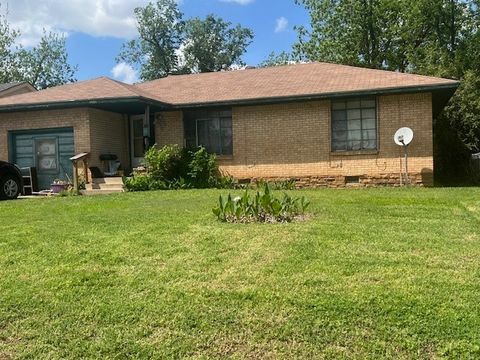
Active
$90,000
3
bds
|
1
ba
|
0
sqft
|
built
1953
925 NE 31st St, Oklahoma City, OK 73105
$433
Cash flow
25.1%
Cash-on-Cash Return
11.5%
Cap rate
1.4%
Rent to Value Ratio
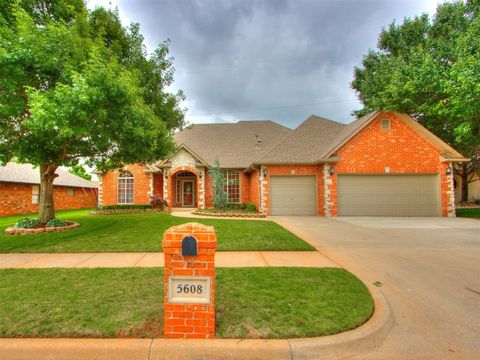
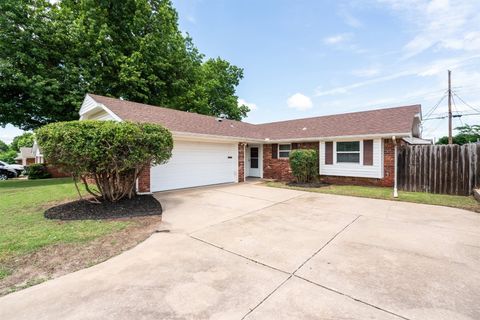
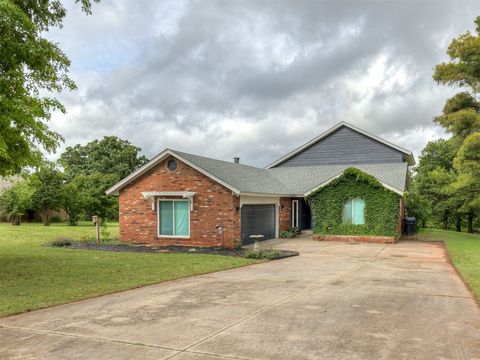
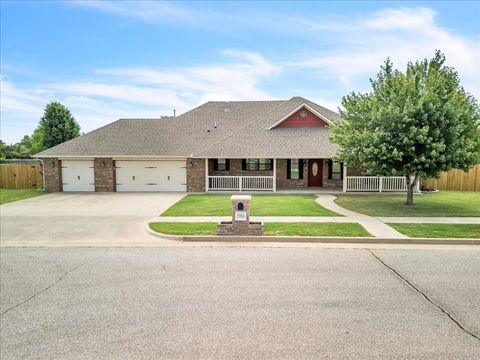
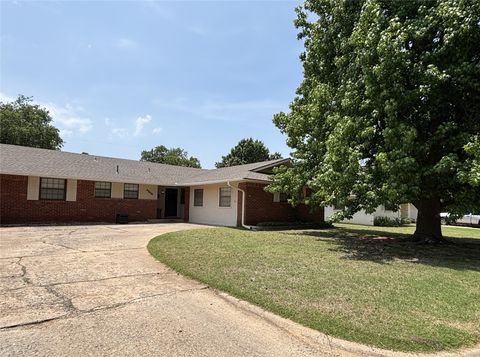
Active
$370,000
3
bds
|
3
ba
|
0
sqft
|
built
1996
5608 NW 103rd St, Oklahoma City, OK 73162
$-253
Cash flow
-3.6%
Cash-on-Cash Return
4.9%
Cap rate
0.6%
Rent to Value Ratio

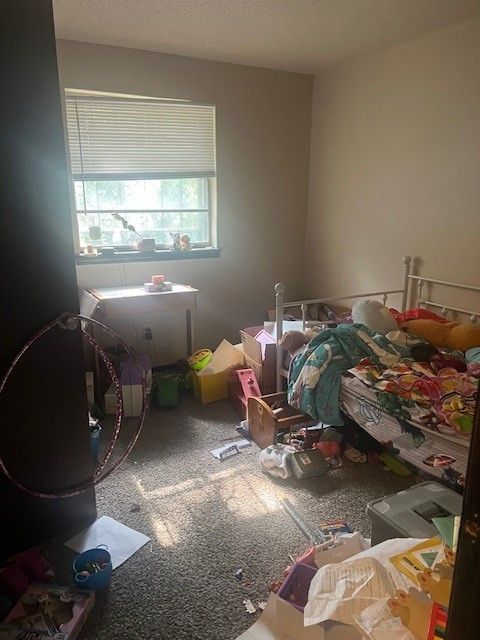
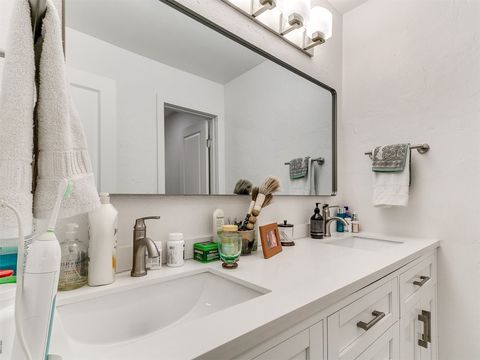
Active
$238,000
2
bds
|
2
ba
|
0
sqft
|
built
1929
2040 NW 20th St, Oklahoma City, OK 73106
$-249
Cash flow
-5.5%
Cash-on-Cash Return
4.4%
Cap rate
0.8%
Rent to Value Ratio
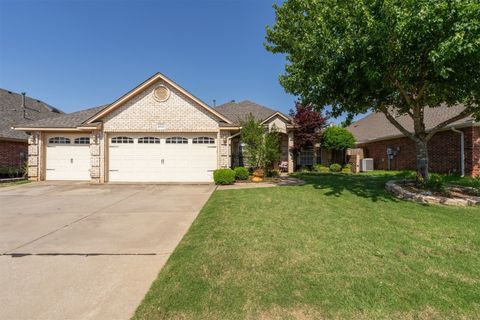
Active
$100,000
3
bds
|
2
ba
|
0
sqft
|
built
2014
1826 S Stonewall Ave, Oklahoma City, OK 73129
$332
Cash flow
17.3%
Cash-on-Cash Return
9.7%
Cap rate
1.3%
Rent to Value Ratio
Active
$95,000
4
bds
|
2
ba
|
0
sqft
|
built
1969
5229 S Briarwood Dr, Oklahoma City, OK 73135
$318
Cash flow
17.5%
Cash-on-Cash Return
9.7%
Cap rate
1.3%
Rent to Value Ratio
Active
$100,000
2
bds
|
3
ba
|
0
sqft
|
built
1975
2608 N Ann Arbor Ave, Oklahoma City, OK 73127
$-115
Cash flow
-6.0%
Cash-on-Cash Return
4.3%
Cap rate
1.1%
Rent to Value Ratio
Active
$249,000
4
bds
|
3
ba
|
0
sqft
|
built
1962
4333 NW 55th St, Oklahoma City, OK 73112
$-267
Cash flow
-5.6%
Cash-on-Cash Return
4.4%
Cap rate
0.6%
Rent to Value Ratio
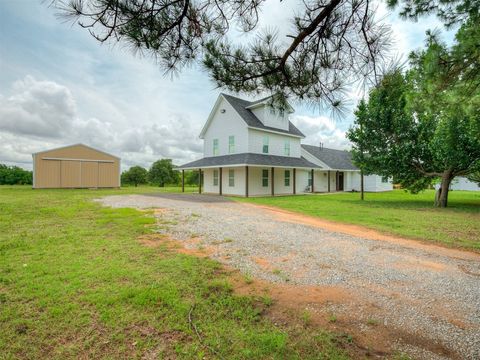
Active
$499,000
5
bds
|
2
ba
|
0
sqft
|
built
2012
4100 S Noma Rd, Oklahoma City, OK 73150
$-222
Cash flow
-2.3%
Cash-on-Cash Return
5.1%
Cap rate
0.6%
Rent to Value Ratio
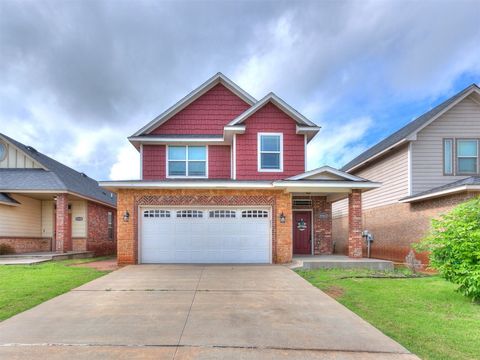
Pending
$375,000
2
bds
|
2
ba
|
0
sqft
|
built
2015
5608 NW 127th St, Oklahoma City, OK 73142
$-998
Cash flow
-13.9%
Cash-on-Cash Return
2.5%
Cap rate
0.5%
Rent to Value Ratio
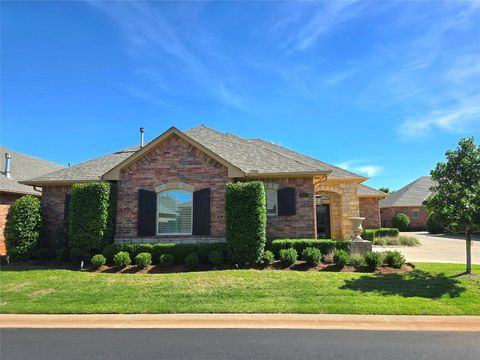
Active
$295,999
4
bds
|
2
ba
|
0
sqft
|
built
1989
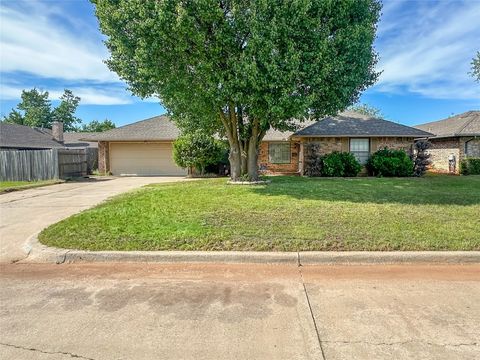
3130 SW 124th St, Oklahoma City, OK 73170
$-317
Cash flow
-5.6%
Cash-on-Cash Return
4.4%
Cap rate
0.6%
Rent to Value Ratio
Active
$379,544
3
bds
|
4
ba
|
0
sqft
|
built
1981
13501 Fox Hollow Rdg, Oklahoma City, OK 73131
$-330
Cash flow
-4.5%
Cash-on-Cash Return
4.6%
Cap rate
0.7%
Rent to Value Ratio
Active
$221,000
3
bds
|
2
ba
|
0
sqft
|
built
1953
4809 N Pate Ave, Oklahoma City, OK 73112
$-60
Cash flow
-1.4%
Cash-on-Cash Return
5.4%
Cap rate
0.7%
Rent to Value Ratio
Active
$835,000
3
bds
|
4
ba
|
0
sqft
|
built
2009
6509 NE 101st St, Oklahoma City, OK 73151
$-2,506
Cash flow
-15.7%
Cash-on-Cash Return
2.1%
Cap rate
0.4%
Rent to Value Ratio
Pending
$175,000
3
bds
|
2
ba
|
0
sqft
|
built
1958
3901 NW 56th Pl, Oklahoma City, OK 73112
$73
Cash flow
2.2%
Cash-on-Cash Return
6.2%
Cap rate
0.9%
Rent to Value Ratio
Active
$344,900
4
bds
|
3
ba
|
0
sqft
|
built
2017
8344 NW 137th St, Oklahoma City, OK 73142
$-373
Cash flow
-5.6%
Cash-on-Cash Return
4.4%
Cap rate
0.6%
Rent to Value Ratio
Active
$100,000
3
bds
|
1
ba
|
0
sqft
|
built
1950
1401 NE 37th St, Oklahoma City, OK 73111
$236
Cash flow
12.3%
Cash-on-Cash Return
8.5%
Cap rate
1.1%
Rent to Value Ratio
Active
$339,900
4
bds
|
2
ba
|
0
sqft
|
built
1986
6401 Saddleback Dr, Oklahoma City, OK 73150
$-502
Cash flow
-7.7%
Cash-on-Cash Return
3.9%
Cap rate
0.6%
Rent to Value Ratio
Active
$186,000
3
bds
|
2
ba
|
0
sqft
|
built
1979
812 NW 113th St, Oklahoma City, OK 73114
$-75
Cash flow
-2.1%
Cash-on-Cash Return
5.2%
Cap rate
0.7%
Rent to Value Ratio
Active
$239,000
4
bds
|
3
ba
|
0
sqft
|
built
1961
3501 SW 37th St, Oklahoma City, OK 73119
$-31
Cash flow
-0.7%
Cash-on-Cash Return
5.5%
Cap rate
0.7%
Rent to Value Ratio
Active
$350,000
3
bds
|
3
ba
|
0
sqft
|
built
2004
5608 Bent Creek Dr, Oklahoma City, OK 73135
$-555
Cash flow
-8.3%
Cash-on-Cash Return
3.8%
Cap rate
0.6%
Rent to Value Ratio
Active
$255,000
3
bds
|
2
ba
|
0
sqft
|
built
2021
9436 SW 37th St, Oklahoma City, OK 73179
$-323
Cash flow
-6.6%
Cash-on-Cash Return
4.2%
Cap rate
0.6%
Rent to Value Ratio
Active
$620,000
4
bds
|
3
ba
|
0
sqft
|
built
1971
11000 Magnolia Park, Oklahoma City, OK 73120
$-763
Cash flow
-6.4%
Cash-on-Cash Return
4.2%
Cap rate
0.6%
Rent to Value Ratio
Active
$349,000
3
bds
|
3
ba
|
0
sqft
|
built
2012
2900 Coventry Manor Dr, Oklahoma City, OK 73128
$-661
Cash flow
-9.9%
Cash-on-Cash Return
3.4%
Cap rate
0.5%
Rent to Value Ratio
Active
$329,999
4
bds
|
3
ba
|
0
sqft
|
built
1969
6001 Broadmoor Ave, Oklahoma City, OK 73132
$-188
Cash flow
-3.0%
Cash-on-Cash Return
5.0%
Cap rate
0.8%
Rent to Value Ratio

Active
$500,000
4
bds
|
6
ba
|
0
sqft
|
built
2022
1021 NE 18th St, Oklahoma City, OK 73111
$-779
Cash flow
-8.1%
Cash-on-Cash Return
3.8%
Cap rate
0.5%
Rent to Value Ratio
Active
$299,900
3
bds
|
2
ba
|
0
sqft
|
built
1998
12525 S Youngs Pl, Oklahoma City, OK 73170
$-311
Cash flow
-5.4%
Cash-on-Cash Return
4.4%
Cap rate
0.7%
Rent to Value Ratio
Active
$235,000
3
bds
|
3
ba
|
0
sqft
|
built
1972
5821 NW 89th St, Oklahoma City, OK 73132
$-99
Cash flow
-2.2%
Cash-on-Cash Return
5.2%
Cap rate
0.7%
Rent to Value Ratio

Active
$193,000
3
bds
|
2
ba
|
0
sqft
|
built
1981
5902 Fox Run Way, Oklahoma City, OK 73142
$-98
Cash flow
-2.6%
Cash-on-Cash Return
5.1%
Cap rate
0.7%
Rent to Value Ratio
Active
$420,000
4
bds
|
3
ba
|
0
sqft
|
built
1978
2208 Amber Rd, Oklahoma City, OK 73170
$-638
Cash flow
-7.9%
Cash-on-Cash Return
3.9%
Cap rate
0.7%
Rent to Value Ratio
Active
$215,000
4
bds
|
2
ba
|
0
sqft
|
built
1930
2022 NW 30th St, Oklahoma City, OK 73118
$-301
Cash flow
-7.3%
Cash-on-Cash Return
4.0%
Cap rate
0.5%
Rent to Value Ratio
Active
$250,000
3
bds
|
2
ba
|
0
sqft
|
built
1930
1535 NW 39th St, Oklahoma City, OK 73118
$-284
Cash flow
-5.9%
Cash-on-Cash Return
4.3%
Cap rate
0.6%
Rent to Value Ratio
Active
$209,000
3
bds
|
2
ba
|
0
sqft
|
built
1928
929 NE 21st St, Oklahoma City, OK 73105
$17
Cash flow
0.4%
Cash-on-Cash Return
5.8%
Cap rate
0.8%
Rent to Value Ratio
Active
$178,000
3
bds
|
2
ba
|
0
sqft
|
built
1952
2617 SW 43rd St, Oklahoma City, OK 73119
$78
Cash flow
2.3%
Cash-on-Cash Return
6.2%
Cap rate
0.8%
Rent to Value Ratio
Active
$5,900,000
4
bds
|
8
ba
|
0
sqft
|
built
2016
4400 NW 150th St, Oklahoma City, OK 73134
$-26,888
Cash flow
-23.8%
Cash-on-Cash Return
0.2%
Cap rate
0.1%
Rent to Value Ratio
Active
$230,000
4
bds
|
2
ba
|
0
sqft
|
built
1960
4308 NW 60th Pl, Oklahoma City, OK 73112
$-7
Cash flow
-0.2%
Cash-on-Cash Return
5.6%
Cap rate
0.8%
Rent to Value Ratio
Active
$234,900
3
bds
|
2
ba
|
0
sqft
|
built
2008
7909 Dawn Cir, Oklahoma City, OK 73135
$-199
Cash flow
-4.4%
Cash-on-Cash Return
4.7%
Cap rate
0.7%
Rent to Value Ratio
Active
$849,000
3
bds
|
3
ba
|
0
sqft
|
built
1935
915 NW 40th St, Oklahoma City, OK 73118
$-2,288
Cash flow
-14.1%
Cash-on-Cash Return
2.4%
Cap rate
0.4%
Rent to Value Ratio
Pending
$315,000
3
bds
|
2
ba
|
0
sqft
|
built
2014
17016 Barcelona Dr, Oklahoma City, OK 73170
$-422
Cash flow
-7.0%
Cash-on-Cash Return
4.1%
Cap rate
0.6%
Rent to Value Ratio
Active
$775,000
3
bds
|
3
ba
|
0
sqft
|
built
1958
1201 Westchester Dr, Oklahoma City, OK 73114
$-1,990
Cash flow
-13.4%
Cash-on-Cash Return
2.6%
Cap rate
0.4%
Rent to Value Ratio