Oklahoma City, OK Investment Properties for Sale
Browse homes for sale and investment properties in Oklahoma City, OK. Refine your search by price, property type, or more.
Best cash flowing properties in Oklahoma City, OK
Active
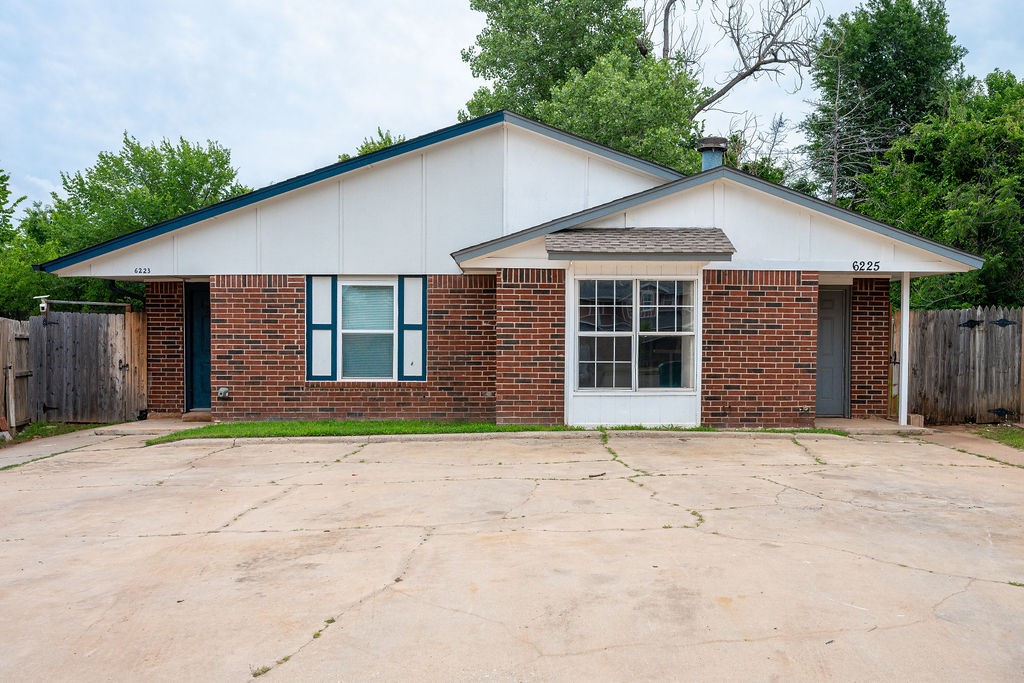
$95,000
2
bds
|
2
ba
|
0
sqft
|
built
1984
6225 SE 46th St, Oklahoma City, OK 73135
$210
Cash flow
11.5%
Cash-on-Cash Return
8.3%
Cap rate
1.2%
Rent to Value Ratio
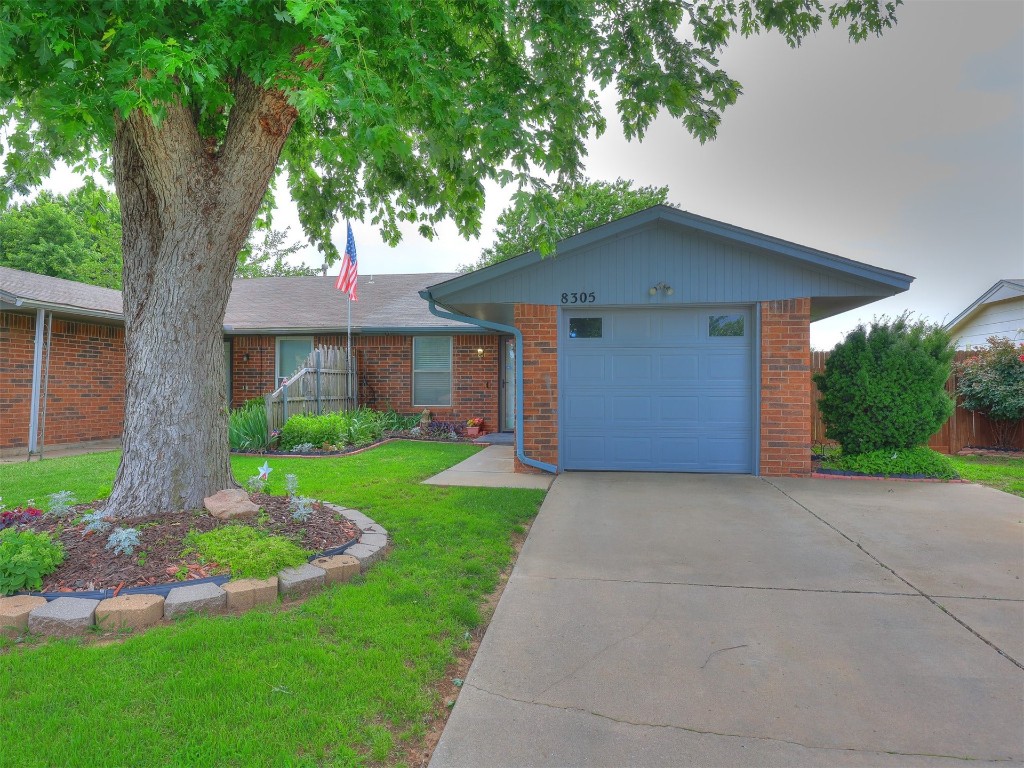
Pending
$131,000
2
bds
|
2
ba
|
0
sqft
|
built
1982
8305 S Brookline Pl, Oklahoma City, OK 73159
$194
Cash flow
7.7%
Cash-on-Cash Return
7.5%
Cap rate
1.0%
Rent to Value Ratio
67 out of 83 properties for sale in Oklahoma City, OK
Limited Results Shown
Create a free account, or log in to reveal all property listings and enjoy the complete experience.
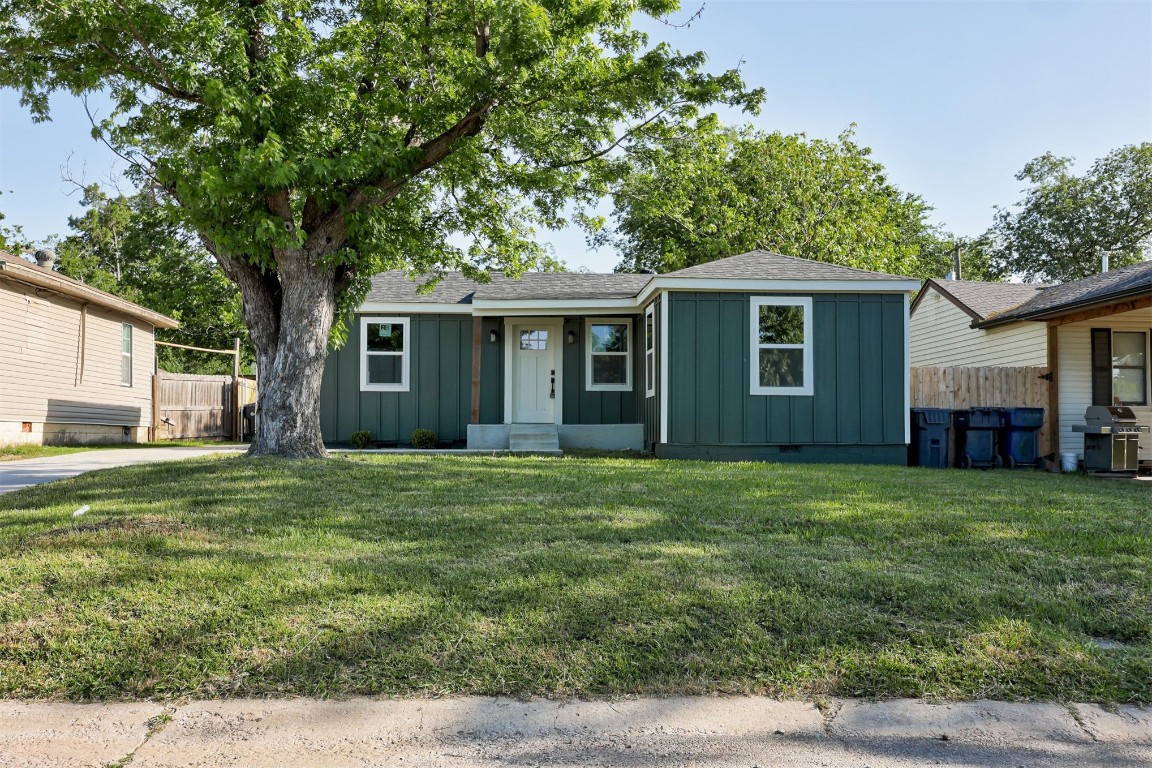
Active
$100,000
3
bds
|
3
ba
|
0
sqft
|
built
1940
2904 S Indiana Ave, Oklahoma City, OK 73108
$-96
Cash flow
-5.0%
Cash-on-Cash Return
4.5%
Cap rate
0.6%
Rent to Value Ratio
Active
$95,000
2
bds
|
2
ba
|
0
sqft
|
built
1984
6225 SE 46th St, Oklahoma City, OK 73135
$210
Cash flow
11.5%
Cash-on-Cash Return
8.3%
Cap rate
1.2%
Rent to Value Ratio
Active
$360,000
3
bds
|
2
ba
|
0
sqft
|
built
2007
1604 W Palm Pl, Oklahoma City, OK 73128
$-903
Cash flow
-13.1%
Cash-on-Cash Return
2.7%
Cap rate
0.4%
Rent to Value Ratio
Active
$400,000
3
bds
|
3
ba
|
0
sqft
|
built
1940
2310 N Francis Ave, Oklahoma City, OK 73106
$-821
Cash flow
-10.7%
Cash-on-Cash Return
3.2%
Cap rate
0.4%
Rent to Value Ratio
Active
$340,000
6
bds
|
5
ba
|
0
sqft
|
built
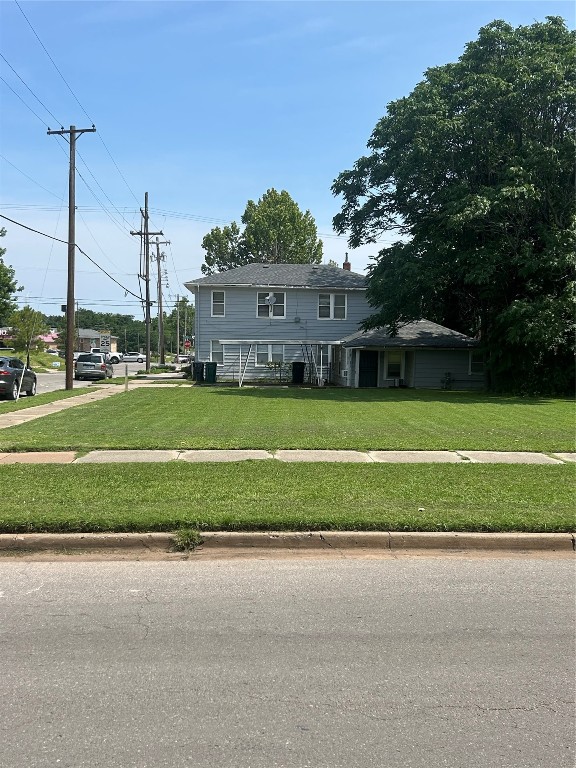
1984
11519 N Lincoln Blvd, Oklahoma City, OK 73114
$-542
Cash flow
-8.3%
Cash-on-Cash Return
3.8%
Cap rate
0.5%
Rent to Value Ratio
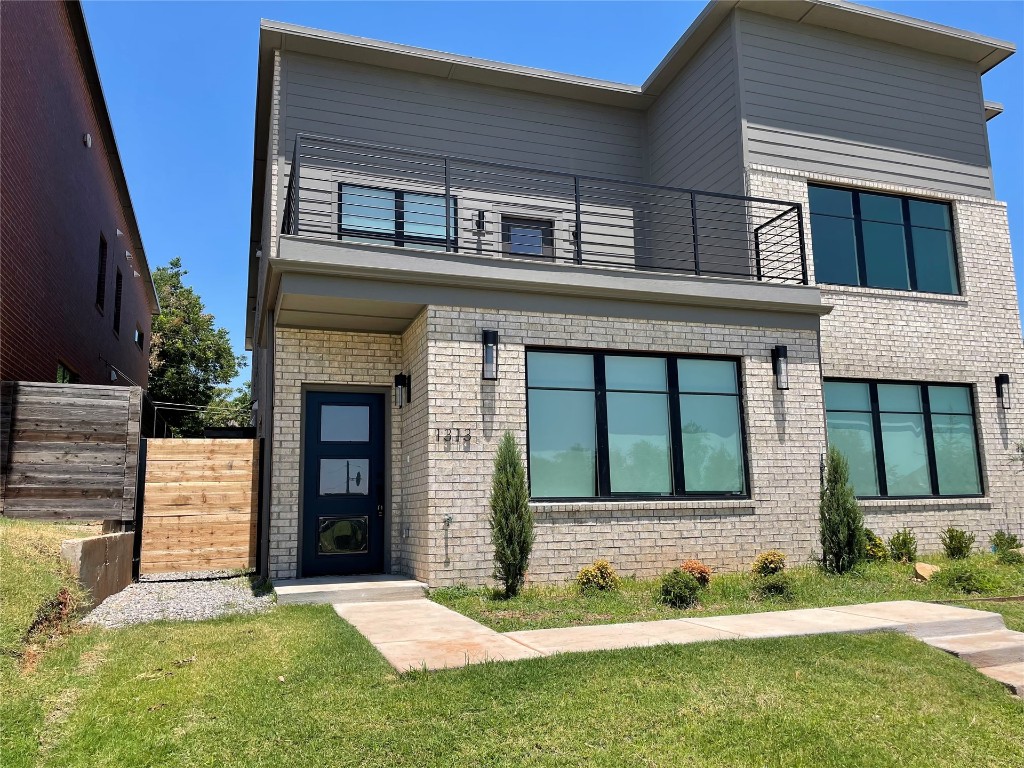
Active
$330,000
3
bds
|
3
ba
|
0
sqft
|
built
2022
1313 NE 6th St, Oklahoma City, OK 73117
$-874
Cash flow
-13.8%
Cash-on-Cash Return
2.5%
Cap rate
0.4%
Rent to Value Ratio
Pending
$131,000
2
bds
|
2
ba
|
0
sqft
|
built
1982
8305 S Brookline Pl, Oklahoma City, OK 73159
$194
Cash flow
7.7%
Cash-on-Cash Return
7.5%
Cap rate
1.0%
Rent to Value Ratio
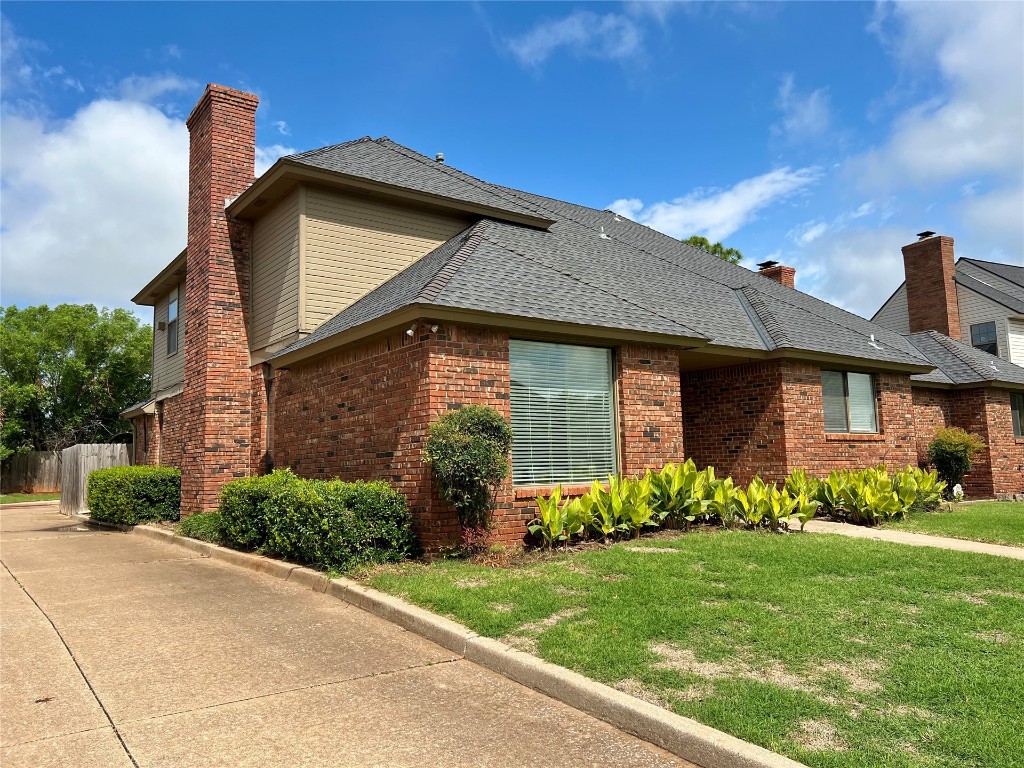
Active
$289,000
3
bds
|
2
ba
|
0
sqft
|
built
1982
11921 Shady Trail Ln, Oklahoma City, OK 73120
$-461
Cash flow
-8.3%
Cash-on-Cash Return
3.8%
Cap rate
0.6%
Rent to Value Ratio
Active
$485,000
5
bds
|
4
ba
|
0
sqft
|
built
1927
2400 NW 21st St, Oklahoma City, OK 73107
$-1,561
Cash flow
-16.8%
Cash-on-Cash Return
1.8%
Cap rate
0.3%
Rent to Value Ratio

Active
$254,000
2
bds
|
2
ba
|
0
sqft
|
built
1925
1531 NW 28th St, Oklahoma City, OK 73106
$-470
Cash flow
-9.7%
Cash-on-Cash Return
3.5%
Cap rate
0.5%
Rent to Value Ratio
Active
$910,000
8
bds
|
8
ba
|
0
sqft
|
built
2021
1138 N Blackwelder Ave, Oklahoma City, OK 73106
$-3,522
Cash flow
-20.2%
Cash-on-Cash Return
1.0%
Cap rate
0.2%
Rent to Value Ratio
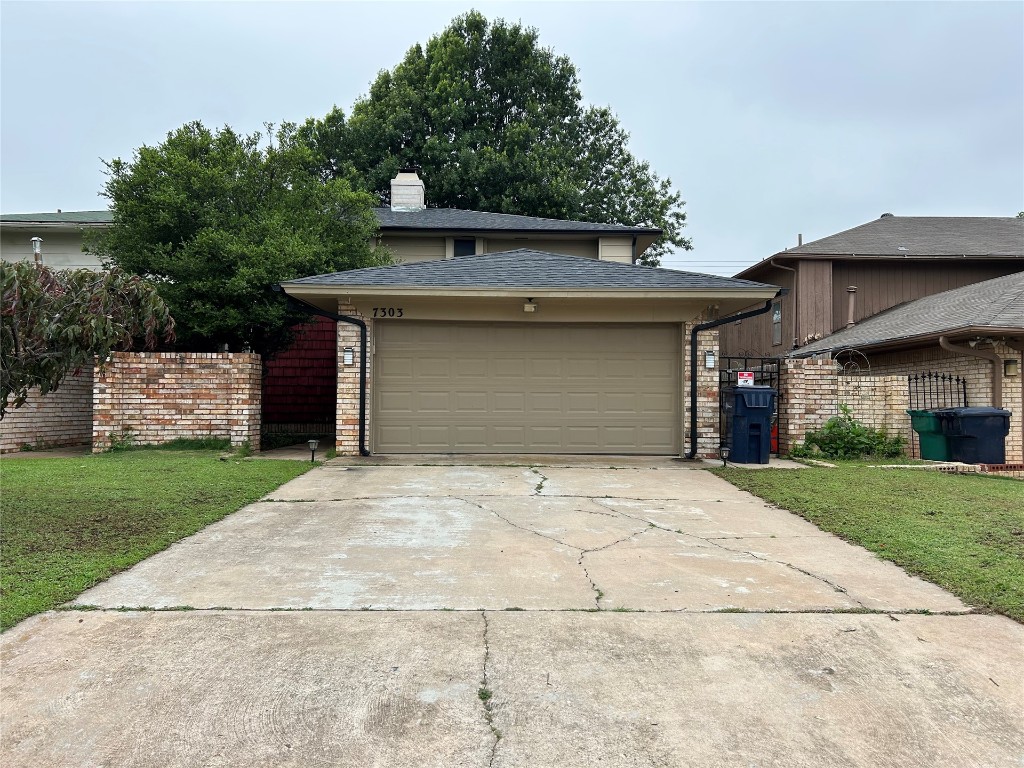
Active
$160,000
2
bds
|
3
ba
|
0
sqft
|
built
1973
7303 Edenborough Dr, Oklahoma City, OK 73132
$104
Cash flow
3.4%
Cash-on-Cash Return
6.5%
Cap rate
0.9%
Rent to Value Ratio
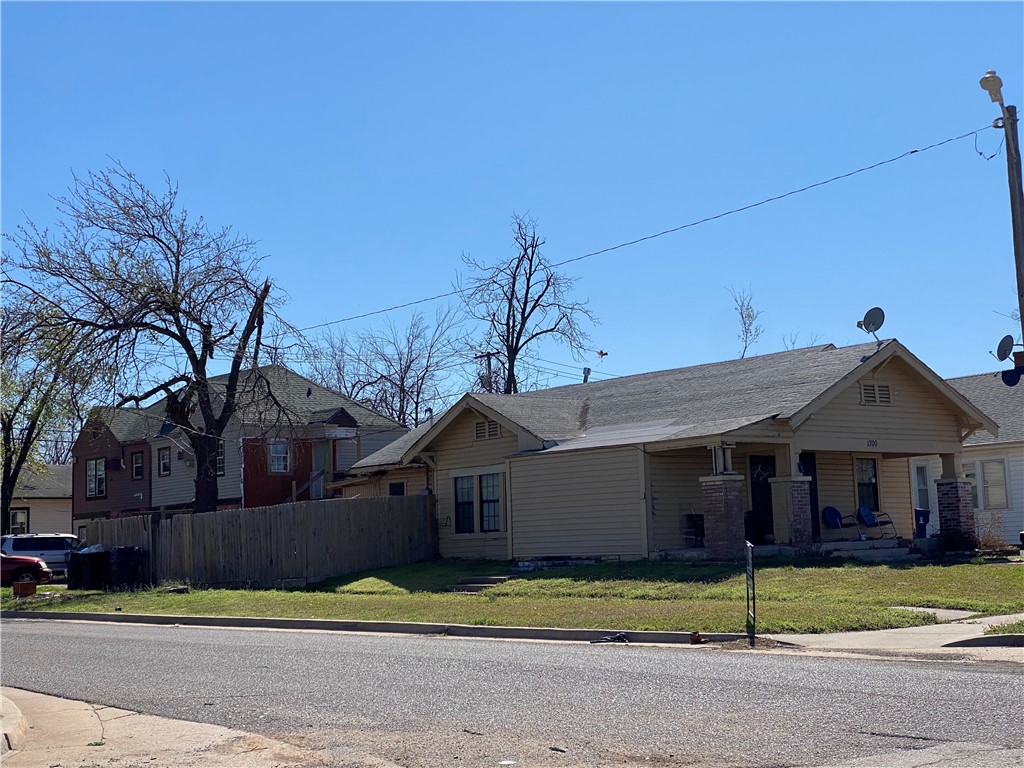
Active
$375,000
3
bds
|
5
ba
|
0
sqft
|
built
1920
1700 NW 19th St, Oklahoma City, OK 73106
$-934
Cash flow
-13.0%
Cash-on-Cash Return
2.7%
Cap rate
0.5%
Rent to Value Ratio
Active
$395,000
4
bds
|
2
ba
|
0
sqft
|
built
1920
1502 NW 39th St, Oklahoma City, OK 73118
$-918
Cash flow
-12.1%
Cash-on-Cash Return
2.9%
Cap rate
0.4%
Rent to Value Ratio
Active
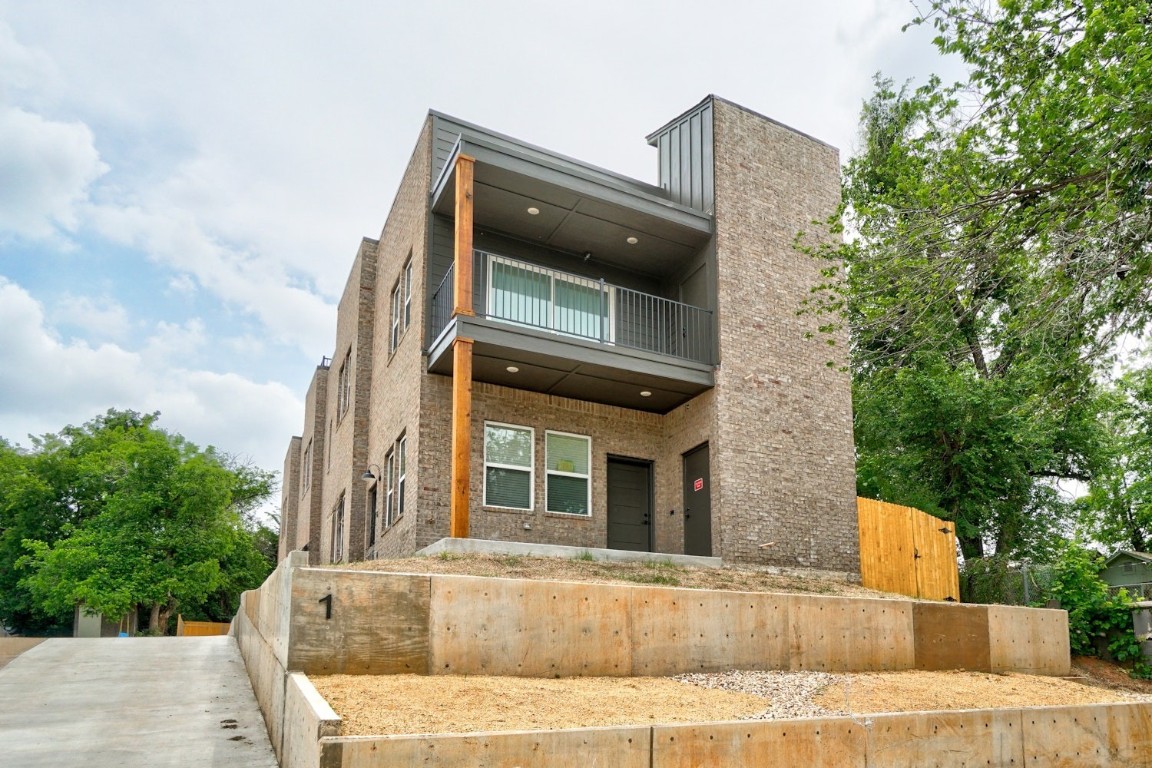
$500,000
4
bds
|
6
ba
|
0
sqft
|
built
2022
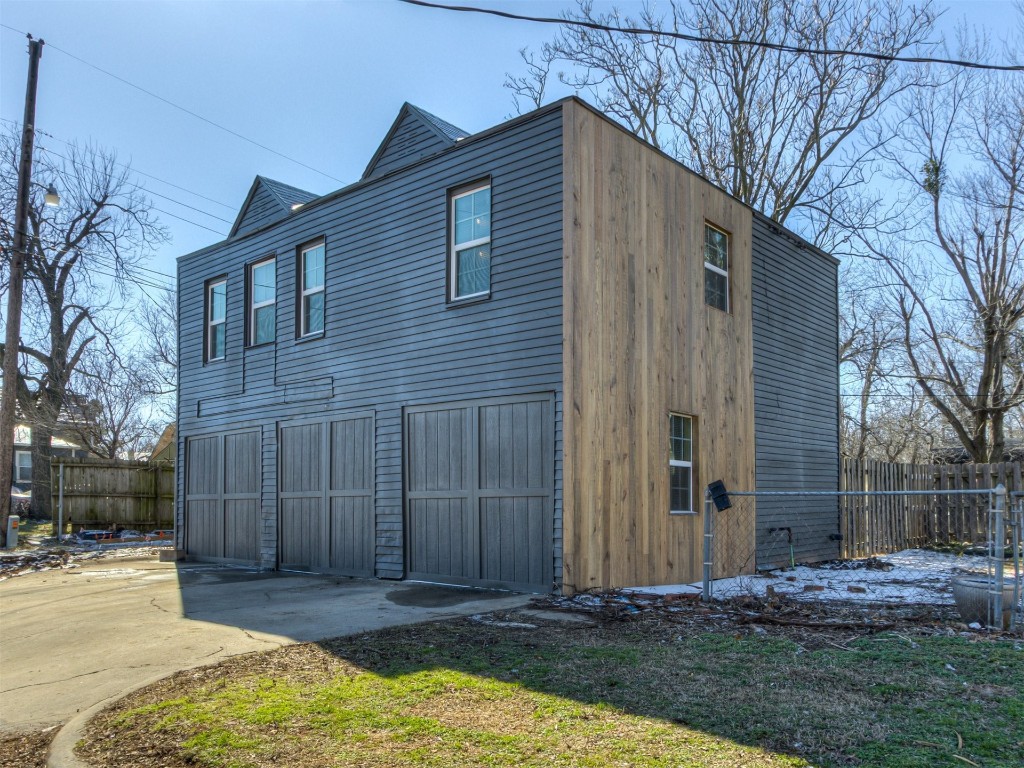
1021 NE 18th St, Oklahoma City, OK 73111
$-779
Cash flow
-8.1%
Cash-on-Cash Return
3.8%
Cap rate
0.5%
Rent to Value Ratio
Active
$199,000
3
bds
|
2
ba
|
0
sqft
|
built
1981
5902 Fox Run Way, Oklahoma City, OK 73142
$-127
Cash flow
-3.3%
Cash-on-Cash Return
4.9%
Cap rate
0.7%
Rent to Value Ratio
Active
$140,000
2
bds
|
2
ba
|
0
sqft
|
built
1982
1202 SW 77th Ter, Oklahoma City, OK 73139
$10
Cash flow
0.4%
Cash-on-Cash Return
5.8%
Cap rate
0.8%
Rent to Value Ratio
Active
$292,500
4
bds
|
4
ba
|
0
sqft
|
built
1981
7909 Harvest Moon Rd, Oklahoma City, OK 73132
$-514
Cash flow
-9.2%
Cash-on-Cash Return
3.6%
Cap rate
0.5%
Rent to Value Ratio
Active
$292,500
4
bds
|
2
ba
|
0
sqft
|
built
1982
7905 Debar Cir, Oklahoma City, OK 73132
$-510
Cash flow
-9.1%
Cash-on-Cash Return
3.6%
Cap rate
0.5%
Rent to Value Ratio
Active
$292,500
4
bds
|
4
ba
|
0
sqft
|
built
1982
7903 Debar Cir, Oklahoma City, OK 73132
$-519
Cash flow
-9.3%
Cash-on-Cash Return
3.5%
Cap rate
0.5%
Rent to Value Ratio
Active
$292,500
4
bds
|
4
ba
|
0
sqft
|
built
1981
7913 Harvest Moon Rd, Oklahoma City, OK 73132
$-516
Cash flow
-9.2%
Cash-on-Cash Return
3.6%
Cap rate
0.5%
Rent to Value Ratio

Active
$292,500
4
bds
|
4
ba
|
0
sqft
|
built
1982
7905 Harvest Moon Rd, Oklahoma City, OK 73132
$-521
Cash flow
-9.3%
Cash-on-Cash Return
3.5%
Cap rate
0.5%
Rent to Value Ratio
Active
$259,900
4
bds
|
2
ba
|
0
sqft
|
built
1950
737 NW 89th St, Oklahoma City, OK 73114
$-522
Cash flow
-10.5%
Cash-on-Cash Return
3.3%
Cap rate
0.5%
Rent to Value Ratio
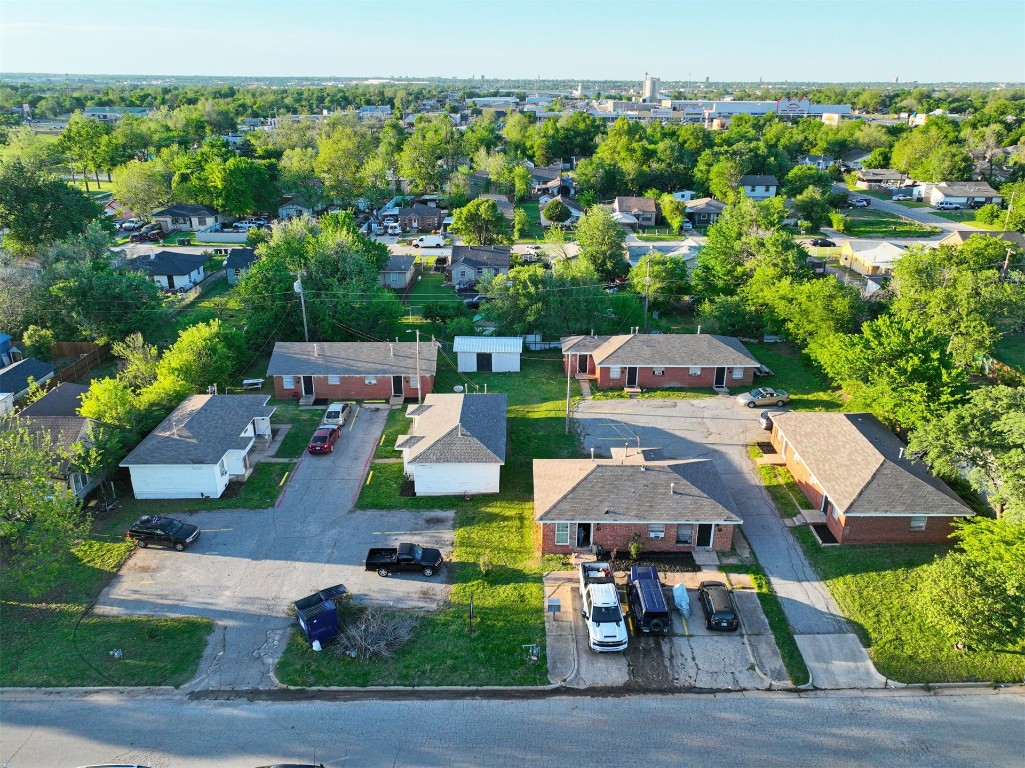
Active
$805,000
15
bds
|
12
ba
|
0
sqft
|
built
1955
2819 SW 33rd St, Oklahoma City, OK 73119
$-2,891
Cash flow
-18.7%
Cash-on-Cash Return
1.4%
Cap rate
0.2%
Rent to Value Ratio
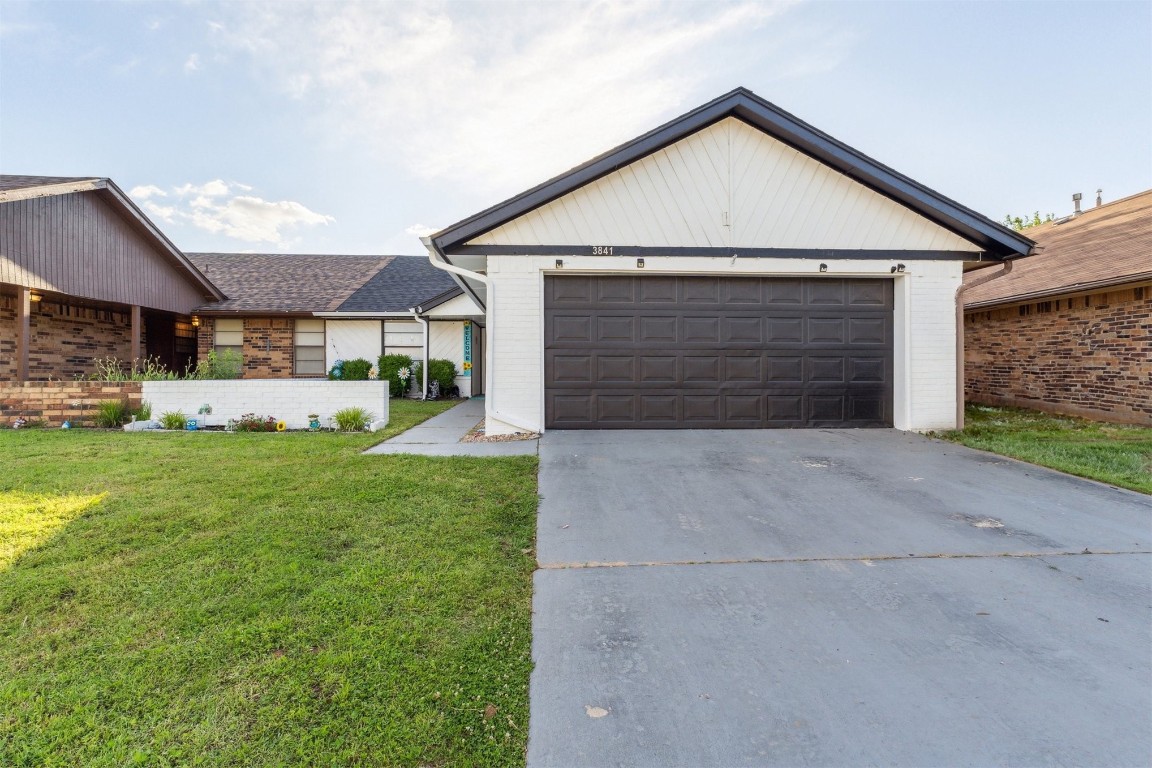
Active
$162,500
2
bds
|
2
ba
|
0
sqft
|
built
1983
3841 Southwind Ave, Oklahoma City, OK 73179
$81
Cash flow
2.6%
Cash-on-Cash Return
6.3%
Cap rate
0.9%
Rent to Value Ratio
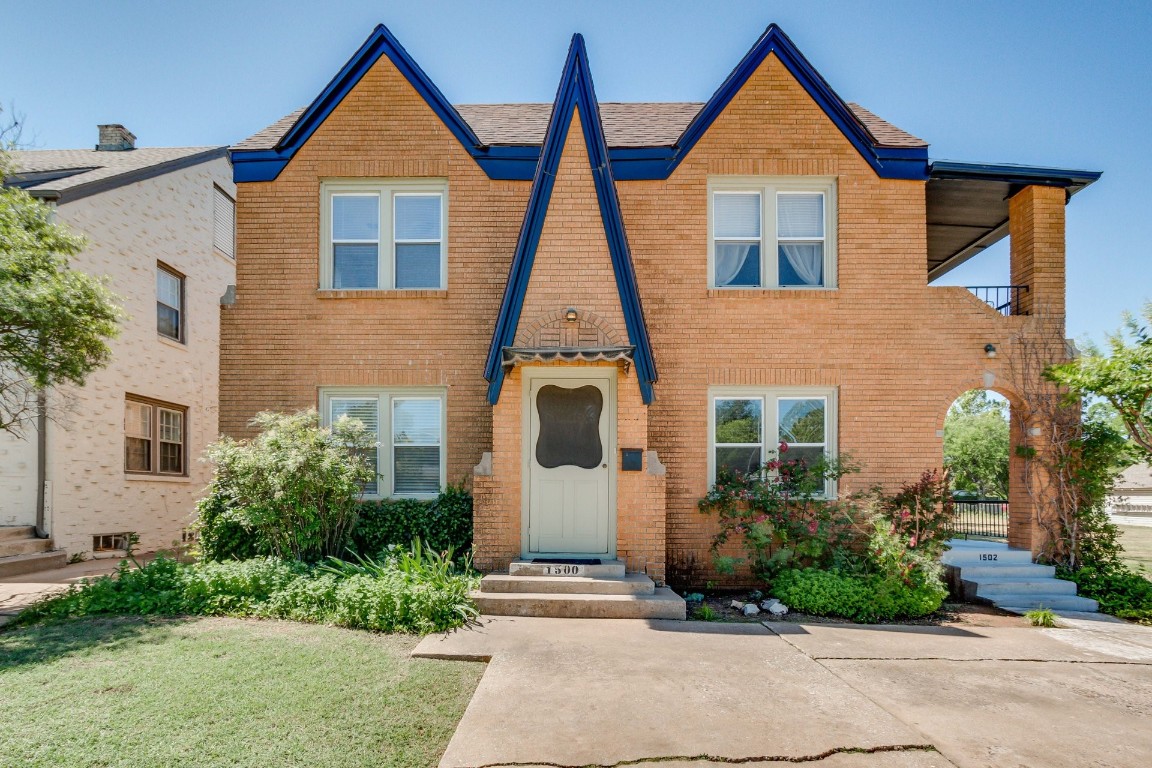
Active
$355,000
4
bds
|
4
ba
|
0
sqft
|
built
1930
1500 N Drexel Blvd, Oklahoma City, OK 73107
$-1,042
Cash flow
-15.3%
Cash-on-Cash Return
2.2%
Cap rate
0.4%
Rent to Value Ratio
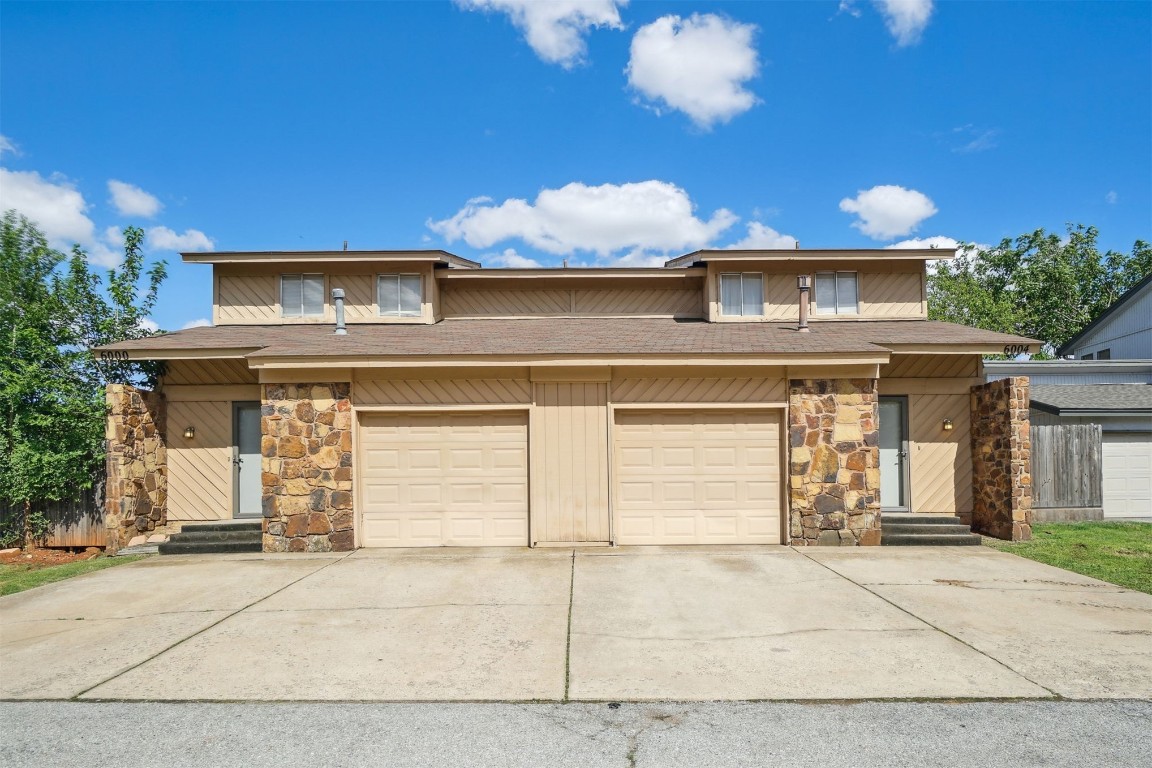
Active
$299,900
2
bds
|
2
ba
|
0
sqft
|
built
1979
6000 W Hefner Rd, Oklahoma City, OK 73162
$-533
Cash flow
-9.3%
Cash-on-Cash Return
3.5%
Cap rate
0.5%
Rent to Value Ratio
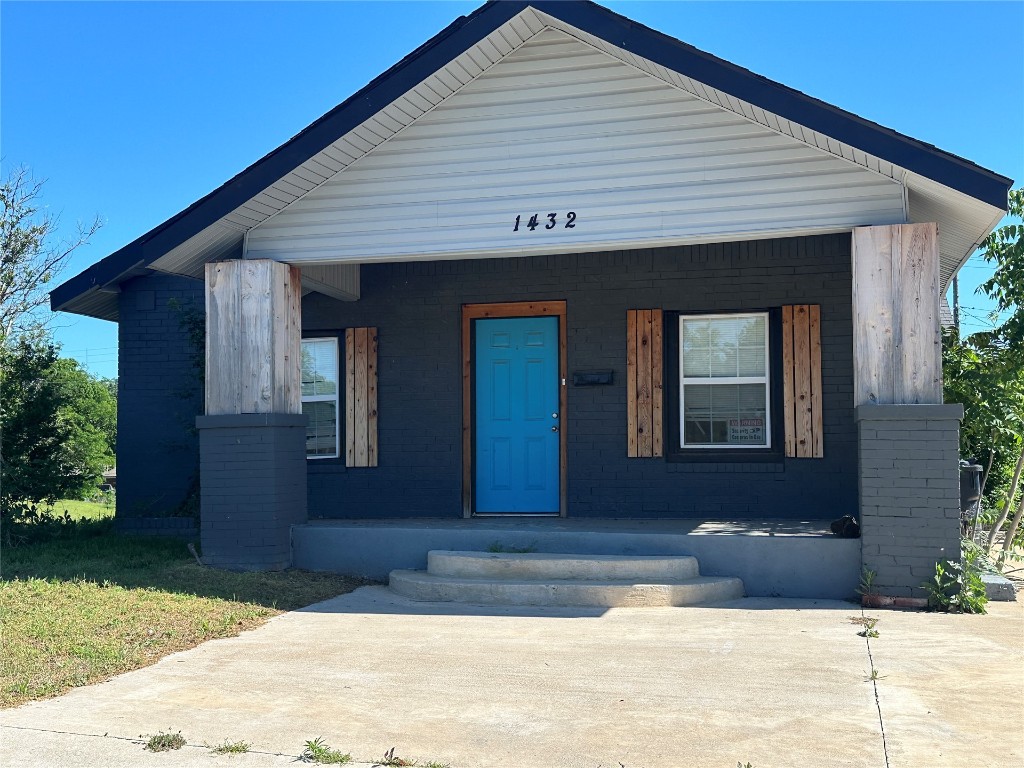
Active
$182,500
4
bds
|
2
ba
|
0
sqft
|
built
1930
1432 NE 12th St, Oklahoma City, OK 73117
$42
Cash flow
1.2%
Cash-on-Cash Return
6.0%
Cap rate
0.9%
Rent to Value Ratio
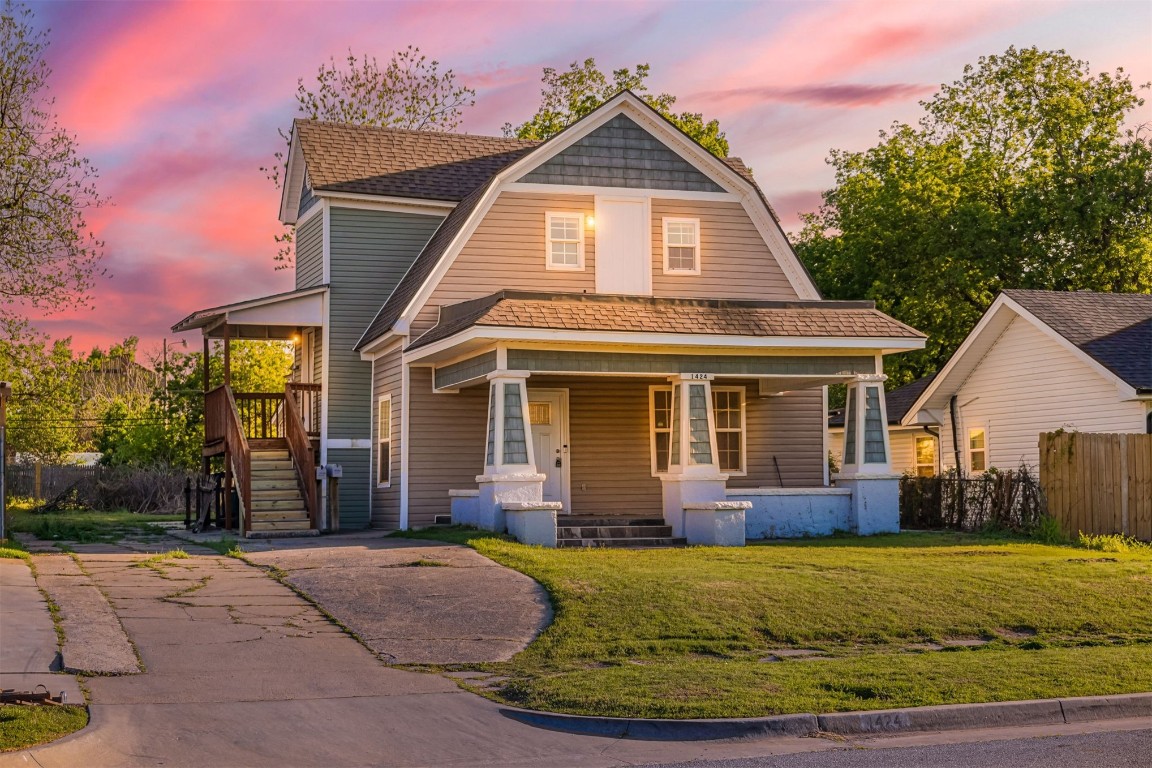
Active
$275,000
3
bds
|
3
ba
|
0
sqft
|
built
1905
1424 NW 33rd St, Oklahoma City, OK 73118
$-511
Cash flow
-9.7%
Cash-on-Cash Return
3.4%
Cap rate
0.5%
Rent to Value Ratio
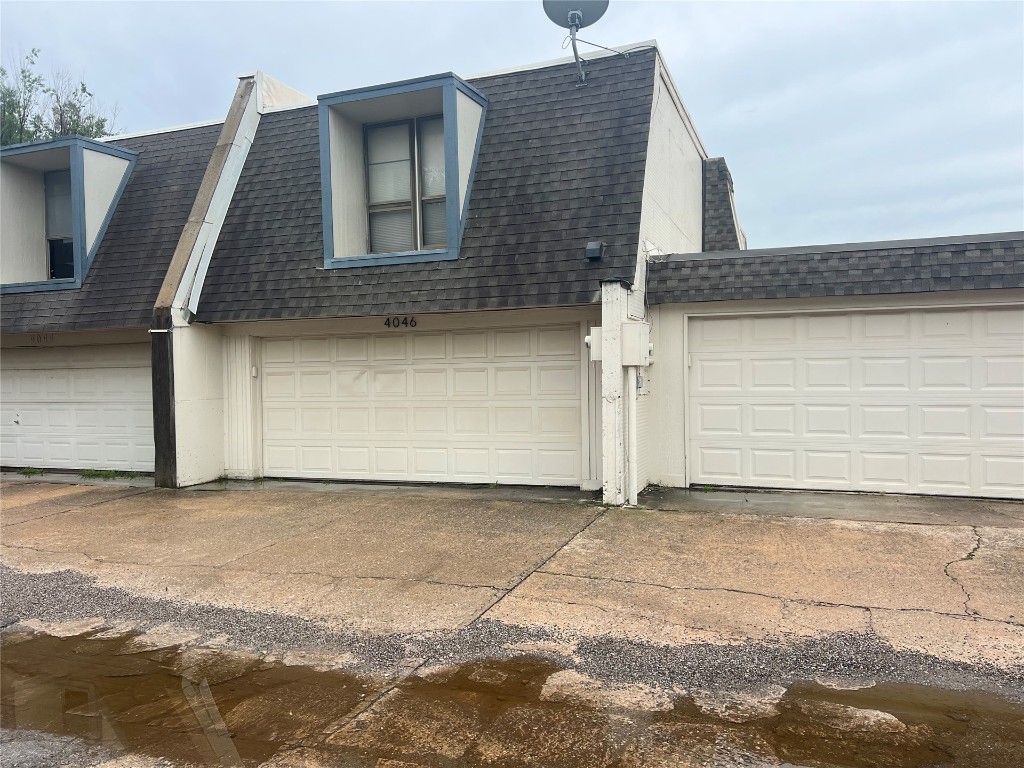
Active
$145,900
3
bds
|
3
ba
|
0
sqft
|
built
1973
4046 NW 36th St, Oklahoma City, OK 73112
$-6
Cash flow
-0.2%
Cash-on-Cash Return
5.6%
Cap rate
1.0%
Rent to Value Ratio
Active
$610,000
8
bds
|
8
ba
|
0
sqft
|
built
1933
1818 NW 29th St, Oklahoma City, OK 73106
$-1,766
Cash flow
-15.1%
Cash-on-Cash Return
2.2%
Cap rate
0.3%
Rent to Value Ratio
Active
$805,000
22
bds
|
11
ba
|
0
sqft
|
built
1950
3204 S Portland Ave, Oklahoma City, OK 73119
$-3,090
Cash flow
-20.0%
Cash-on-Cash Return
1.1%
Cap rate
0.2%
Rent to Value Ratio
Active
$499,995
4
bds
|
2
ba
|
0
sqft
|
built
1928
719 NE 17th St, Oklahoma City, OK 73105
$-1,395
Cash flow
-14.6%
Cash-on-Cash Return
2.3%
Cap rate
0.4%
Rent to Value Ratio
Active
$339,900
8
bds
|
6
ba
|
0
sqft
|
built
1979
528 Westwood Ct, Oklahoma City, OK 73127
$-836
Cash flow
-12.8%
Cash-on-Cash Return
2.7%
Cap rate
0.4%
Rent to Value Ratio
Active
$399,000
9
bds
|
5
ba
|
0
sqft
|
built
1930
1201 NW 9th St, Oklahoma City, OK 73106
$-1,075
Cash flow
-14.1%
Cash-on-Cash Return
2.4%
Cap rate
0.5%
Rent to Value Ratio
Active
$190,000
5
bds
|
3
ba
|
0
sqft
|
built
1924
1613 E Park Pl, Oklahoma City, OK 73117
$168
Cash flow
4.6%
Cash-on-Cash Return
6.7%
Cap rate
0.8%
Rent to Value Ratio

Active
$399,000
6
bds
|
6
ba
|
0
sqft
|
built
1972
6804 Lancer Ln, Oklahoma City, OK 73132
$-1,097
Cash flow
-14.3%
Cash-on-Cash Return
2.4%
Cap rate
0.4%
Rent to Value Ratio
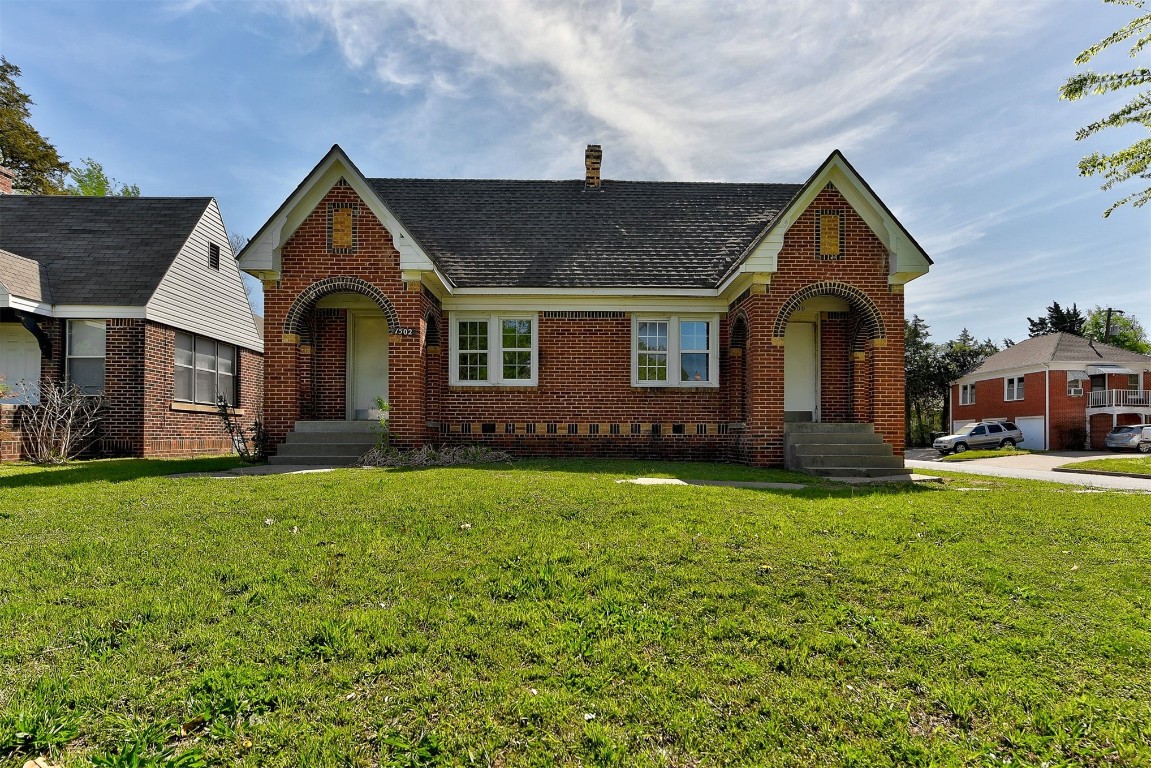
Active
$475,000
6
bds
|
3
ba
|
0
sqft
|
built
1930
2110 N Kelley Ave, Oklahoma City, OK 73111
$-1,144
Cash flow
-12.6%
Cash-on-Cash Return
2.8%
Cap rate
0.3%
Rent to Value Ratio
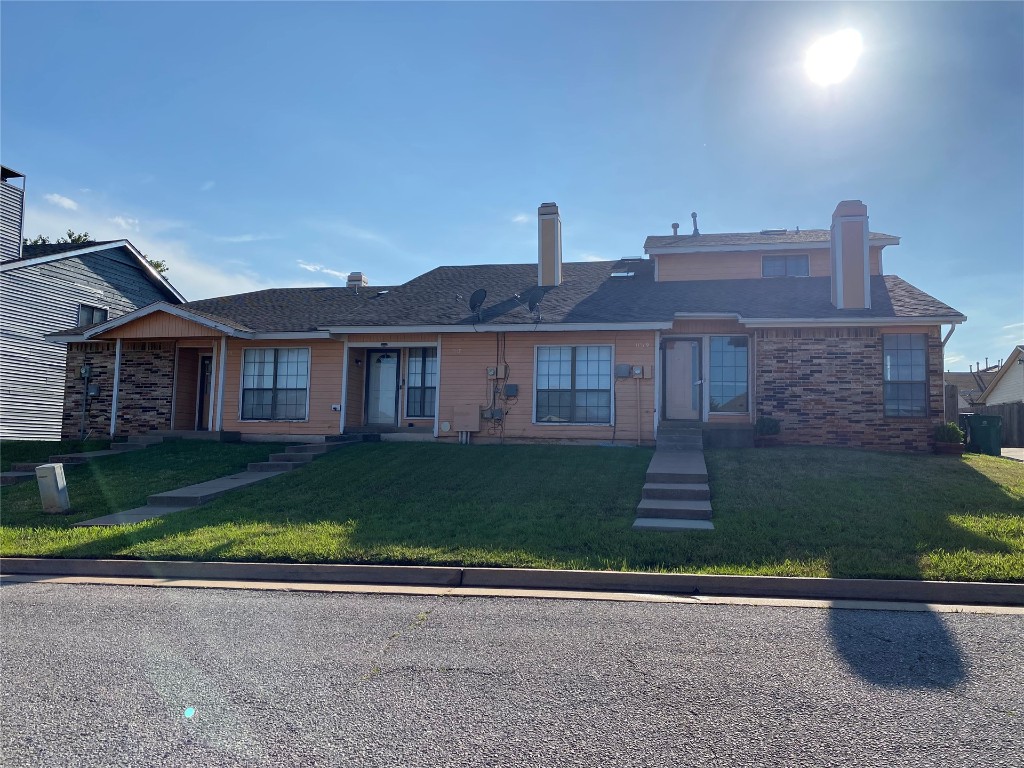
Pending
$295,000
5
bds
|
4
ba
|
0
sqft
|
built
1984
11400 N Lincoln Blvd, Oklahoma City, OK 73114
$-499
Cash flow
-8.8%
Cash-on-Cash Return
3.6%
Cap rate
0.4%
Rent to Value Ratio
Active
$399,000
6
bds
|
6
ba
|
0
sqft
|
built
1983
6101 Gaelic Glen Dr, Oklahoma City, OK 73142
$-784
Cash flow
-10.3%
Cash-on-Cash Return
3.3%
Cap rate
0.4%
Rent to Value Ratio