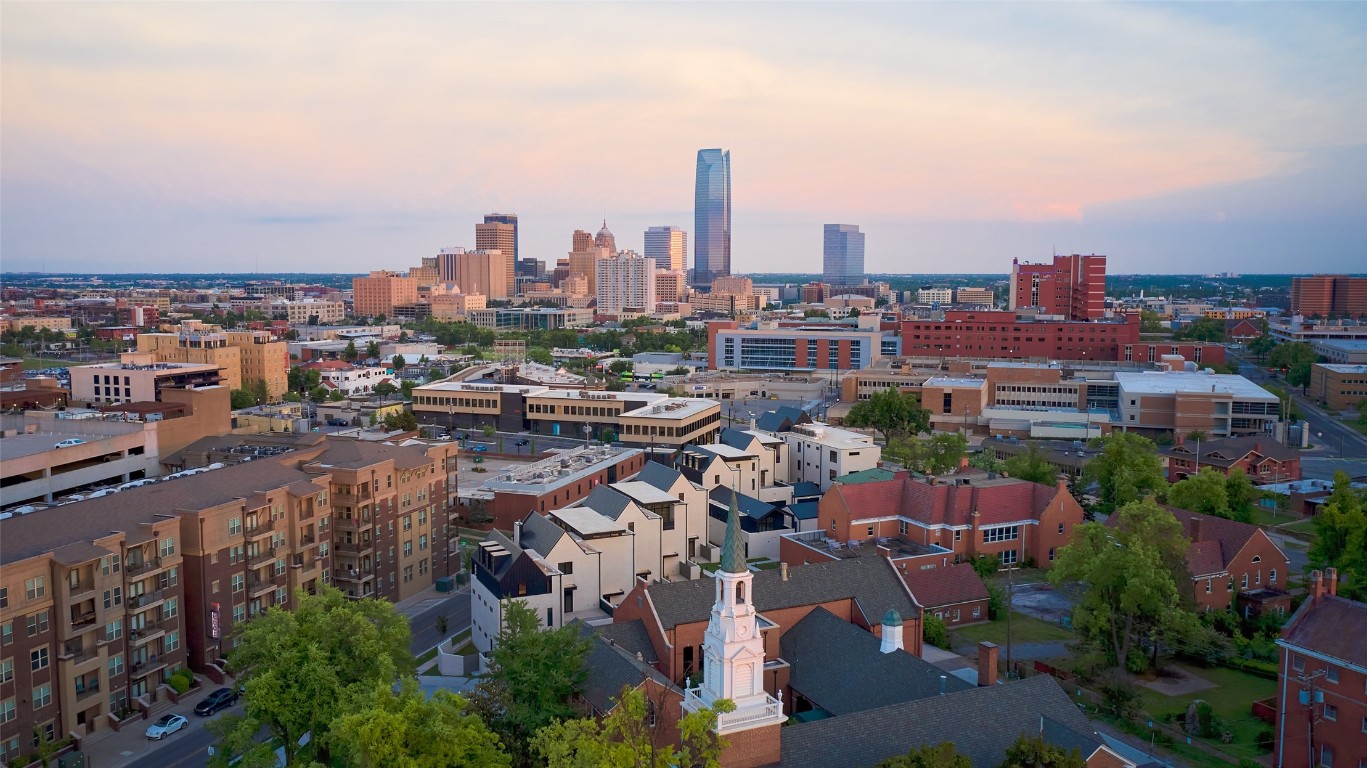
Oklahoma City, OK Investment Properties for Sale
Browse homes for sale and investment properties in Oklahoma City, OK. Refine your search by price, property type, or more.
Best cash flowing properties in Oklahoma City, OK
Active
$99,000
2
bds
|
2
ba
|
0
sqft
|
built
1983
7501 S Sherwood Ave, Oklahoma City, OK 73159
$503
Cash flow
26.5%
Cash-on-Cash Return
11.8%
Cap rate
1.6%
Rent to Value Ratio
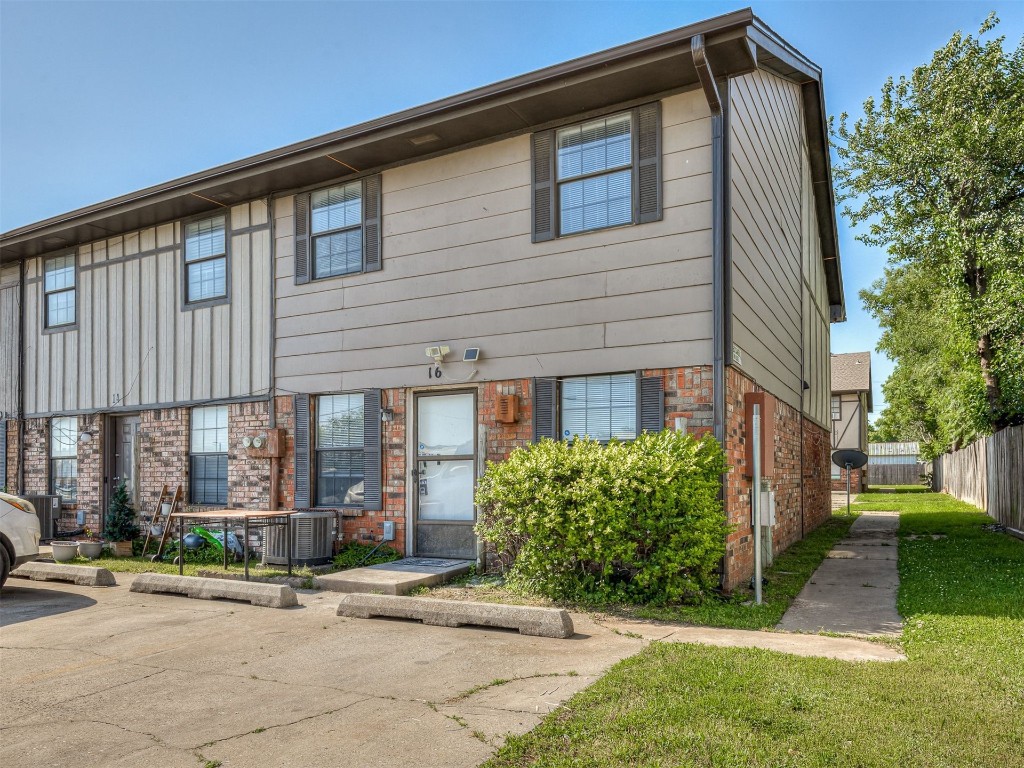
Pending
$115,000
2
bds
|
3
ba
|
0
sqft
|
built
1984
10613 White Oak Canyon Rd, Oklahoma City, OK 73162
$284
Cash flow
12.9%
Cash-on-Cash Return
8.6%
Cap rate
1.2%
Rent to Value Ratio
41 out of 45 properties for sale in Oklahoma City, OK
Limited Results Shown
Create a free account, or log in to reveal all property listings and enjoy the complete experience.
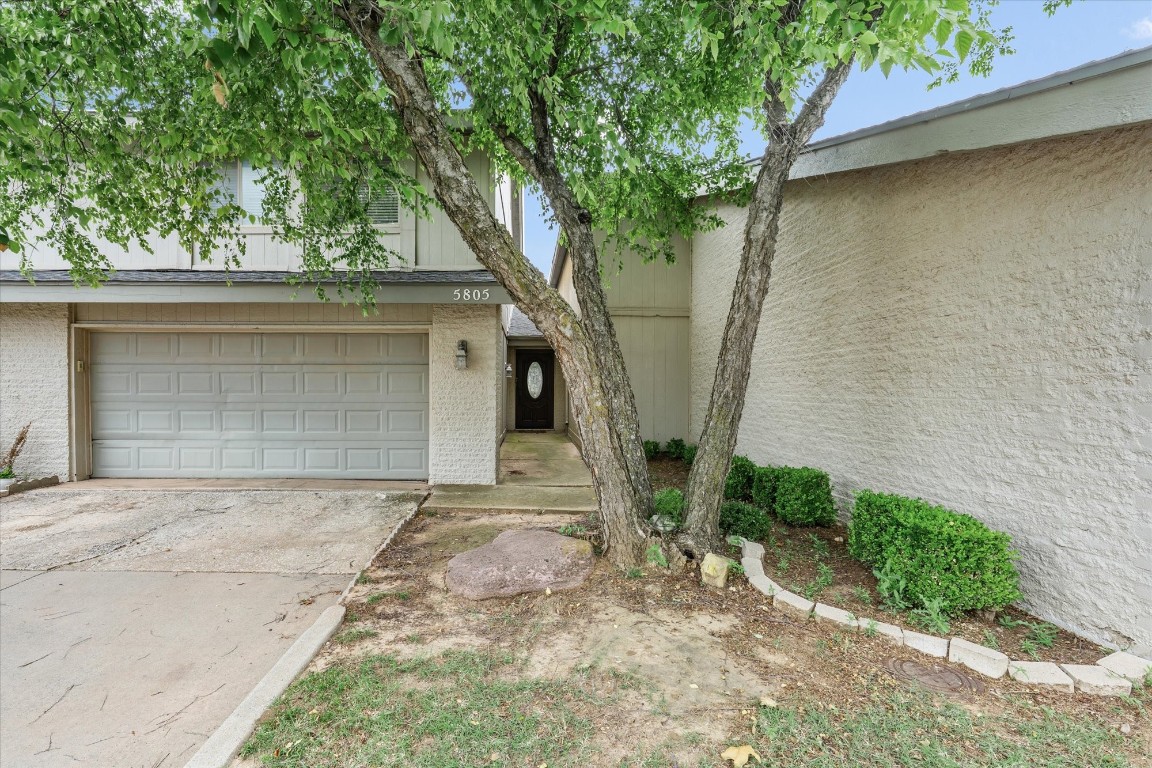
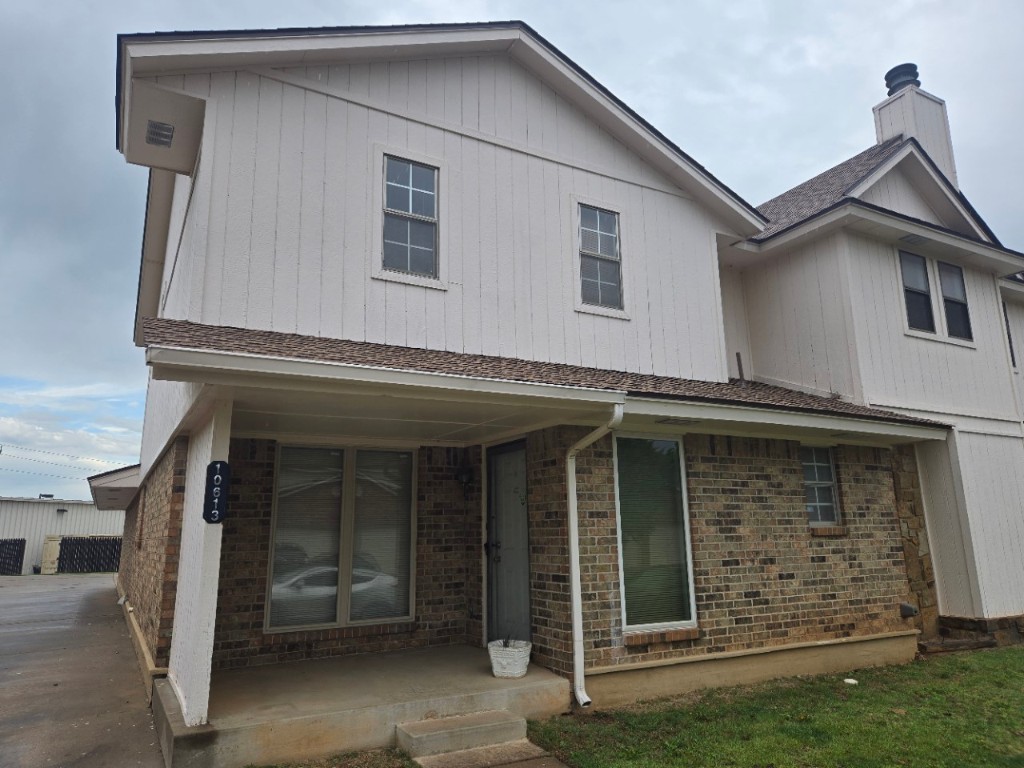
Active
$187,900
2
bds
|
3
ba
|
0
sqft
|
built
1975
5805 Hefner Village Ct, Oklahoma City, OK 73162
$-215
Cash flow
-6.0%
Cash-on-Cash Return
4.3%
Cap rate
0.9%
Rent to Value Ratio
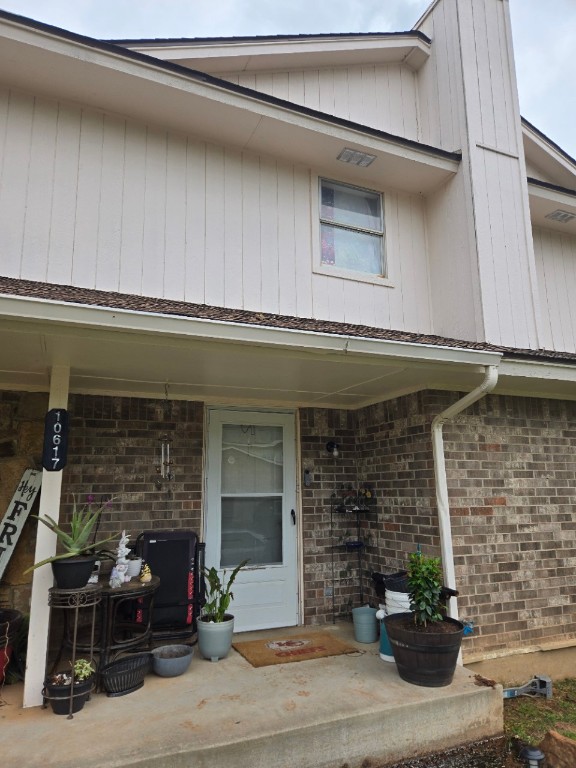
Pending
$163,000
2
bds
|
3
ba
|
0
sqft
|
built
1984
10617 White Oak Canyon Rd, Oklahoma City, OK 73162
$55
Cash flow
1.8%
Cash-on-Cash Return
6.1%
Cap rate
0.9%
Rent to Value Ratio
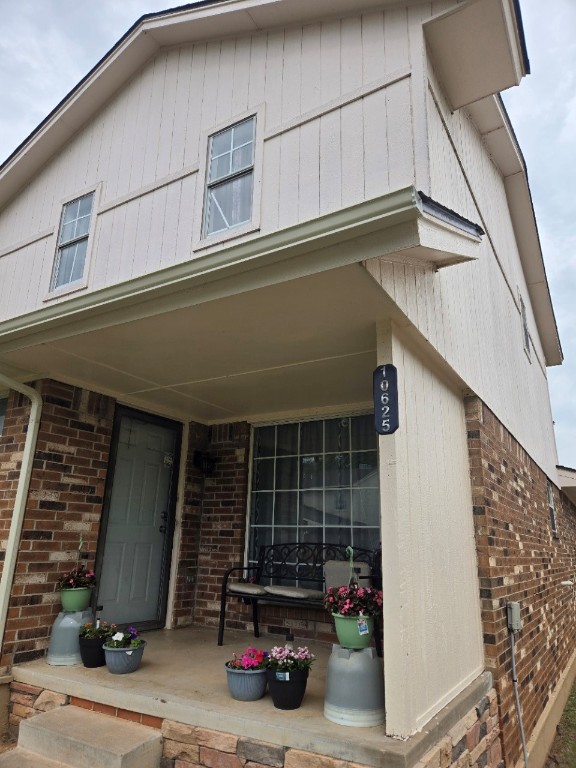
Pending
$150,000
2
bds
|
3
ba
|
0
sqft
|
built
1984
10625 White Oak Canyon Rd, Oklahoma City, OK 73162
$118
Cash flow
4.1%
Cash-on-Cash Return
6.6%
Cap rate
0.9%
Rent to Value Ratio
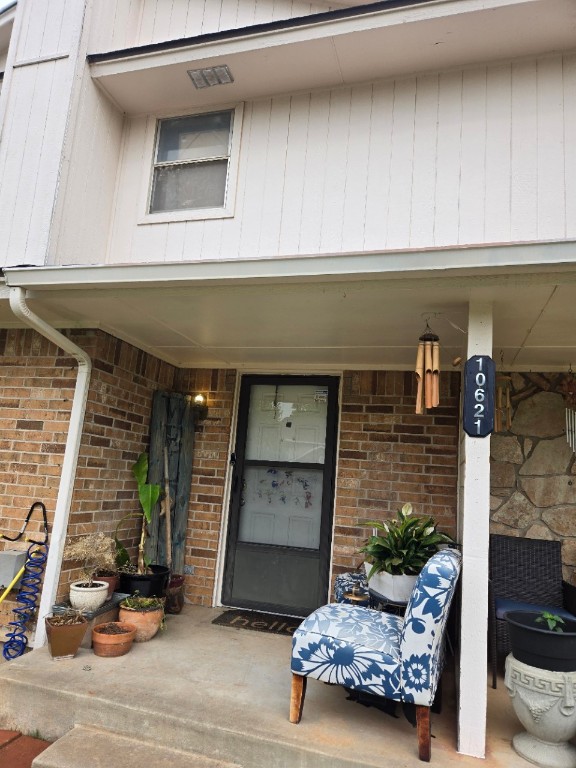
Pending
$150,000
2
bds
|
3
ba
|
0
sqft
|
built
1984
10621 White Oak Canyon Rd, Oklahoma City, OK 73162
$116
Cash flow
4.0%
Cash-on-Cash Return
6.6%
Cap rate
0.9%
Rent to Value Ratio
Pending
$115,000
2
bds
|
3
ba
|
0
sqft
|
built
1984
10613 White Oak Canyon Rd, Oklahoma City, OK 73162
$284
Cash flow
12.9%
Cash-on-Cash Return
8.6%
Cap rate
1.2%
Rent to Value Ratio
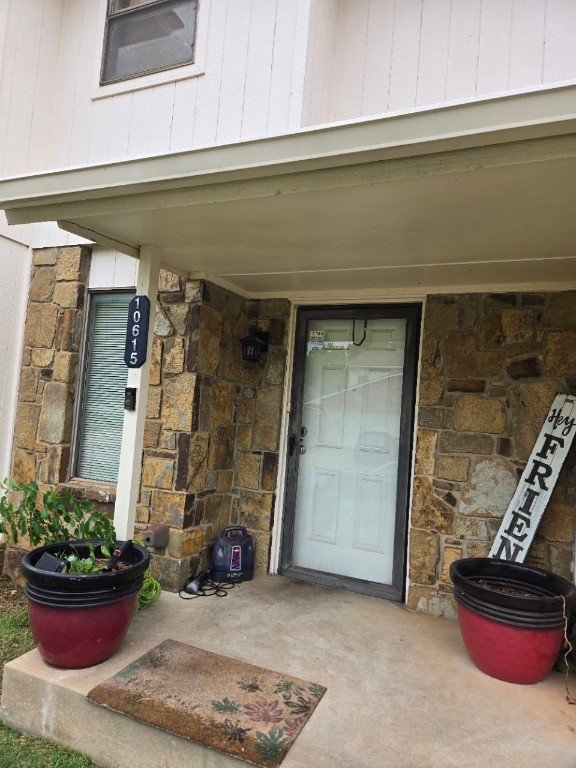
Pending
$148,500
3
bds
|
3
ba
|
0
sqft
|
built
1984
10615 White Oak Canyon Rd, Oklahoma City, OK 73162
$123
Cash flow
4.3%
Cash-on-Cash Return
6.7%
Cap rate
0.9%
Rent to Value Ratio
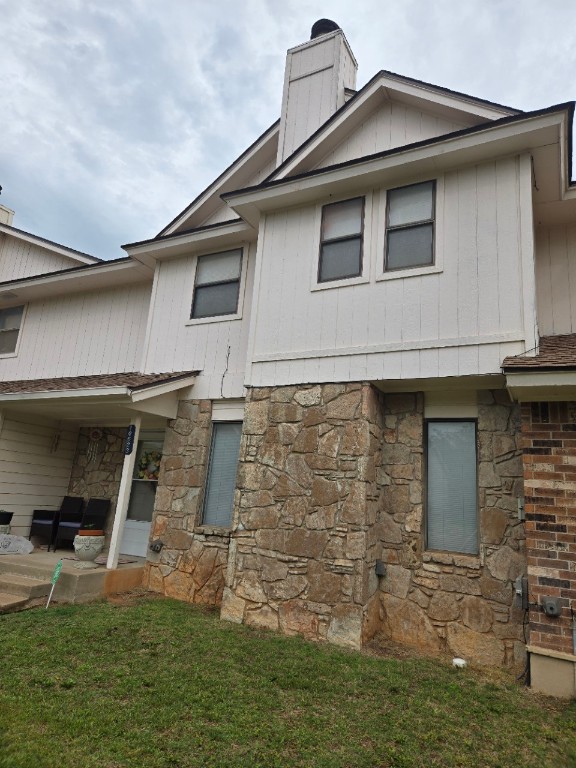
Pending
$148,500
3
bds
|
3
ba
|
0
sqft
|
built
1984
10623 White Oak Canyon Rd, Oklahoma City, OK 73162
$123
Cash flow
4.3%
Cash-on-Cash Return
6.7%
Cap rate
0.9%
Rent to Value Ratio
Active
$155,000
3
bds
|
2
ba
|
0
sqft
|
built
1979
6414 Galaxie Ter, Oklahoma City, OK 73132
$-278
Cash flow
-9.4%
Cash-on-Cash Return
3.5%
Cap rate
0.8%
Rent to Value Ratio
Active
$760,000
3
bds
|
4
ba
|
0
sqft
|
built
2008
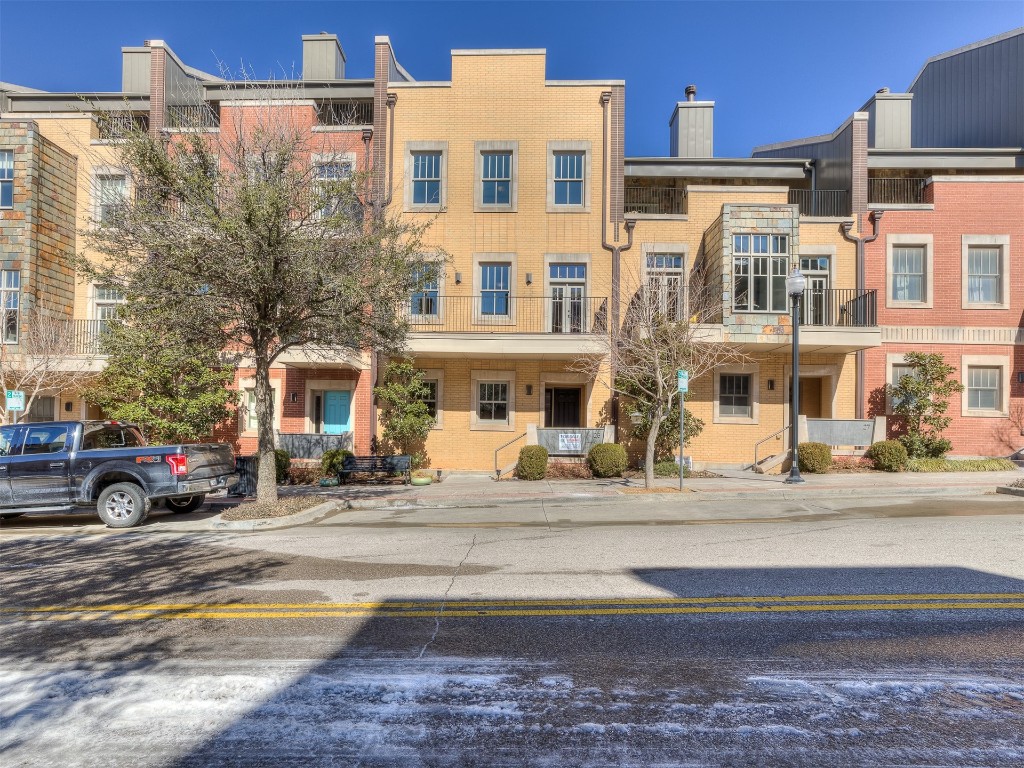
23 NE 3rd St, Oklahoma City, OK 73104
$-1,288
Cash flow
-8.8%
Cash-on-Cash Return
3.6%
Cap rate
0.6%
Rent to Value Ratio
Pending
$165,000
2
bds
|
3
ba
|
0
sqft
|
built
1972
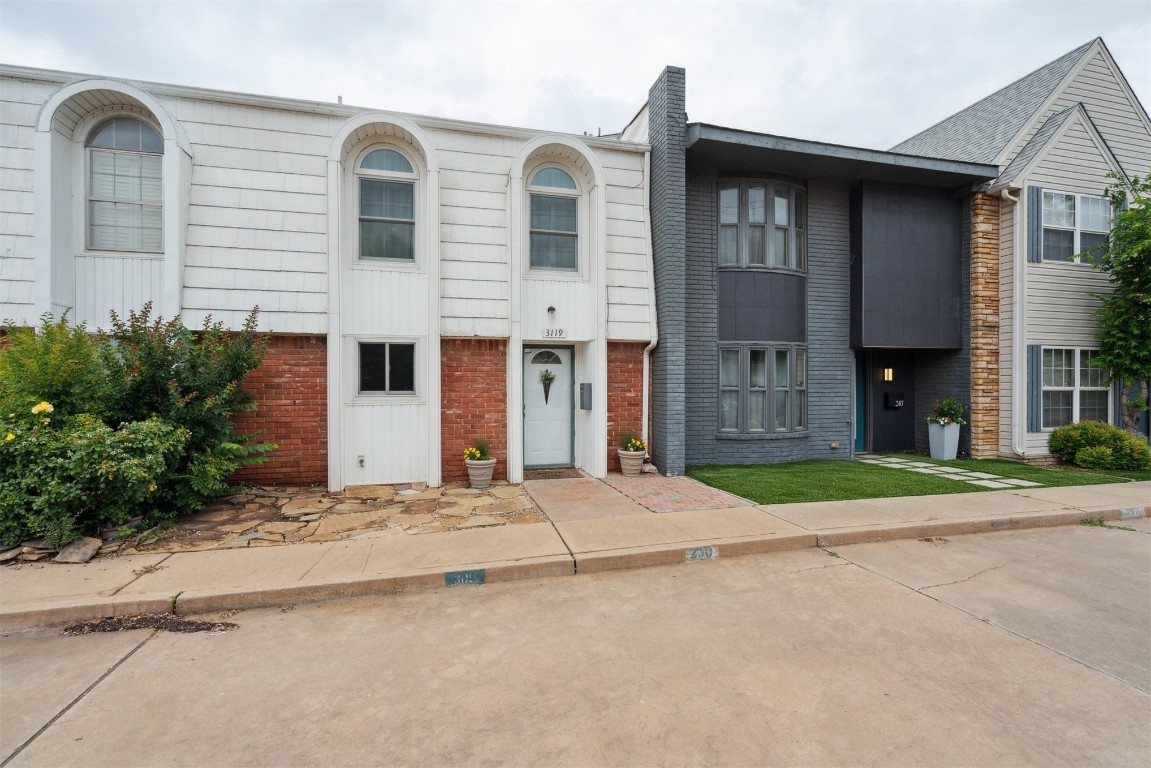
3119 W Wilshire Blvd, Oklahoma City, OK 73116
$110
Cash flow
3.5%
Cash-on-Cash Return
6.5%
Cap rate
0.9%
Rent to Value Ratio
Active
$99,000
2
bds
|
2
ba
|
0
sqft
|
built
1983
7501 S Sherwood Ave, Oklahoma City, OK 73159
$503
Cash flow
26.5%
Cash-on-Cash Return
11.8%
Cap rate
1.6%
Rent to Value Ratio
Active
$190,000
2
bds
|
3
ba
|
0
sqft
|
built
1974
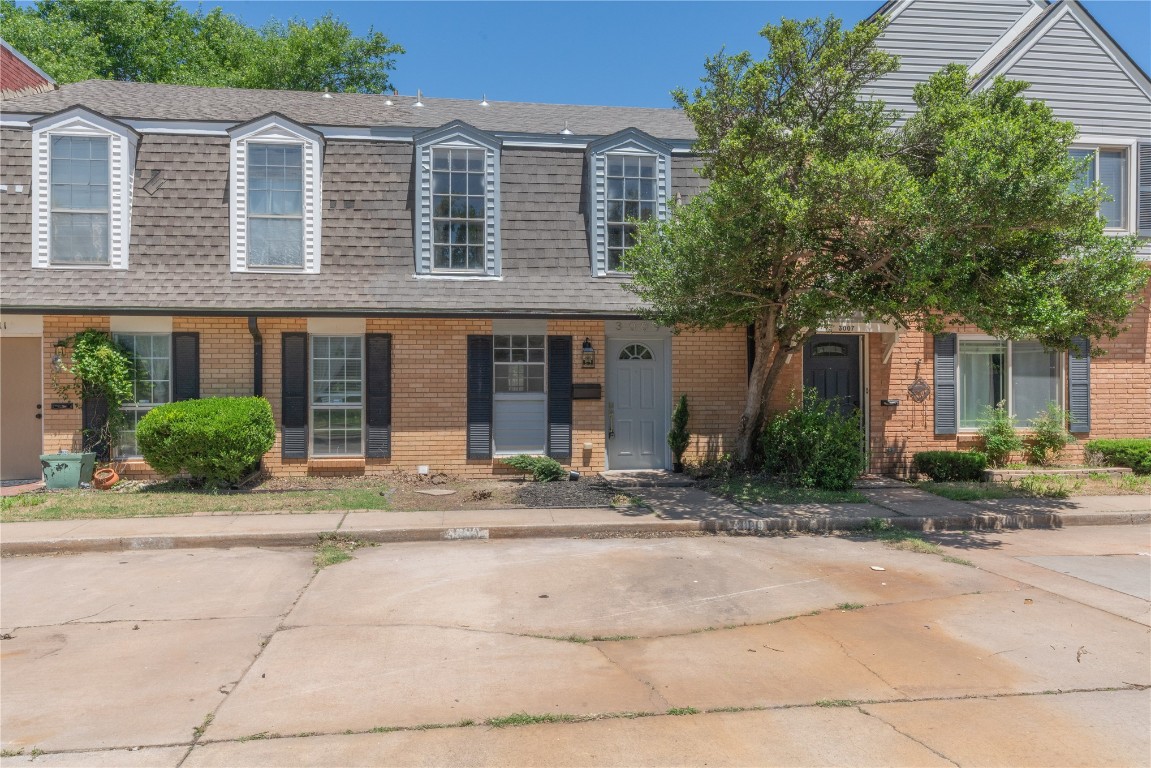
3009 W Wilshire Blvd, Oklahoma City, OK 73116
$-86
Cash flow
-2.4%
Cash-on-Cash Return
5.1%
Cap rate
0.7%
Rent to Value Ratio
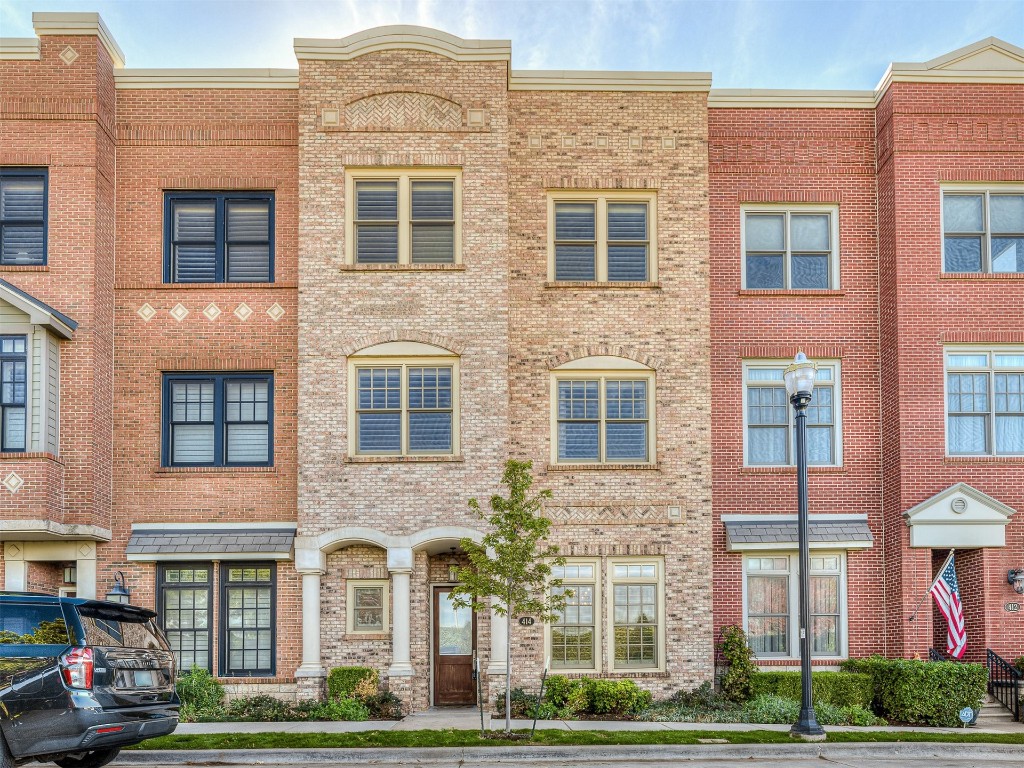
Active
$999,900
4
bds
|
4
ba
|
0
sqft
|
built
2011
414 NE 2nd St, Oklahoma City, OK 73104
$-2,720
Cash flow
-14.2%
Cash-on-Cash Return
2.4%
Cap rate
0.6%
Rent to Value Ratio

Active
$300,000
3
bds
|
3
ba
|
0
sqft
|
built
2008
10924 Silo Ridge Rd, Oklahoma City, OK 73170
$-203
Cash flow
-3.5%
Cash-on-Cash Return
4.9%
Cap rate
0.7%
Rent to Value Ratio
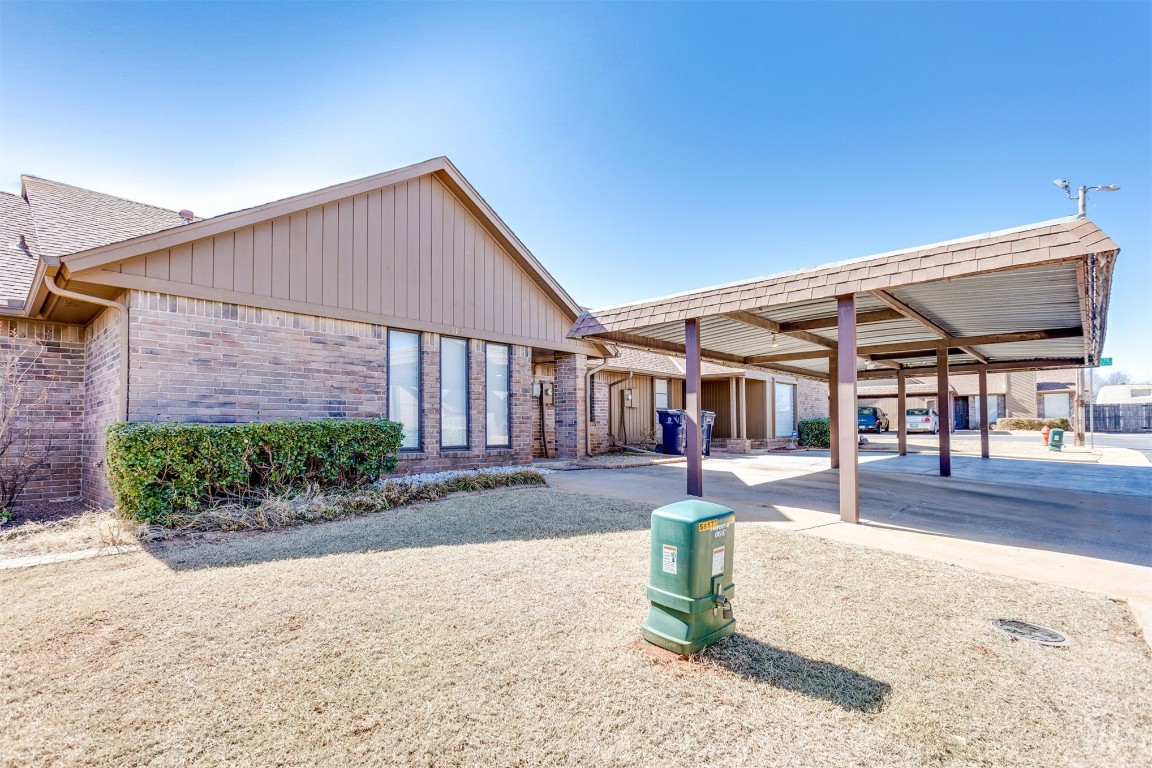
Active
$175,000
3
bds
|
2
ba
|
0
sqft
|
built
1984
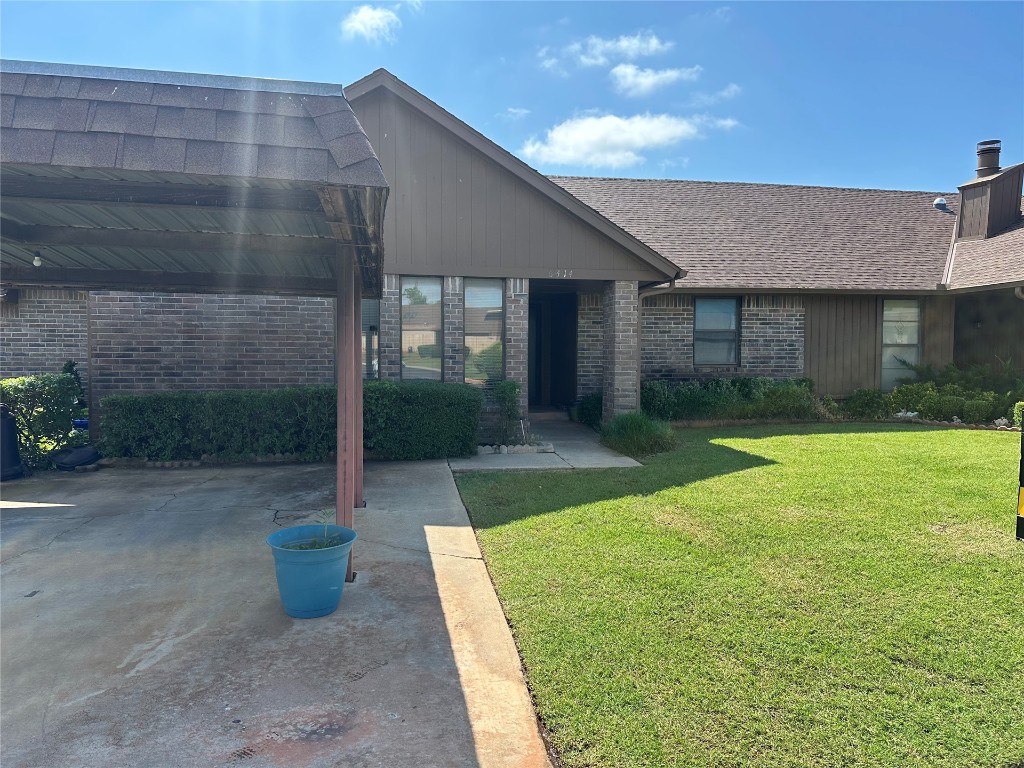
317 SW 92nd St, Oklahoma City, OK 73139
$-98
Cash flow
-2.9%
Cash-on-Cash Return
5.0%
Cap rate
0.7%
Rent to Value Ratio
Active
$167,500
2
bds
|
1
ba
|
0
sqft
|
built
2017
1020 SW 92nd St, Oklahoma City, OK 73139
$-165
Cash flow
-5.1%
Cash-on-Cash Return
4.5%
Cap rate
0.8%
Rent to Value Ratio
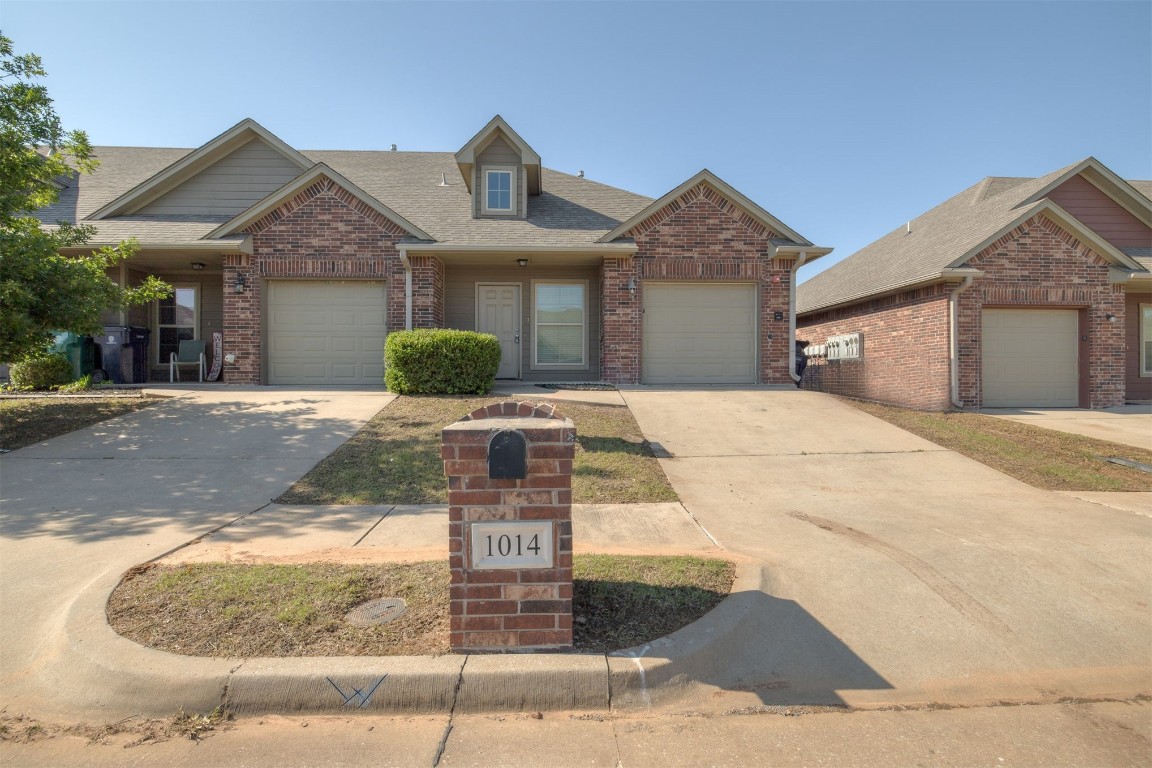
Active
$167,500
2
bds
|
1
ba
|
0
sqft
|
built
2013
1014 SW 92nd St, Oklahoma City, OK 73139
$-96
Cash flow
-3.0%
Cash-on-Cash Return
5.0%
Cap rate
0.8%
Rent to Value Ratio
Active
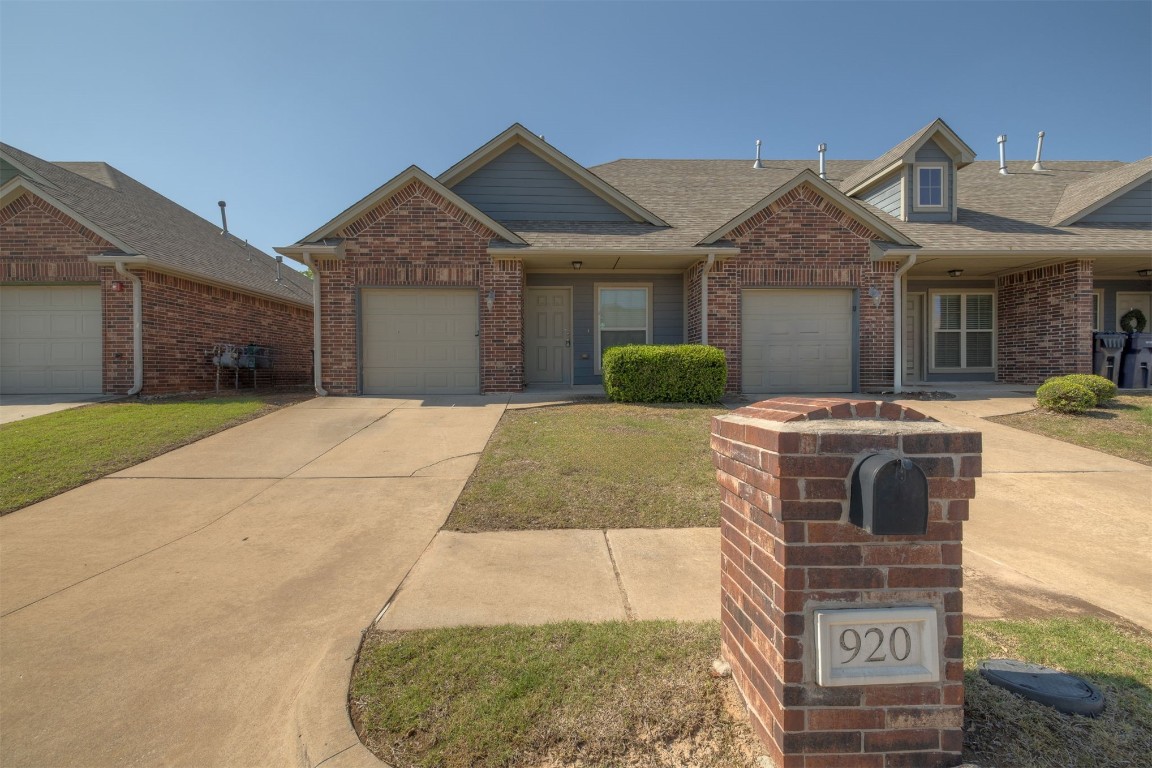
$167,500
2
bds
|
1
ba
|
0
sqft
|
built
2012
920 SW 92nd St, Oklahoma City, OK 73139
$-161
Cash flow
-5.0%
Cash-on-Cash Return
4.5%
Cap rate
0.8%
Rent to Value Ratio
Active
$190,000
3
bds
|
2
ba
|
0
sqft
|
built
1984
7300 NW 101st St, Oklahoma City, OK 73162
$102
Cash flow
2.8%
Cash-on-Cash Return
6.3%
Cap rate
0.8%
Rent to Value Ratio
Active
$204,900
3
bds
|
3
ba
|
0
sqft
|
built
1975
10128 Hefner Village Ter, Oklahoma City, OK 73162
$-358
Cash flow
-9.1%
Cash-on-Cash Return
3.6%
Cap rate
0.7%
Rent to Value Ratio
Active
$285,000
2
bds
|
3
ba
|
0
sqft
|
built
1981
3107 NW 63rd St, Oklahoma City, OK 73116
$-823
Cash flow
-15.1%
Cash-on-Cash Return
2.2%
Cap rate
0.8%
Rent to Value Ratio
Active
$148,900
1
bds
|
1
ba
|
0
sqft
|
built
2016
925 SW 92nd St, Oklahoma City, OK 73139
$-13
Cash flow
-0.5%
Cash-on-Cash Return
5.6%
Cap rate
0.9%
Rent to Value Ratio
Active
$470,000
2
bds
|
3
ba
|
0
sqft
|
built
2015
1005 N Shartel Ave, Oklahoma City, OK 73102
$-868
Cash flow
-9.6%
Cash-on-Cash Return
3.5%
Cap rate
0.6%
Rent to Value Ratio
Active
$124,900
3
bds
|
2
ba
|
0
sqft
|
built
1982
3800 Southwind Ct, Oklahoma City, OK 73179
$252
Cash flow
10.5%
Cash-on-Cash Return
8.1%
Cap rate
1.1%
Rent to Value Ratio
Active
$1,300,000
3
bds
|
4
ba
|
0
sqft
|
built
2024
1303 N Dewey Ave, Oklahoma City, OK 73103
$-4,940
Cash flow
-19.8%
Cash-on-Cash Return
1.1%
Cap rate
0.3%
Rent to Value Ratio

Active
$1,300,000
2
bds
|
4
ba
|
0
sqft
|
built
2024
1201 N Dewey Ave, Oklahoma City, OK 73103
$-3,327
Cash flow
-13.4%
Cash-on-Cash Return
2.6%
Cap rate
0.4%
Rent to Value Ratio
Active
$179,900
2
bds
|
2
ba
|
0
sqft
|
built
1978
10125 N Pennsylvania Ave, Oklahoma City, OK 73120
$98
Cash flow
2.8%
Cash-on-Cash Return
6.3%
Cap rate
1.0%
Rent to Value Ratio
Pending
$145,000
3
bds
|
3
ba
|
0
sqft
|
built
1980
9602 Hefner Village Blvd, Oklahoma City, OK 73162
$-65
Cash flow
-2.3%
Cash-on-Cash Return
5.1%
Cap rate
1.0%
Rent to Value Ratio
Pending
$205,000
3
bds
|
2
ba
|
0
sqft
|
built
1982
4717 Hemlock Ln, Oklahoma City, OK 73162
$-162
Cash flow
-4.1%
Cash-on-Cash Return
4.7%
Cap rate
0.8%
Rent to Value Ratio
Active
$419,900
2
bds
|
3
ba
|
0
sqft
|
built
2008
227 NE 4th St, Oklahoma City, OK 73104
$-927
Cash flow
-11.5%
Cash-on-Cash Return
3.0%
Cap rate
0.6%
Rent to Value Ratio
Active
$595,000
2
bds
|
3
ba
|
0
sqft
|
built
1975
6448 Brandywine Ln, Oklahoma City, OK 73116
$-930
Cash flow
-8.2%
Cash-on-Cash Return
3.8%
Cap rate
0.7%
Rent to Value Ratio
Active
$499,000
3
bds
|
4
ba
|
0
sqft
|
built
2002
3113 Hickory Sign Post Rd, Oklahoma City, OK 73116
$-936
Cash flow
-9.8%
Cash-on-Cash Return
3.4%
Cap rate
0.6%
Rent to Value Ratio
Active
$135,000
2
bds
|
2
ba
|
0
sqft
|
built
1977
11435 N May Ave, Oklahoma City, OK 73120
$-189
Cash flow
-7.3%
Cash-on-Cash Return
4.0%
Cap rate
0.9%
Rent to Value Ratio
Active
$299,900
3
bds
|
3
ba
|
0
sqft
|
built
2008
10931 Silo Ridge Rd, Oklahoma City, OK 73170
$-505
Cash flow
-8.8%
Cash-on-Cash Return
3.7%
Cap rate
0.6%
Rent to Value Ratio
Active
$157,900
4
bds
|
2
ba
|
0
sqft
|
built
1979
6512 Galaxie Ter, Oklahoma City, OK 73132
$-298
Cash flow
-9.8%
Cash-on-Cash Return
3.4%
Cap rate
0.9%
Rent to Value Ratio
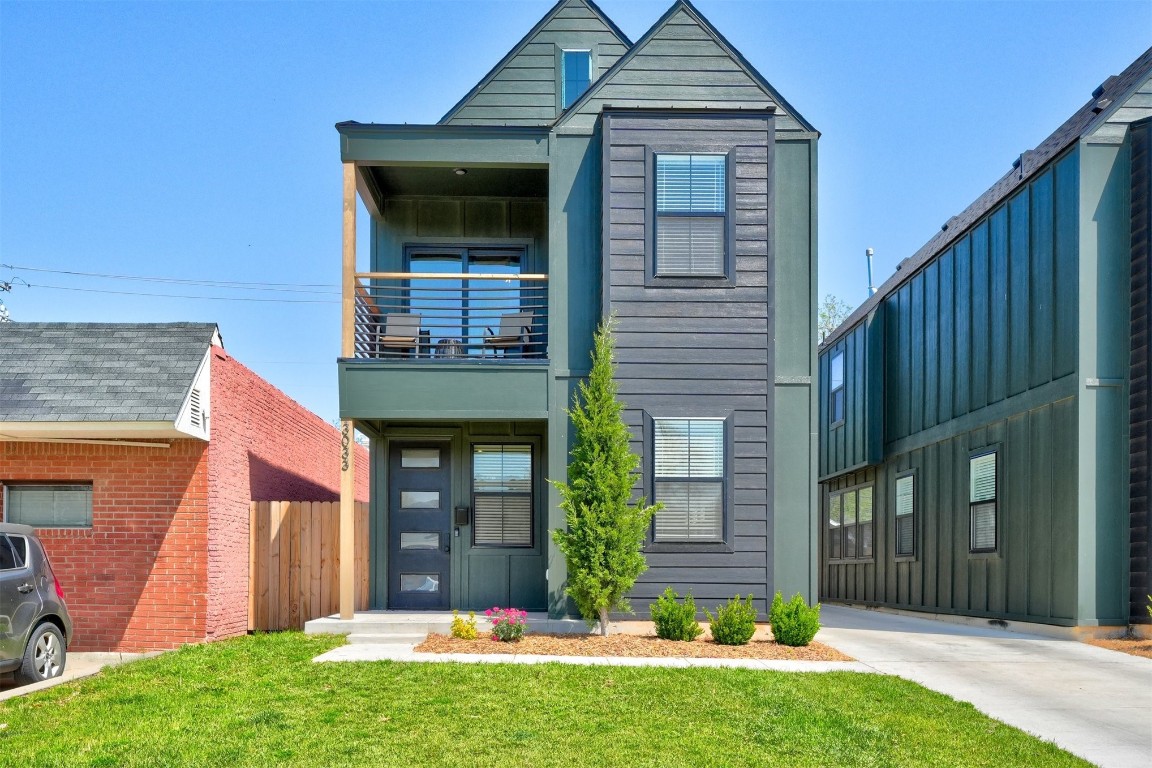
Active
$375,000
3
bds
|
3
ba
|
0
sqft
|
built
2022
3033 NW 19th St, Oklahoma City, OK 73107
$-215
Cash flow
-3.0%
Cash-on-Cash Return
5.0%
Cap rate
0.6%
Rent to Value Ratio
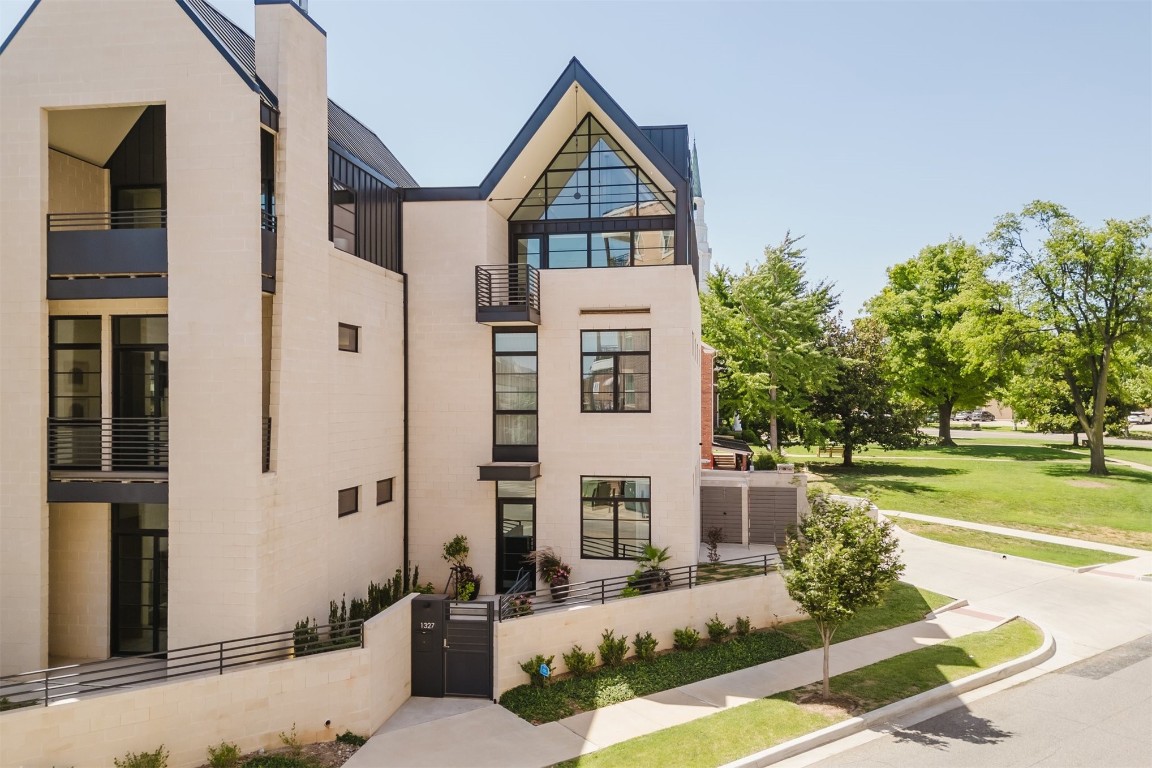
Active
$1,049,000
3
bds
|
4
ba
|
0
sqft
|
built
2021
1327 N Dewey Ave, Oklahoma City, OK 73103
$-4,018
Cash flow
-20.0%
Cash-on-Cash Return
1.1%
Cap rate
0.3%
Rent to Value Ratio
Active
$139,900
3
bds
|
3
ba
|
0
sqft
|
built
1975
8808 N Rockwell Dr, Oklahoma City, OK 73132
$-94
Cash flow
-3.5%
Cash-on-Cash Return
4.9%
Cap rate
1.0%
Rent to Value Ratio
Active
$159,900
2
bds
|
1
ba
|
0
sqft
|
built
2016
1001 SW 92nd St, Oklahoma City, OK 73139
$-68
Cash flow
-2.2%
Cash-on-Cash Return
5.2%
Cap rate
0.9%
Rent to Value Ratio
Active
$159,900
2
bds
|
1
ba
|
0
sqft
|
built
2014
913 SW 92nd St, Oklahoma City, OK 73139
$-139
Cash flow
-4.5%
Cash-on-Cash Return
4.6%
Cap rate
0.8%
Rent to Value Ratio