Oklahoma City, OK Investment Properties for Sale
Browse homes for sale and investment properties in Oklahoma City, OK. Refine your search by price, property type, or more.
Best cash flowing properties in Oklahoma City, OK
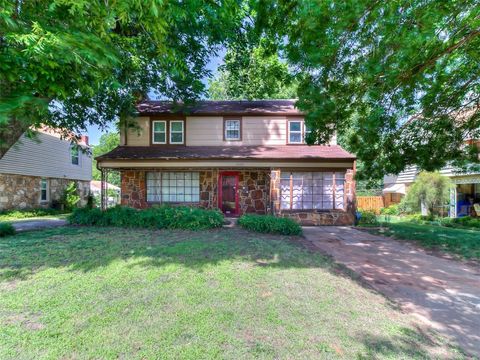
Active
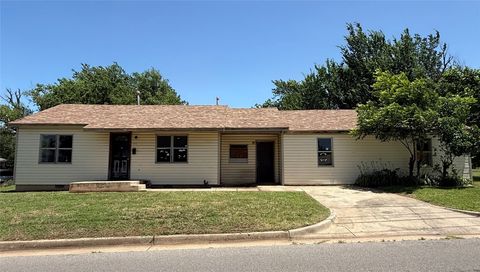
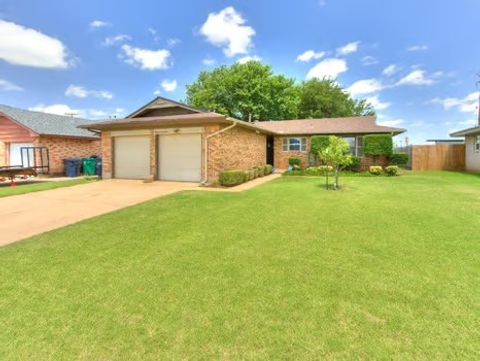
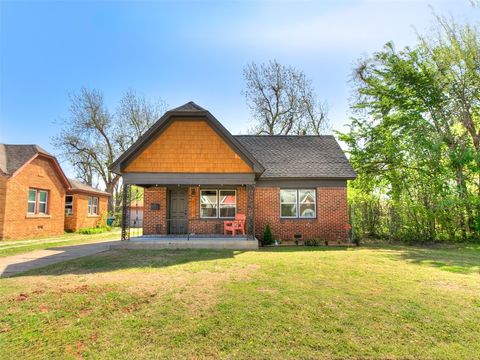
$90,000
3
bds
|
2
ba
|
0
sqft
|
built
1955
2918 N Prospect Ave, Oklahoma City, OK 73111
$465
Cash flow
27.0%
Cash-on-Cash Return
11.9%
Cap rate
1.6%
Rent to Value Ratio
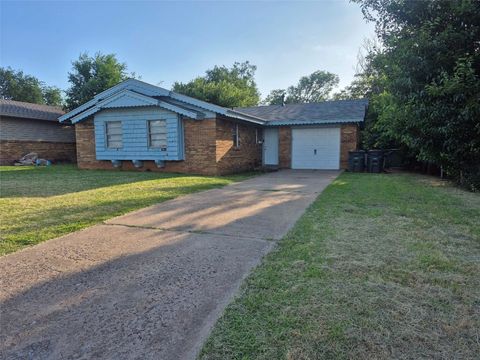
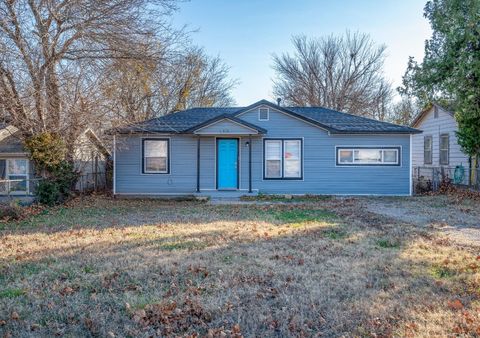
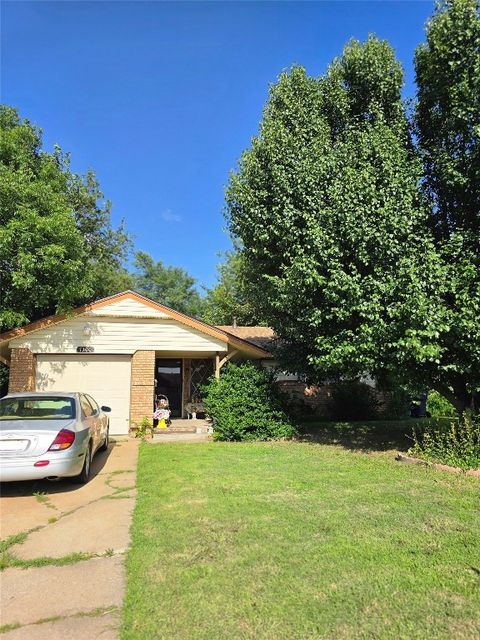
Active
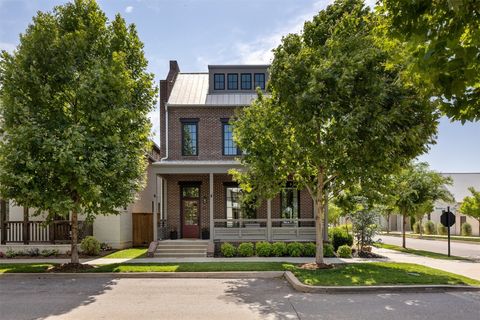
$99,999
3
bds
|
1
ba
|
0
sqft
|
built
1962
905 Shalimar Dr, Oklahoma City, OK 73115
$360
Cash flow
18.8%
Cash-on-Cash Return
10.0%
Cap rate
1.3%
Rent to Value Ratio
1,423 out of 1,802 properties for sale in Oklahoma City, OK
Limited Results Shown
Create a free account, or log in to reveal all property listings and enjoy the complete experience.
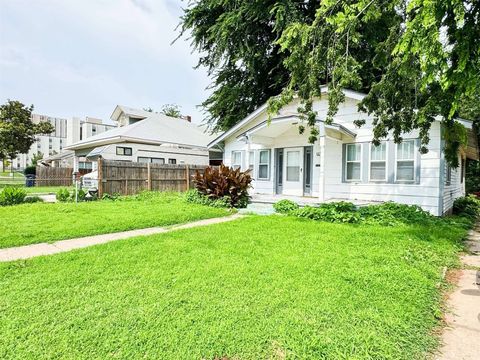
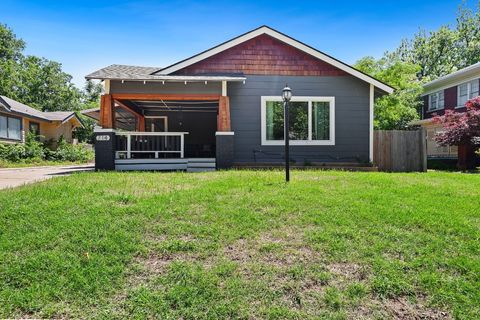
Active
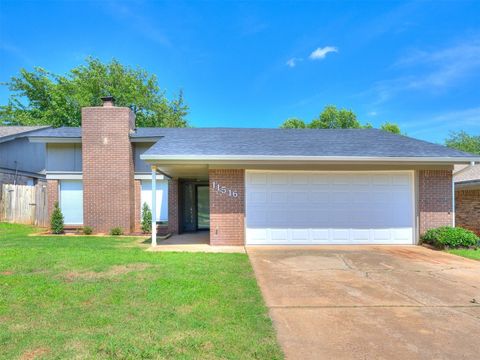
$113,000
2
bds
|
1
ba
|
0
sqft
|
built
1927
1138 N Lottie Ave, Oklahoma City, OK 73117
$250
Cash flow
11.5%
Cash-on-Cash Return
8.3%
Cap rate
1.1%
Rent to Value Ratio
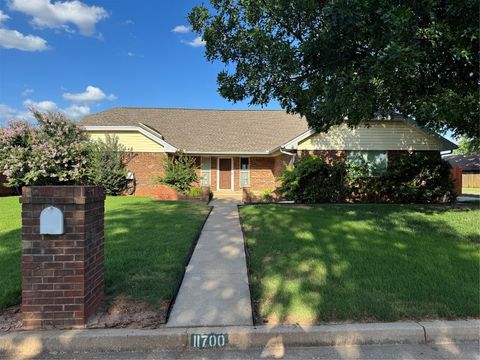
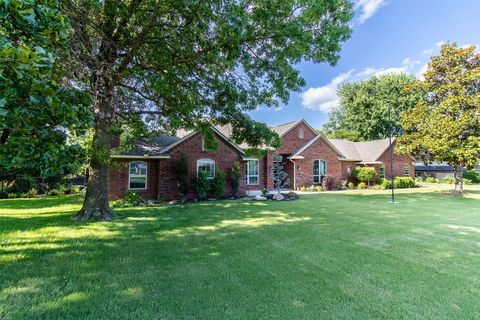
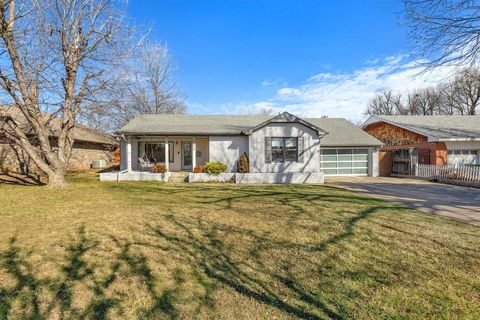
Active
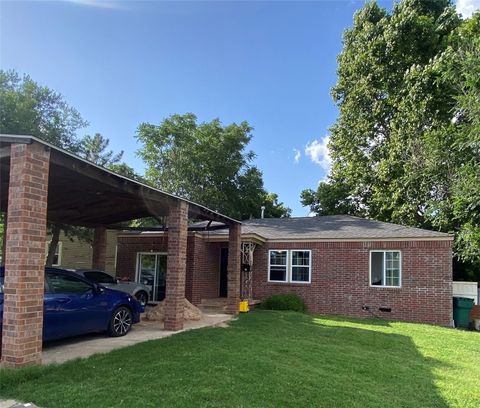
$230,000
3
bds
|
3
ba
|
0
sqft
|
built
1981
11700 Sierra Rd, Oklahoma City, OK 73162
$-32
Cash flow
-0.7%
Cash-on-Cash Return
5.5%
Cap rate
0.8%
Rent to Value Ratio
Active
$1,148,000
4
bds
|
7
ba
|
0
sqft
|
built
2020
7901 N Laura Ln, Oklahoma City, OK 73151
$-4,045
Cash flow
-18.4%
Cash-on-Cash Return
1.5%
Cap rate
0.3%
Rent to Value Ratio
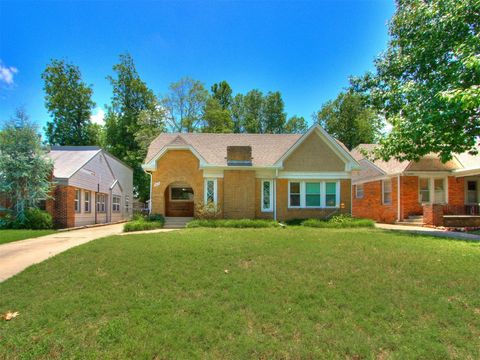
Active
$210,000
4
bds
|
2
ba
|
0
sqft
|
built
1938
3205 N Virginia Ave, Oklahoma City, OK 73118
$97
Cash flow
2.4%
Cash-on-Cash Return
6.2%
Cap rate
0.9%
Rent to Value Ratio
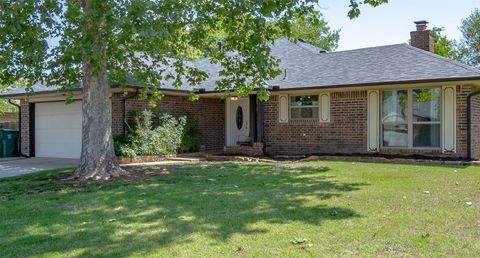
Active
$126,500
3
bds
|
1
ba
|
0
sqft
|
built
1952
4126 Jones Blvd, Oklahoma City, OK 73135
$97
Cash flow
4.0%
Cash-on-Cash Return
6.6%
Cap rate
0.9%
Rent to Value Ratio
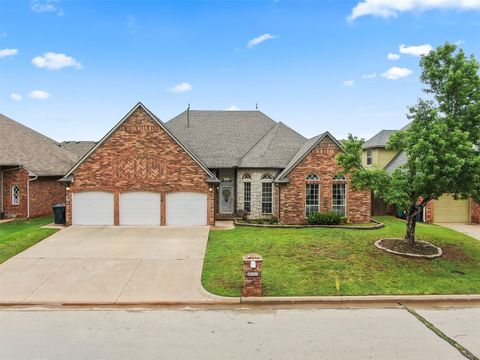
Active
$419,900
4
bds
|
3
ba
|
0
sqft
|
built
1993
10517 SE 49th St, Oklahoma City, OK 73150
$-569
Cash flow
-7.1%
Cash-on-Cash Return
4.1%
Cap rate
0.6%
Rent to Value Ratio
Active
$90,000
3
bds
|
2
ba
|
0
sqft
|
built
1955
2918 N Prospect Ave, Oklahoma City, OK 73111
$465
Cash flow
27.0%
Cash-on-Cash Return
11.9%
Cap rate
1.6%
Rent to Value Ratio
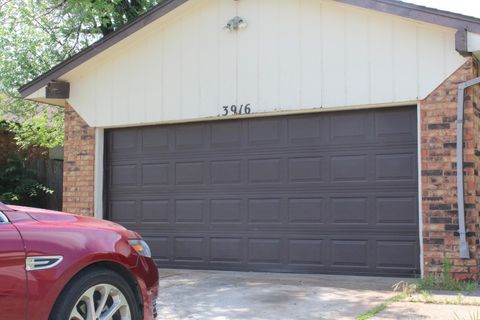
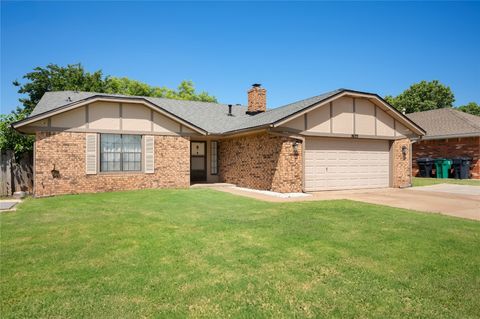
Active
$145,000
3
bds
|
2
ba
|
0
sqft
|
built
1978
3916 SE 46th St, Oklahoma City, OK 73135
$166
Cash flow
6.0%
Cash-on-Cash Return
7.1%
Cap rate
1.0%
Rent to Value Ratio
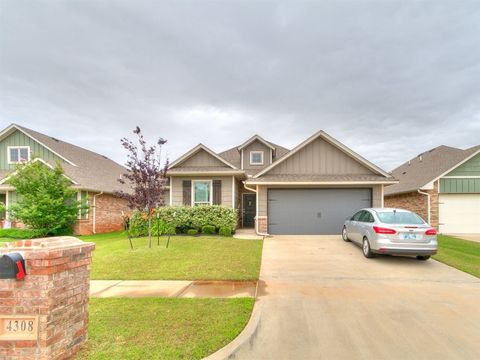
Active
$260,000
3
bds
|
2
ba
|
0
sqft
|
built
2020
4308 Palisade Ln, Oklahoma City, OK 73179
$-266
Cash flow
-5.3%
Cash-on-Cash Return
4.4%
Cap rate
0.7%
Rent to Value Ratio
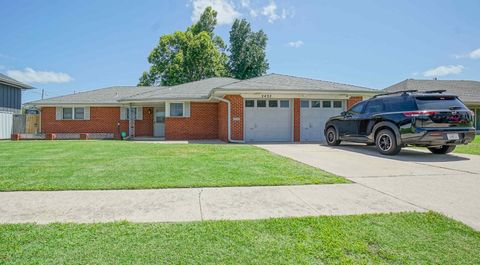
Active
$219,999
3
bds
|
2
ba
|
0
sqft
|
built
1963
2432 SW 80th St, Oklahoma City, OK 73159
$-121
Cash flow
-2.9%
Cash-on-Cash Return
5.0%
Cap rate
0.7%
Rent to Value Ratio
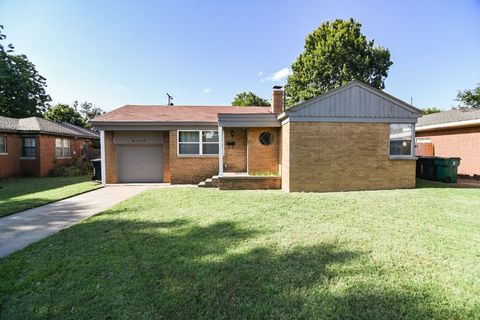
Active
$159,900
2
bds
|
1
ba
|
0
sqft
|
built
1950
4117 NW 21st St, Oklahoma City, OK 73107
$28
Cash flow
0.9%
Cash-on-Cash Return
5.9%
Cap rate
0.8%
Rent to Value Ratio
Active
$715,000
3
bds
|
3
ba
|
0
sqft
|
built
1918
1006 NW 18th St, Oklahoma City, OK 73106
$-2,209
Cash flow
-16.1%
Cash-on-Cash Return
2.0%
Cap rate
0.3%
Rent to Value Ratio
Active
$279,900
3
bds
|
2
ba
|
0
sqft
|
built
1960
2436 NW 43rd Cir, Oklahoma City, OK 73112
$-300
Cash flow
-5.6%
Cash-on-Cash Return
4.4%
Cap rate
0.6%
Rent to Value Ratio
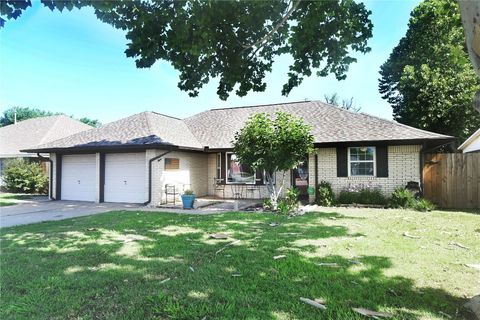
Active
$155,000
3
bds
|
2
ba
|
0
sqft
|
built
1960
601 SE 70th St, Oklahoma City, OK 73149
$309
Cash flow
10.4%
Cash-on-Cash Return
8.1%
Cap rate
1.0%
Rent to Value Ratio
Active
$998,000
3
bds
|
4
ba
|
0
sqft
|
built
2022
912 NW 44th St, Oklahoma City, OK 73118
$-3,374
Cash flow
-17.6%
Cash-on-Cash Return
1.6%
Cap rate
0.4%
Rent to Value Ratio
Active
$415,000
4
bds
|
3
ba
|
0
sqft
|
built
2020
6713 NW 149th St, Oklahoma City, OK 73142
$-673
Cash flow
-8.5%
Cash-on-Cash Return
3.7%
Cap rate
0.6%
Rent to Value Ratio
Active
$299,900
3
bds
|
2
ba
|
0
sqft
|
built
2004
809 SW 158th St, Oklahoma City, OK 73170
$-361
Cash flow
-6.3%
Cash-on-Cash Return
4.2%
Cap rate
0.6%
Rent to Value Ratio
Active
$300,000
3
bds
|
2
ba
|
0
sqft
|
built
2000
2455 Manchester Dr, Oklahoma City, OK 73120
$-777
Cash flow
-13.5%
Cash-on-Cash Return
2.6%
Cap rate
0.5%
Rent to Value Ratio
Active
$2,395,000
4
bds
|
7
ba
|
0
sqft
|
built
2005
12912 Anduin Ave, Oklahoma City, OK 73170
$-9,006
Cash flow
-19.6%
Cash-on-Cash Return
1.2%
Cap rate
0.2%
Rent to Value Ratio
Active
$199,500
2
bds
|
1
ba
|
0
sqft
|
built
1950
1817 Westchester Dr, Oklahoma City, OK 73120
$-109
Cash flow
-2.9%
Cash-on-Cash Return
5.0%
Cap rate
0.7%
Rent to Value Ratio
Active
$299,900
4
bds
|
2
ba
|
0
sqft
|
built
1967
1336 N Greenway Dr, Oklahoma City, OK 73127
$-418
Cash flow
-7.3%
Cash-on-Cash Return
4.0%
Cap rate
0.6%
Rent to Value Ratio
Active
$239,000
3
bds
|
2
ba
|
0
sqft
|
built
1992
8517 SW 36th Ter, Oklahoma City, OK 73179
$-201
Cash flow
-4.4%
Cash-on-Cash Return
4.7%
Cap rate
0.7%
Rent to Value Ratio
Active
$435,000
3
bds
|
3
ba
|
0
sqft
|
built
1982
1615 Fox Hollow Rdg, Oklahoma City, OK 73131
$-643
Cash flow
-7.7%
Cash-on-Cash Return
3.9%
Cap rate
0.6%
Rent to Value Ratio
Active
$164,900
3
bds
|
2
ba
|
0
sqft
|
built
1962
1329 SW 77th Ter, Oklahoma City, OK 73159
$48
Cash flow
1.5%
Cash-on-Cash Return
6.0%
Cap rate
0.8%
Rent to Value Ratio
Active
$145,000
3
bds
|
2
ba
|
0
sqft
|
built
1962
7300 S Brookline Ave, Oklahoma City, OK 73159
$314
Cash flow
11.3%
Cash-on-Cash Return
8.3%
Cap rate
1.1%
Rent to Value Ratio
Active
$473,400
3
bds
|
3
ba
|
0
sqft
|
built
1915
714 NW 32nd St, Oklahoma City, OK 73118
$-404
Cash flow
-4.5%
Cash-on-Cash Return
4.7%
Cap rate
0.7%
Rent to Value Ratio
Active
$395,900
3
bds
|
3
ba
|
0
sqft
|
built
1929
2523 NW 57th St, Oklahoma City, OK 73112
$-906
Cash flow
-11.9%
Cash-on-Cash Return
2.9%
Cap rate
0.5%
Rent to Value Ratio
Active
$99,999
3
bds
|
1
ba
|
0
sqft
|
built
1962
905 Shalimar Dr, Oklahoma City, OK 73115
$360
Cash flow
18.8%
Cash-on-Cash Return
10.0%
Cap rate
1.3%
Rent to Value Ratio
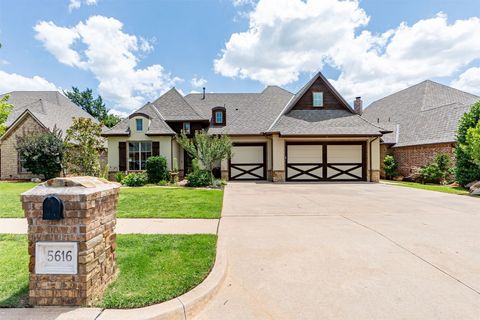
Active
$539,900
4
bds
|
3
ba
|
0
sqft
|
built
2010
5616 NW 130th St, Oklahoma City, OK 73142
$-1,160
Cash flow
-11.2%
Cash-on-Cash Return
3.1%
Cap rate
0.5%
Rent to Value Ratio
Active
$208,000
2
bds
|
1
ba
|
0
sqft
|
built
1929
2420 NW 21st St, Oklahoma City, OK 73107
$-214
Cash flow
-5.4%
Cash-on-Cash Return
4.4%
Cap rate
0.7%
Rent to Value Ratio
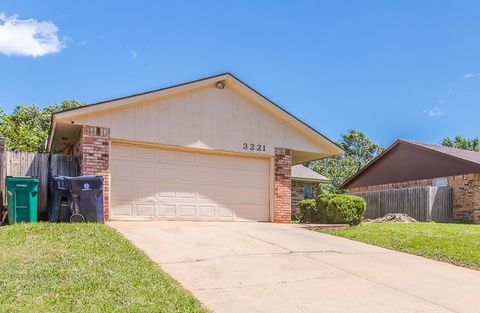
Active
$162,000
3
bds
|
2
ba
|
0
sqft
|
built
1981
3221 SE 57th St, Oklahoma City, OK 73135
$91
Cash flow
2.9%
Cash-on-Cash Return
6.4%
Cap rate
0.9%
Rent to Value Ratio
Active
$255,000
3
bds
|
2
ba
|
0
sqft
|
built
1981
12612 Bannockburn Pl, Oklahoma City, OK 73142
$-279
Cash flow
-5.7%
Cash-on-Cash Return
4.4%
Cap rate
0.7%
Rent to Value Ratio
Active
$164,900
2
bds
|
1
ba
|
0
sqft
|
built
2025
2212 N Kelham Ave, Oklahoma City, OK 73111
$-82
Cash flow
-2.6%
Cash-on-Cash Return
5.1%
Cap rate
0.7%
Rent to Value Ratio
Active
$985,000
5
bds
|
4
ba
|
0
sqft
|
built
2019
1801 Runway Blvd, Oklahoma City, OK 73108
$-1,426
Cash flow
-7.6%
Cash-on-Cash Return
3.9%
Cap rate
0.5%
Rent to Value Ratio
Active
$249,900
3
bds
|
2
ba
|
0
sqft
|
built
1973
11516 N Barnes Ave, Oklahoma City, OK 73120
$-236
Cash flow
-4.9%
Cash-on-Cash Return
4.5%
Cap rate
0.6%
Rent to Value Ratio
Active
$220,000
4
bds
|
1
ba
|
0
sqft
|
built
1950
2451 NW 42nd St, Oklahoma City, OK 73112
$-150
Cash flow
-3.6%
Cash-on-Cash Return
4.9%
Cap rate
0.7%
Rent to Value Ratio
Active
$420,000
4
bds
|
3
ba
|
0
sqft
|
built
2004
8841 NW 120th St, Oklahoma City, OK 73162
$-342
Cash flow
-4.2%
Cash-on-Cash Return
4.7%
Cap rate
0.7%
Rent to Value Ratio
Active
$235,000
3
bds
|
2
ba
|
0
sqft
|
built
1981
5633 S Ventura Dr, Oklahoma City, OK 73135
$-211
Cash flow
-4.7%
Cash-on-Cash Return
4.6%
Cap rate
0.7%
Rent to Value Ratio
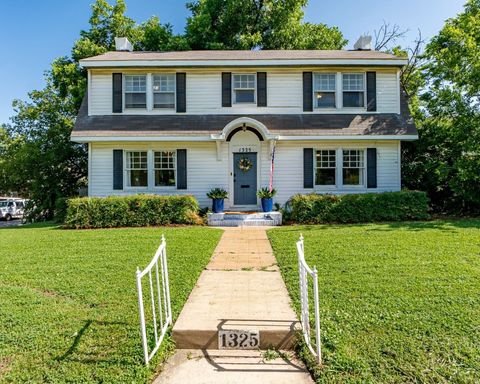
Active
$575,000
3
bds
|
3
ba
|
0
sqft
|
built
1927
1325 NW 20th St, Oklahoma City, OK 73106
$-1,224
Cash flow
-11.1%
Cash-on-Cash Return
3.1%
Cap rate
0.5%
Rent to Value Ratio
Active
$219,900
3
bds
|
2
ba
|
0
sqft
|
built
1966
2401 Flair Dr, Oklahoma City, OK 73159
$-109
Cash flow
-2.6%
Cash-on-Cash Return
5.1%
Cap rate
0.7%
Rent to Value Ratio