Oklahoma City, OK Investment Properties for Sale
Browse homes for sale and investment properties in Oklahoma City, OK. Refine your search by price, property type, or more.
Best cash flowing properties in Oklahoma City, OK
Active
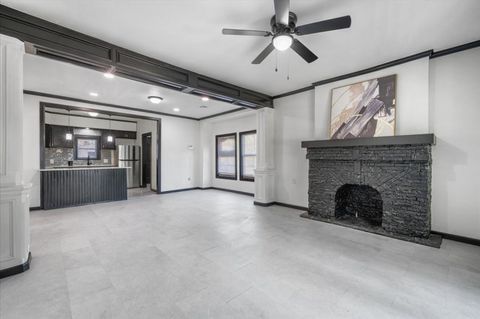
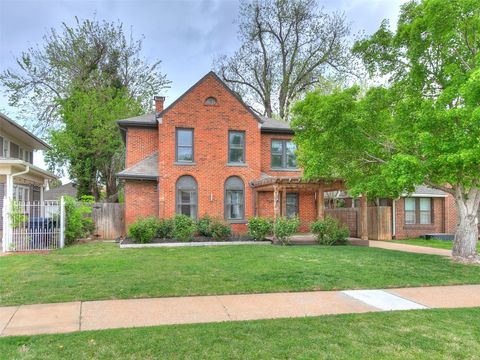
$185,000
3
bds
|
2
ba
|
0
sqft
|
built
1915
1901 NW 7th St, Oklahoma City, OK 73106
$213
Cash flow
6.0%
Cash-on-Cash Return
7.1%
Cap rate
0.9%
Rent to Value Ratio
Active
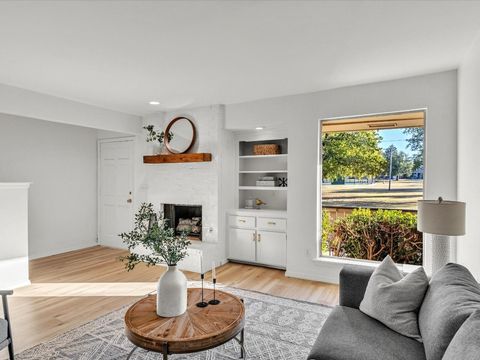
$179,900
2
bds
|
2
ba
|
0
sqft
|
built
1978
10125 N Pennsylvania Ave, Oklahoma City, OK 73120
$98
Cash flow
2.8%
Cash-on-Cash Return
6.3%
Cap rate
1.0%
Rent to Value Ratio
1,423 out of 1,802 properties for sale in Oklahoma City, OK
Limited Results Shown
Create a free account, or log in to reveal all property listings and enjoy the complete experience.
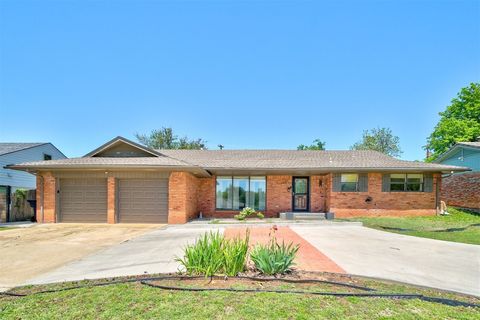
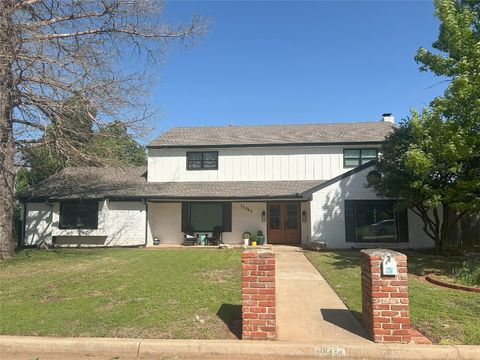
Active
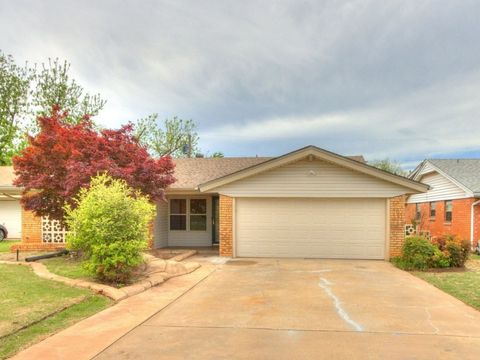
$190,000
3
bds
|
2
ba
|
0
sqft
|
built
1964
5413 S Santa Fe Ave, Oklahoma City, OK 73109
$-135
Cash flow
-3.7%
Cash-on-Cash Return
4.8%
Cap rate
0.7%
Rent to Value Ratio
Active
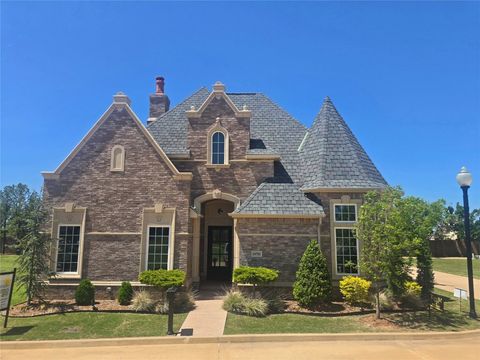
$969,000
3
bds
|
4
ba
|
0
sqft
|
built
2023
10701 Servon Dr, Oklahoma City, OK 73170
$-2,484
Cash flow
-13.4%
Cash-on-Cash Return
2.6%
Cap rate
0.4%
Rent to Value Ratio
Active
$374,900
3
bds
|
2
ba
|
0
sqft
|
built
2021
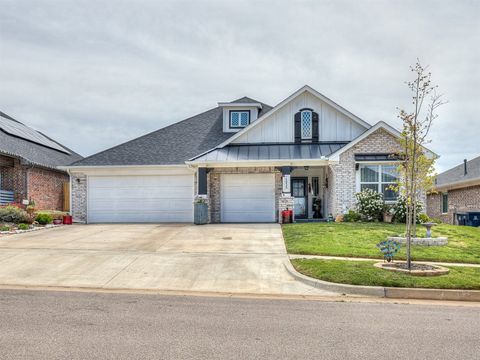
15936 Buffalo Dr, Oklahoma City, OK 73170
$-687
Cash flow
-9.6%
Cash-on-Cash Return
3.5%
Cap rate
0.6%
Rent to Value Ratio
Active
$185,000
3
bds
|
2
ba
|
0
sqft
|
built
1915
1901 NW 7th St, Oklahoma City, OK 73106
$213
Cash flow
6.0%
Cash-on-Cash Return
7.1%
Cap rate
0.9%
Rent to Value Ratio
Active
$365,000
3
bds
|
2
ba
|
0
sqft
|
built
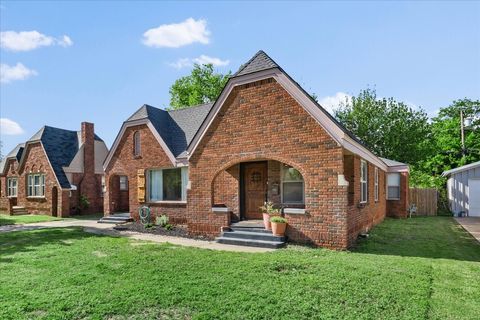
1930
2541 NW 12th St, Oklahoma City, OK 73107
$-684
Cash flow
-9.8%
Cash-on-Cash Return
3.4%
Cap rate
0.5%
Rent to Value Ratio
Active
$284,900
3
bds
|
2
ba
|
0
sqft
|
built
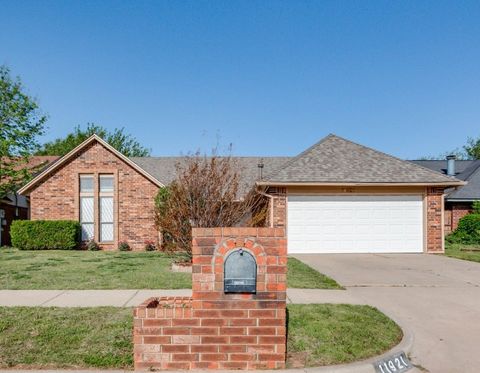
1985
11921 Blue Moon Ave, Oklahoma City, OK 73162
$-199
Cash flow
-3.6%
Cash-on-Cash Return
4.8%
Cap rate
0.7%
Rent to Value Ratio
Active
$366,999
4
bds
|
3
ba
|
0
sqft
|
built
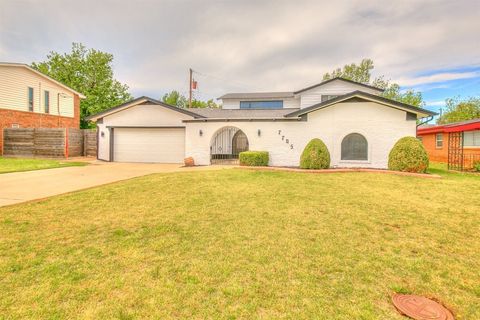
1968
7705 Rumsey Rd, Oklahoma City, OK 73132
$-534
Cash flow
-7.6%
Cash-on-Cash Return
3.9%
Cap rate
0.6%
Rent to Value Ratio
Active
$249,995
3
bds
|
2
ba
|
0
sqft
|
built
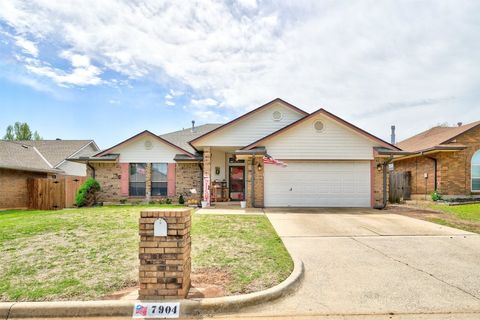
1987
7904 NW 81st St, Oklahoma City, OK 73132
$-116
Cash flow
-2.4%
Cash-on-Cash Return
5.1%
Cap rate
0.7%
Rent to Value Ratio

Active
$1,300,000
3
bds
|
4
ba
|
0
sqft
|
built
2024
1303 N Dewey Ave, Oklahoma City, OK 73103
$-4,940
Cash flow
-19.8%
Cash-on-Cash Return
1.1%
Cap rate
0.3%
Rent to Value Ratio
Active
$539,000
5
bds
|
3
ba
|
0
sqft
|
built
1927
725 NE 15th St, Oklahoma City, OK 73104
$-526
Cash flow
-5.1%
Cash-on-Cash Return
4.5%
Cap rate
0.7%
Rent to Value Ratio
Active
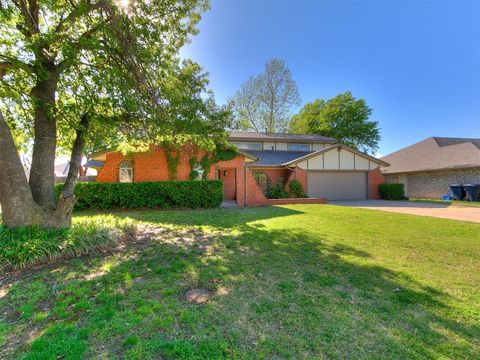
$449,000
4
bds
|
3
ba
|
0
sqft
|
built
1976
12512 Arrowhead Dr, Oklahoma City, OK 73120
$-554
Cash flow
-6.4%
Cash-on-Cash Return
4.2%
Cap rate
0.6%
Rent to Value Ratio
Active
$2,800,000
4
bds
|
5
ba
|
0
sqft
|
built
1947
7900 N Bryant Ave, Oklahoma City, OK 73131
$-10,625
Cash flow
-19.8%
Cash-on-Cash Return
1.1%
Cap rate
0.2%
Rent to Value Ratio
Active
$365,000
3
bds
|
3
ba
|
0
sqft
|
built
1956
1315 W Wilshire Blvd, Oklahoma City, OK 73116
$-289
Cash flow
-4.1%
Cash-on-Cash Return
4.7%
Cap rate
0.7%
Rent to Value Ratio
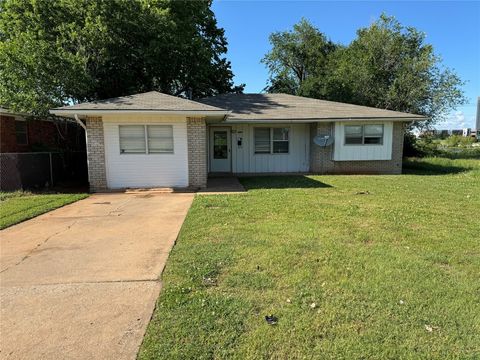
Active
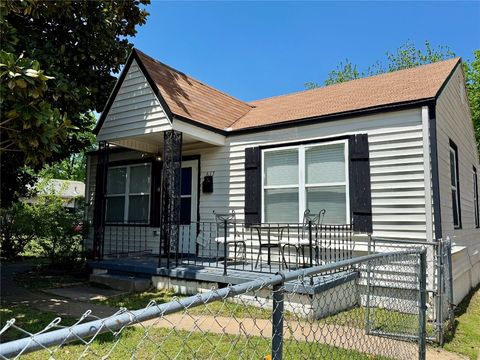
$149,000
2
bds
|
1
ba
|
0
sqft
|
built
1945
617 SE 35th St, Oklahoma City, OK 73129
$9
Cash flow
0.3%
Cash-on-Cash Return
5.8%
Cap rate
0.8%
Rent to Value Ratio
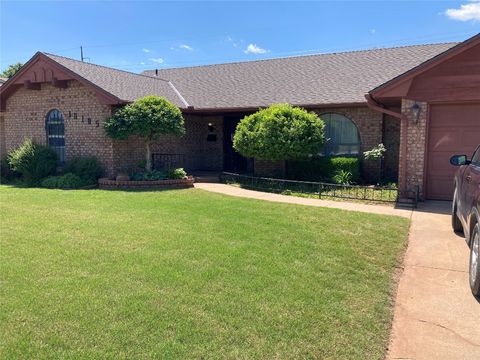
Active
$259,000
3
bds
|
2
ba
|
0
sqft
|
built
1973
10105 Bromley Ct, Oklahoma City, OK 73159
$-313
Cash flow
-6.3%
Cash-on-Cash Return
4.2%
Cap rate
0.6%
Rent to Value Ratio
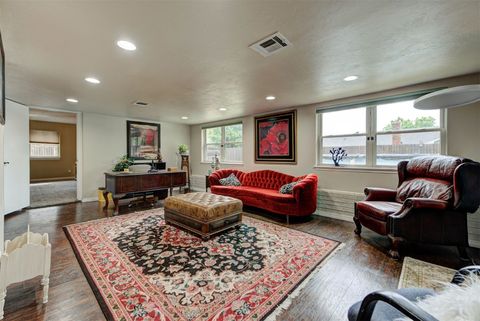
Active
$275,000
3
bds
|
3
ba
|
0
sqft
|
built
1971
2412 NW 119th St, Oklahoma City, OK 73120
$14
Cash flow
0.3%
Cash-on-Cash Return
5.7%
Cap rate
0.8%
Rent to Value Ratio
Active
$500,000
3
bds
|
3
ba
|
0
sqft
|
built
1972
11504 Leaning Elm Rd, Oklahoma City, OK 73120
$-1,241
Cash flow
-12.9%
Cash-on-Cash Return
2.7%
Cap rate
0.4%
Rent to Value Ratio
Active
$165,000
3
bds
|
1
ba
|
0
sqft
|
built
1963
201 NW 85th St, Oklahoma City, OK 73114
$-16
Cash flow
-0.5%
Cash-on-Cash Return
5.6%
Cap rate
0.8%
Rent to Value Ratio
Active
$210,000
2
bds
|
2
ba
|
0
sqft
|
built
1980
4815 NW 72nd St, Oklahoma City, OK 73132
$-324
Cash flow
-8.0%
Cash-on-Cash Return
3.8%
Cap rate
0.7%
Rent to Value Ratio
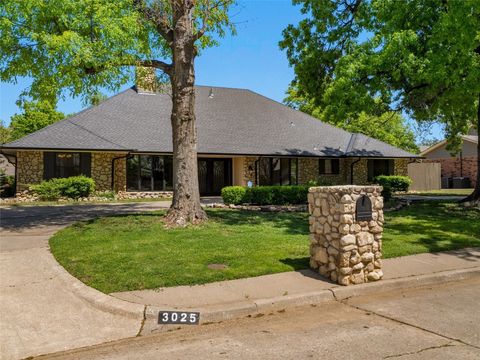
Active
$695,000
3
bds
|
5
ba
|
0
sqft
|
built
1966
3025 Pine Ridge Rd, Oklahoma City, OK 73120
$-970
Cash flow
-7.3%
Cash-on-Cash Return
4.0%
Cap rate
0.6%
Rent to Value Ratio
Active
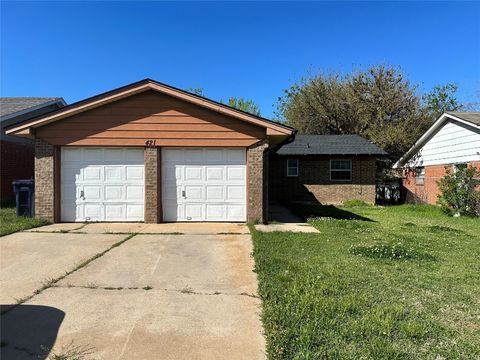
$165,000
3
bds
|
2
ba
|
0
sqft
|
built
1972
421 NW 89th St, Oklahoma City, OK 73114
$-28
Cash flow
-0.9%
Cash-on-Cash Return
5.5%
Cap rate
0.8%
Rent to Value Ratio
Active
$325,000
3
bds
|
2
ba
|
0
sqft
|
built
1972
10700 S Sooner Rd, Oklahoma City, OK 73165
$-447
Cash flow
-7.2%
Cash-on-Cash Return
4.0%
Cap rate
0.6%
Rent to Value Ratio
Active
$217,000
2
bds
|
1
ba
|
0
sqft
|
built
1930
2728 NW 11th St, Oklahoma City, OK 73107
$-153
Cash flow
-3.7%
Cash-on-Cash Return
4.8%
Cap rate
0.7%
Rent to Value Ratio
Active
$179,900
2
bds
|
2
ba
|
0
sqft
|
built
1978
10125 N Pennsylvania Ave, Oklahoma City, OK 73120
$98
Cash flow
2.8%
Cash-on-Cash Return
6.3%
Cap rate
1.0%
Rent to Value Ratio
Active
$275,000
3
bds
|
2
ba
|
0
sqft
|
built
2006
4552 Kiva Ct, Oklahoma City, OK 73135
$-21
Cash flow
-0.4%
Cash-on-Cash Return
5.6%
Cap rate
0.7%
Rent to Value Ratio
Active
$308,000
4
bds
|
3
ba
|
0
sqft
|
built
1975
11609 Windmill Rd, Oklahoma City, OK 73162
$-220
Cash flow
-3.7%
Cash-on-Cash Return
4.8%
Cap rate
0.7%
Rent to Value Ratio
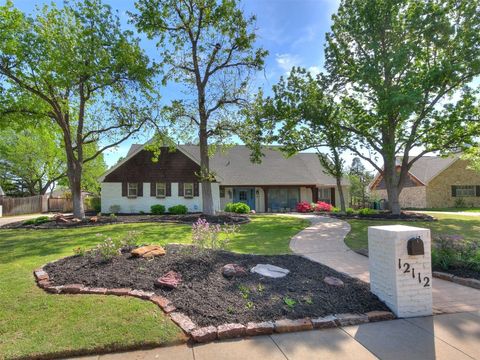
Active
$605,000
4
bds
|
3
ba
|
0
sqft
|
built
1965
12112 Blue Sage Rd, Oklahoma City, OK 73120
$-1,240
Cash flow
-10.7%
Cash-on-Cash Return
3.2%
Cap rate
0.5%
Rent to Value Ratio
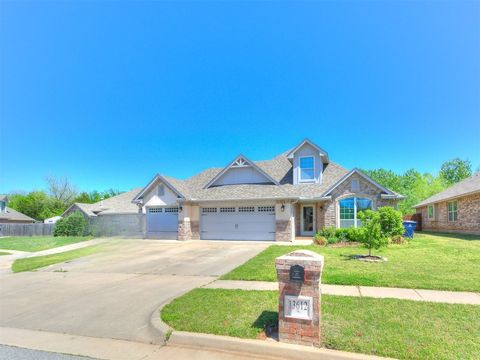
Active
$415,000
4
bds
|
3
ba
|
0
sqft
|
built
2017
13612 Calabria Trl, Oklahoma City, OK 73170
$-708
Cash flow
-8.9%
Cash-on-Cash Return
3.6%
Cap rate
0.6%
Rent to Value Ratio
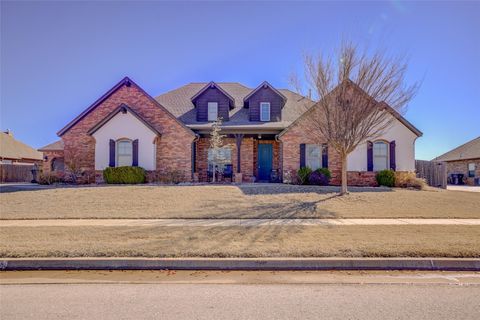
Active
$514,900
4
bds
|
4
ba
|
0
sqft
|
built
2015
14716 Bella Maria Dr, Oklahoma City, OK 73165
$-788
Cash flow
-8.0%
Cash-on-Cash Return
3.8%
Cap rate
0.6%
Rent to Value Ratio
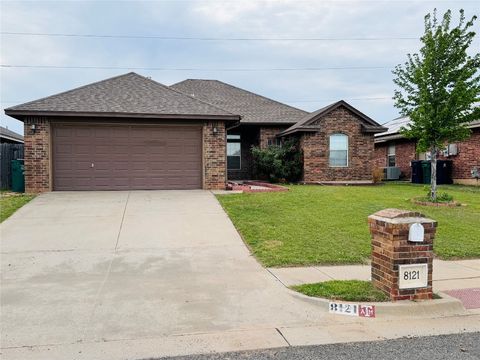
Active
$264,900
4
bds
|
2
ba
|
0
sqft
|
built
2013
8121 Hillers Rd, Oklahoma City, OK 73132
$-272
Cash flow
-5.4%
Cash-on-Cash Return
4.4%
Cap rate
0.7%
Rent to Value Ratio
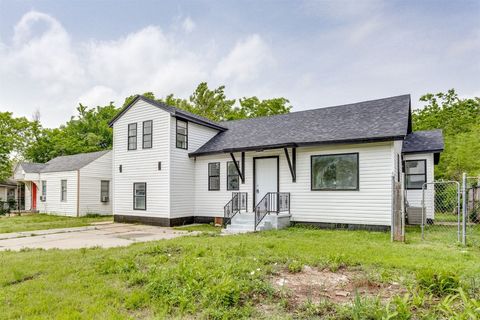
Active
$189,000
3
bds
|
2
ba
|
0
sqft
|
built
1934
1437 SW 34th St, Oklahoma City, OK 73119
$-142
Cash flow
-3.9%
Cash-on-Cash Return
4.8%
Cap rate
0.6%
Rent to Value Ratio
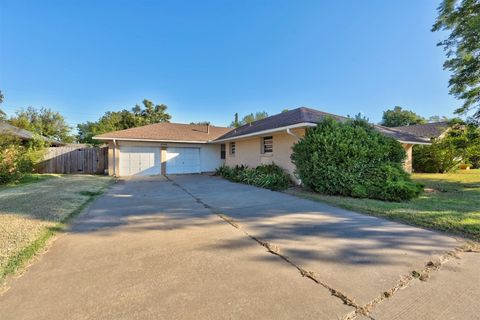
Active
$229,000
3
bds
|
2
ba
|
0
sqft
|
built
1959
3105 W Britton Rd, Oklahoma City, OK 73120
$-113
Cash flow
-2.6%
Cash-on-Cash Return
5.1%
Cap rate
0.8%
Rent to Value Ratio
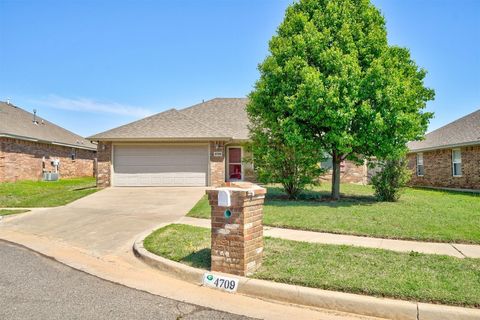
Active
$222,500
3
bds
|
2
ba
|
0
sqft
|
built
2011
4709 SE 81st St, Oklahoma City, OK 73135
$-151
Cash flow
-3.5%
Cash-on-Cash Return
4.9%
Cap rate
0.7%
Rent to Value Ratio
Active
$550,000
4
bds
|
4
ba
|
0
sqft
|
built
1999
8301 NW 64th Ter, Oklahoma City, OK 73132
$-997
Cash flow
-9.5%
Cash-on-Cash Return
3.5%
Cap rate
0.5%
Rent to Value Ratio
Active
$259,500
3
bds
|
3
ba
|
0
sqft
|
built
2023
10352 NW 17th St, Oklahoma City, OK 73127
$-261
Cash flow
-5.2%
Cash-on-Cash Return
4.5%
Cap rate
0.7%
Rent to Value Ratio
Active
$275,000
3
bds
|
2
ba
|
0
sqft
|
built
1997
6717 NW 133rd St, Oklahoma City, OK 73142
$-351
Cash flow
-6.7%
Cash-on-Cash Return
4.1%
Cap rate
0.7%
Rent to Value Ratio
Active
$372,500
4
bds
|
2
ba
|
0
sqft
|
built
1959
2716 Carlton Way, Oklahoma City, OK 73120
$-251
Cash flow
-3.5%
Cash-on-Cash Return
4.9%
Cap rate
0.7%
Rent to Value Ratio
Active
$255,000
4
bds
|
3
ba
|
0
sqft
|
built
1980
5029 NW 24th Pl, Oklahoma City, OK 73127
$-279
Cash flow
-5.7%
Cash-on-Cash Return
4.4%
Cap rate
0.7%
Rent to Value Ratio
Active
$189,900
3
bds
|
2
ba
|
0
sqft
|
built
1950
1730 Andover Ct, Oklahoma City, OK 73120
$12
Cash flow
0.3%
Cash-on-Cash Return
5.8%
Cap rate
0.8%
Rent to Value Ratio
Active
$450,000
3
bds
|
2
ba
|
0
sqft
|
built
1952
1716 Westminster Pl, Oklahoma City, OK 73120
$-845
Cash flow
-9.8%
Cash-on-Cash Return
3.4%
Cap rate
0.5%
Rent to Value Ratio