Oklahoma City, OK Investment Properties for Sale
Browse homes for sale and investment properties in Oklahoma City, OK. Refine your search by price, property type, or more.
Best cash flowing properties in Oklahoma City, OK

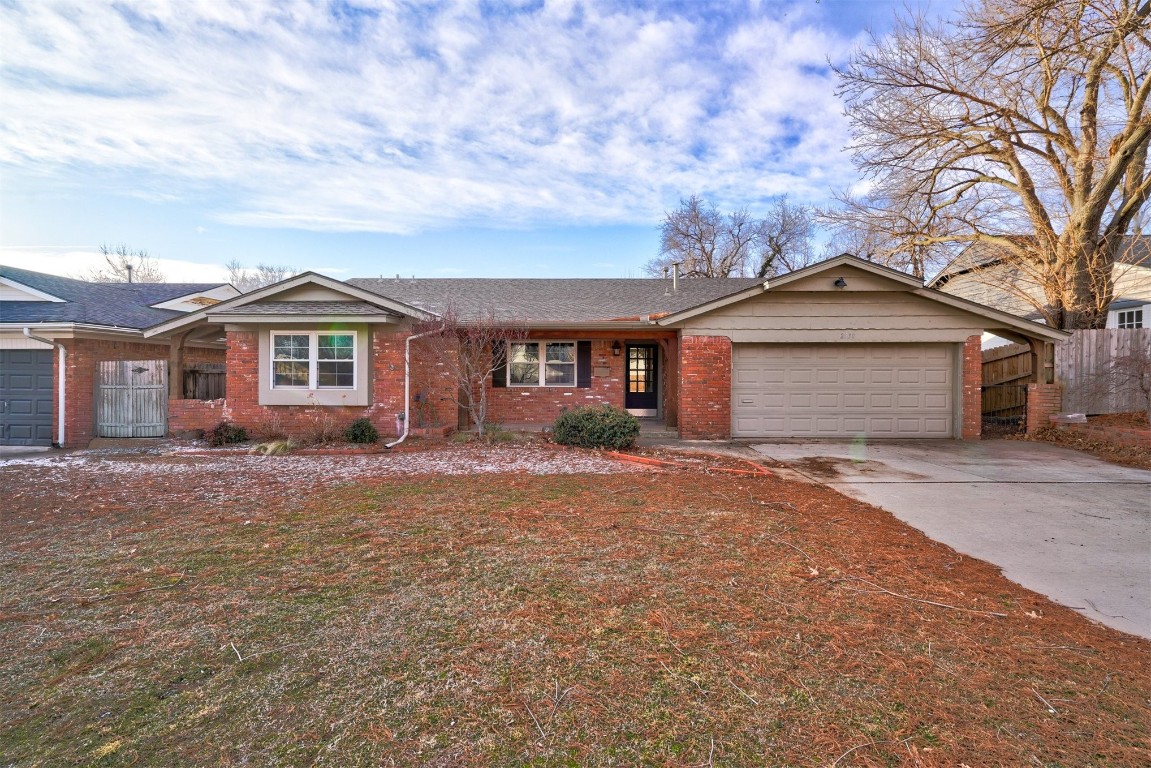
Active
$289,900
5
bds
|
3
ba
|
0
sqft
|
built
1920
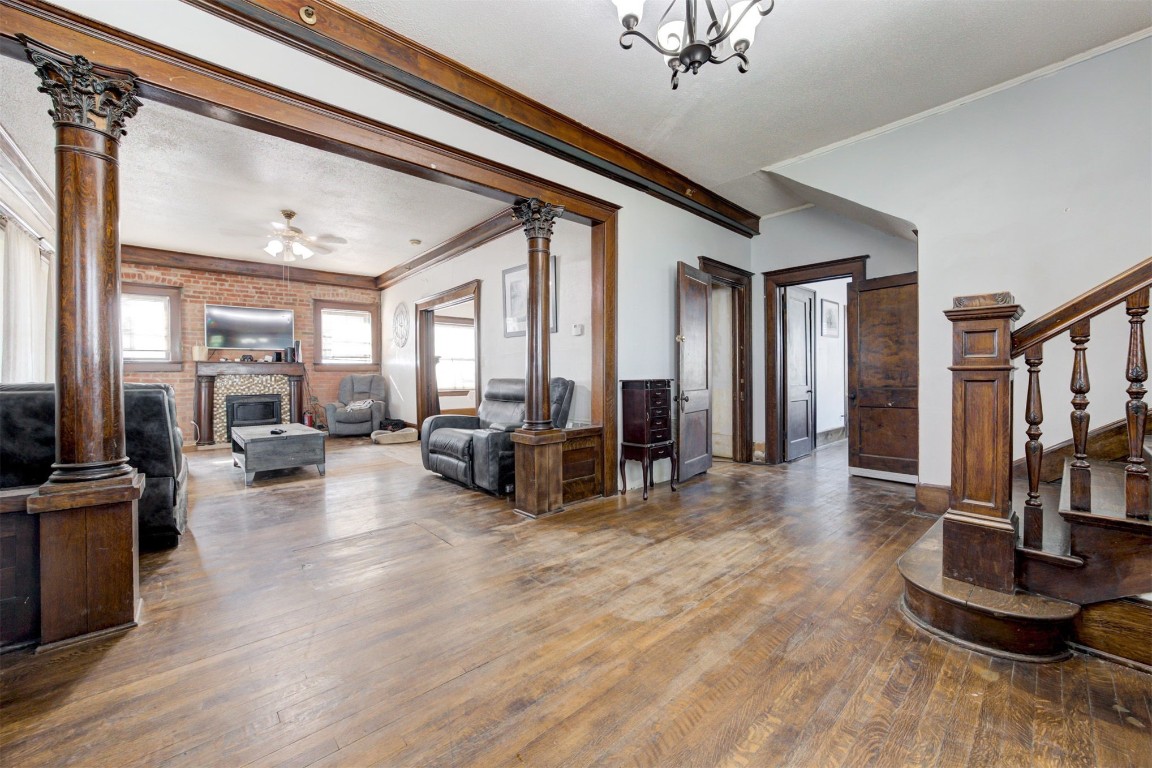
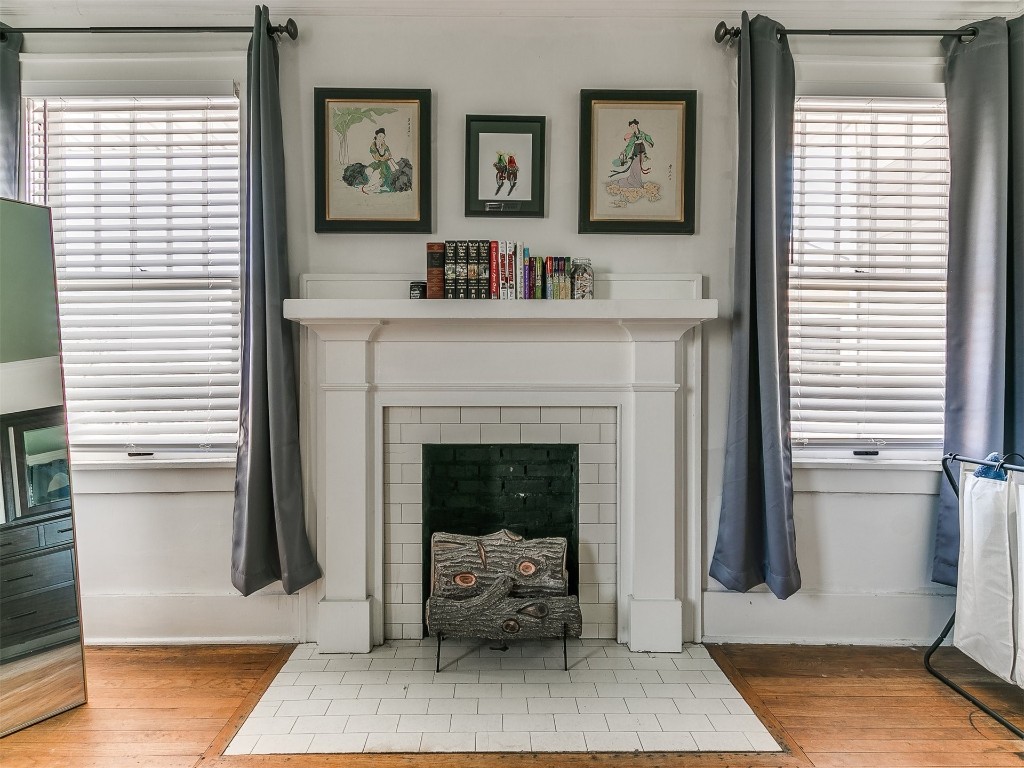
2233 NW 13th St, Oklahoma City, OK 73107
$365
Cash flow
6.6%
Cash-on-Cash Return
7.2%
Cap rate
1.0%
Rent to Value Ratio
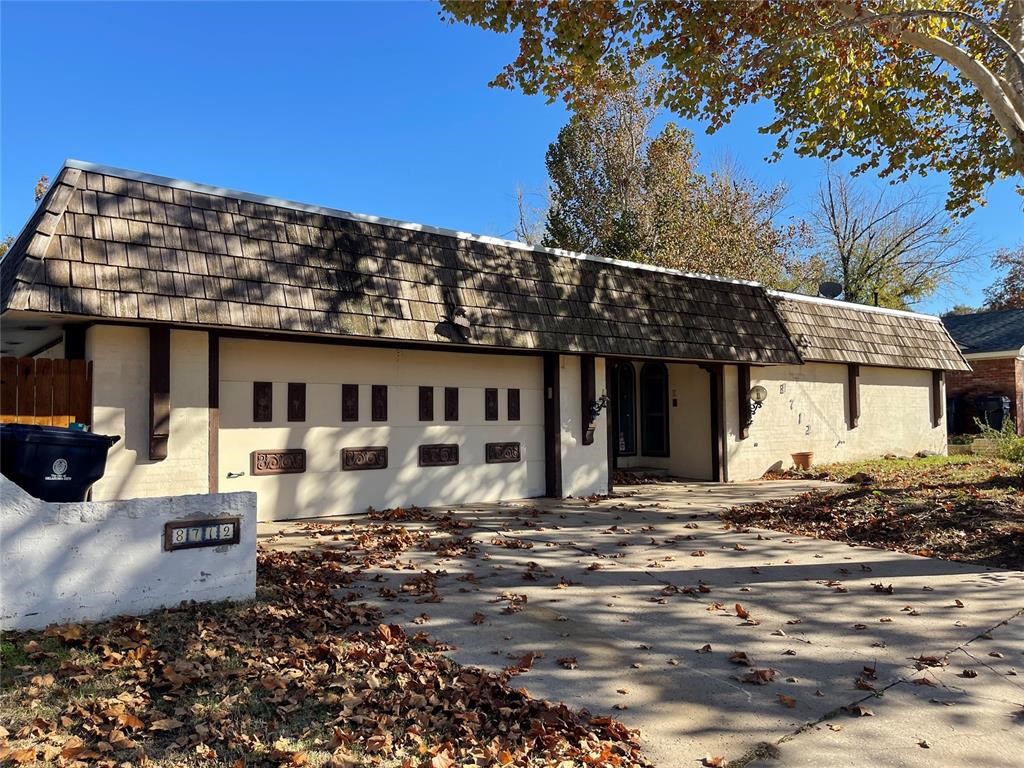
Active
$250,000
5
bds
|
3
ba
|
0
sqft
|
built
1971
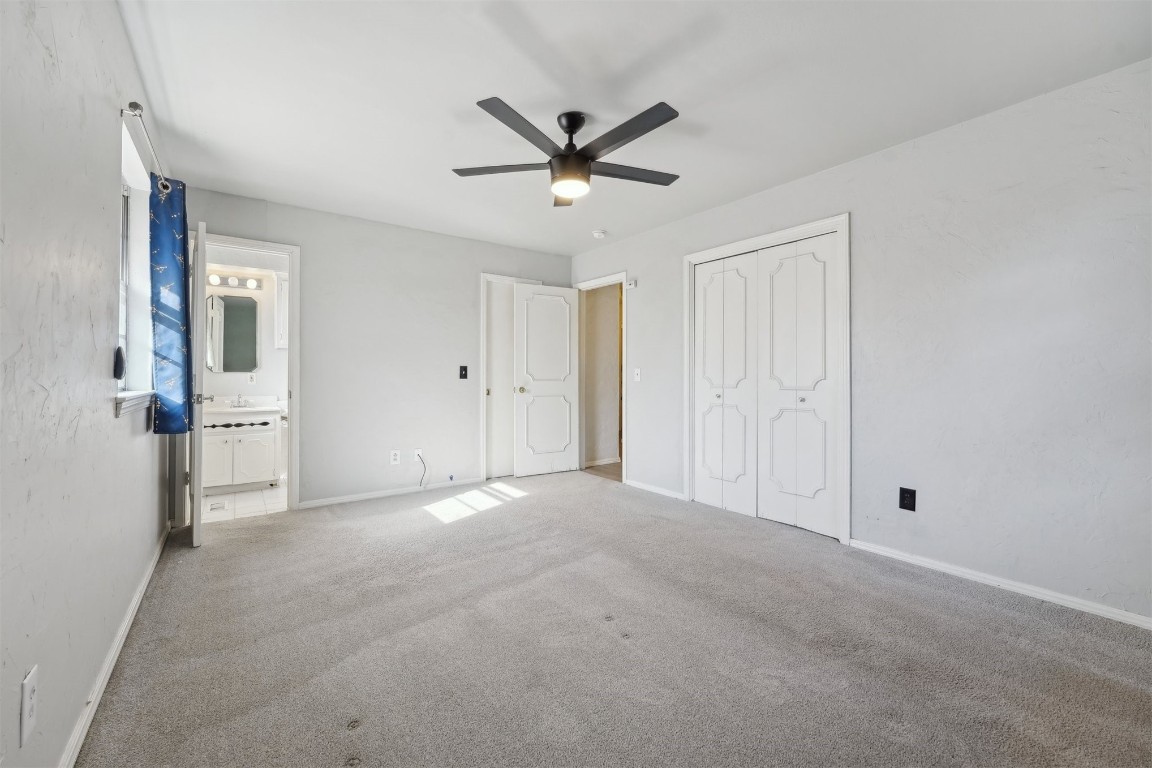
8712 N Kensington Rd, Oklahoma City, OK 73132
$212
Cash flow
4.4%
Cash-on-Cash Return
6.7%
Cap rate
1.0%
Rent to Value Ratio
1,322 out of 1,685 properties for sale in Oklahoma City, OK
Limited Results Shown
Create a free account, or log in to reveal all property listings and enjoy the complete experience.
Active
$259,000
3
bds
|
2
ba
|
0
sqft
|
built
1978
11609 Century Dr, Oklahoma City, OK 73162
$-136
Cash flow
-2.7%
Cash-on-Cash Return
5.1%
Cap rate
0.8%
Rent to Value Ratio
Active
$152,000
3
bds
|
1
ba
|
0
sqft
|
built
1948
1321 Campbell Rd, Oklahoma City, OK 73111
$-3
Cash flow
-0.1%
Cash-on-Cash Return
5.7%
Cap rate
0.7%
Rent to Value Ratio
Active
$549,900
3
bds
|
4
ba
|
0
sqft
|
built
2023
1318 NW 15th St, Oklahoma City, OK 73106
$-187
Cash flow
-1.8%
Cash-on-Cash Return
5.3%
Cap rate
0.6%
Rent to Value Ratio
Active
$305,000
3
bds
|
2
ba
|
0
sqft
|
built
1959
2530 NW 51st St, Oklahoma City, OK 73112
$-491
Cash flow
-8.4%
Cash-on-Cash Return
3.7%
Cap rate
0.6%
Rent to Value Ratio

Active
$367,500
3
bds
|
2
ba
|
0
sqft
|
built
1961
3500 Treadwell Dr, Oklahoma City, OK 73112
$-382
Cash flow
-5.4%
Cash-on-Cash Return
4.4%
Cap rate
0.6%
Rent to Value Ratio
Active
$320,000
3
bds
|
2
ba
|
0
sqft
|
built
1978
12909 Saint Christopher Dr, Oklahoma City, OK 73120
$-357
Cash flow
-5.8%
Cash-on-Cash Return
4.3%
Cap rate
0.6%
Rent to Value Ratio
Active
$569,400
3
bds
|
4
ba
|
0
sqft
|
built
1992
2417 NE 100th St, Oklahoma City, OK 73131
$-948
Cash flow
-8.7%
Cash-on-Cash Return
3.7%
Cap rate
0.6%
Rent to Value Ratio
Active
$290,000
4
bds
|
2
ba
|
0
sqft
|
built
1931
3105 NW 22nd St, Oklahoma City, OK 73107
$185
Cash flow
3.3%
Cash-on-Cash Return
6.4%
Cap rate
0.9%
Rent to Value Ratio
Active
$370,000
4
bds
|
3
ba
|
0
sqft
|
built
1997
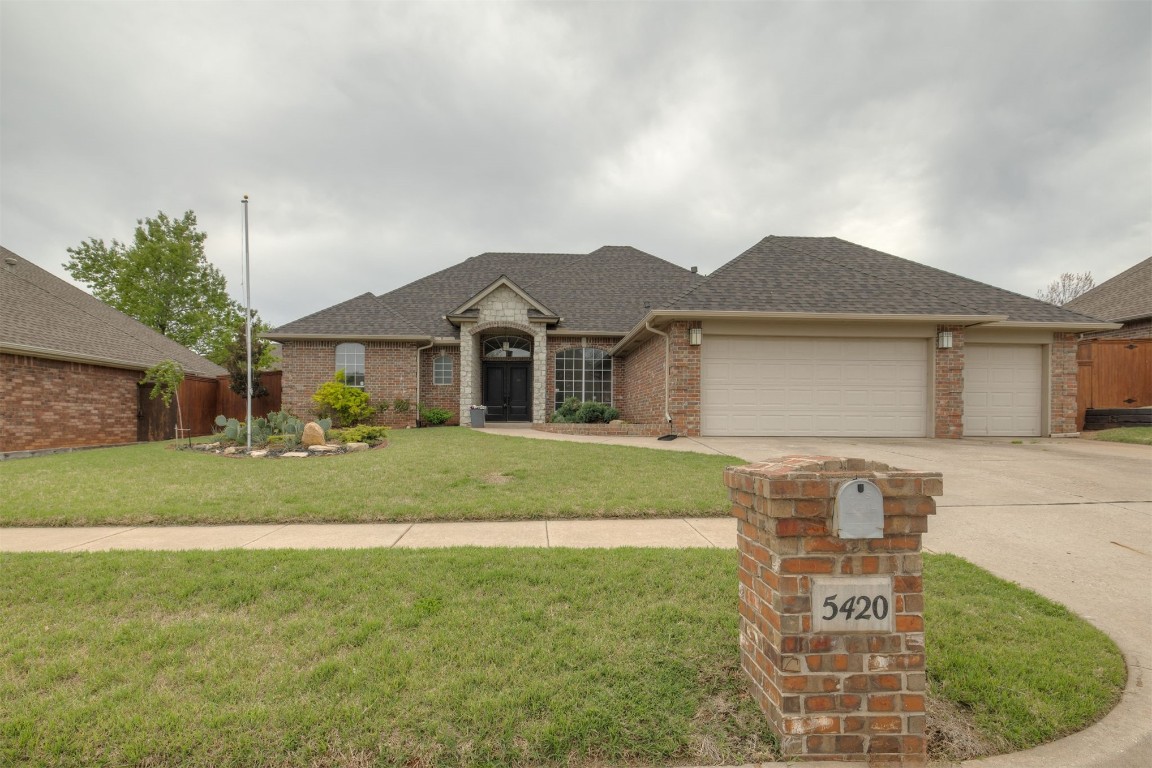
5420 NW 106th St, Oklahoma City, OK 73162
$-502
Cash flow
-7.1%
Cash-on-Cash Return
4.1%
Cap rate
0.6%
Rent to Value Ratio
Active
$370,000
3
bds
|
2
ba
|
0
sqft
|
built
1912
526 NW 32nd St, Oklahoma City, OK 73118
$-163
Cash flow
-2.3%
Cash-on-Cash Return
5.2%
Cap rate
0.8%
Rent to Value Ratio
Active
$469,000
4
bds
|
4
ba
|
0
sqft
|
built
2023
1301 NW 1st St, Oklahoma City, OK 73106
$-88
Cash flow
-1.0%
Cash-on-Cash Return
5.5%
Cap rate
0.7%
Rent to Value Ratio
Active
$249,900
3
bds
|
2
ba
|
0
sqft
|
built
1950
2813 Warwick Dr, Oklahoma City, OK 73116
$90
Cash flow
1.9%
Cash-on-Cash Return
6.1%
Cap rate
0.9%
Rent to Value Ratio
Active
$493,000
4
bds
|
3
ba
|
0
sqft
|
built
1915
714 NW 32nd St, Oklahoma City, OK 73118
$-465
Cash flow
-4.9%
Cash-on-Cash Return
4.5%
Cap rate
0.7%
Rent to Value Ratio

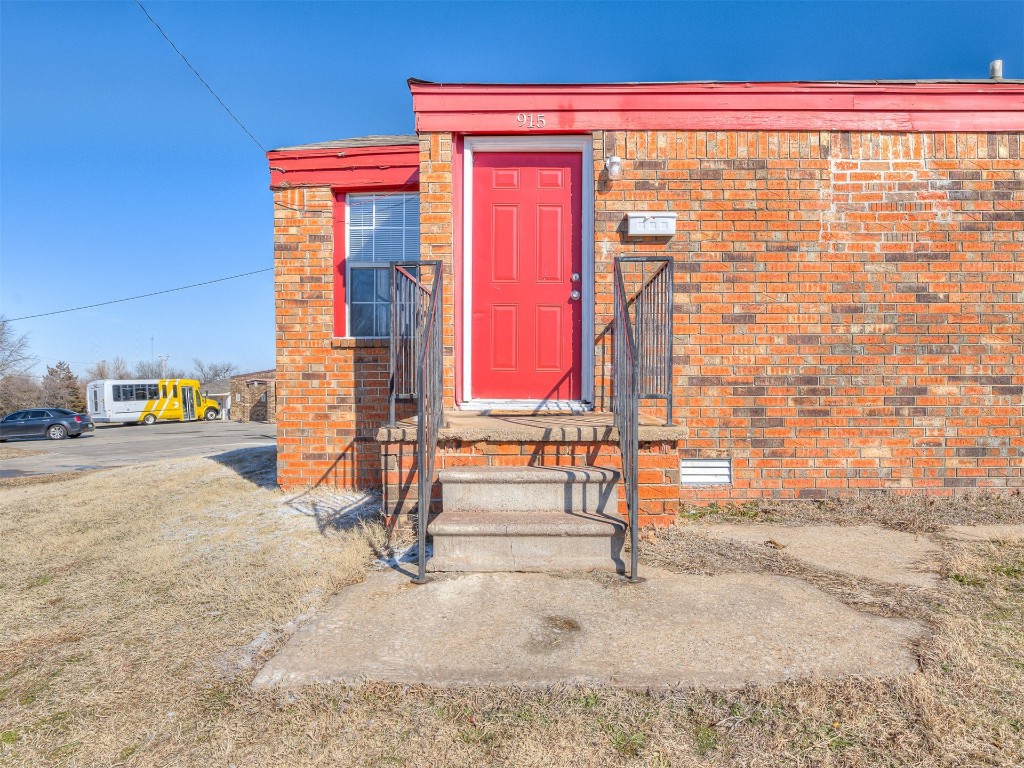
Active
$339,000
2
bds
|
2
ba
|
0
sqft
|
built
1910
915 NW 22nd St, Oklahoma City, OK 73106
$-651
Cash flow
-10.0%
Cash-on-Cash Return
3.4%
Cap rate
0.5%
Rent to Value Ratio
Active
$138,000
1
bds
|
1
ba
|
0
sqft
|
built
1983
14329 N Pennsylvania Ave, Oklahoma City, OK 73134
$-53
Cash flow
-2.0%
Cash-on-Cash Return
5.2%
Cap rate
0.9%
Rent to Value Ratio
Active
$300,000
4
bds
|
4
ba
|
0
sqft
|
built
1977
9718 Hummingbird Ln, Oklahoma City, OK 73162
$-13
Cash flow
-0.2%
Cash-on-Cash Return
5.6%
Cap rate
0.8%
Rent to Value Ratio
Active
$875,000
3
bds
|
3
ba
|
0
sqft
|
built
1981
2301 S Jamie Dr, Oklahoma City, OK 73170
$-2,196
Cash flow
-13.1%
Cash-on-Cash Return
2.7%
Cap rate
0.4%
Rent to Value Ratio
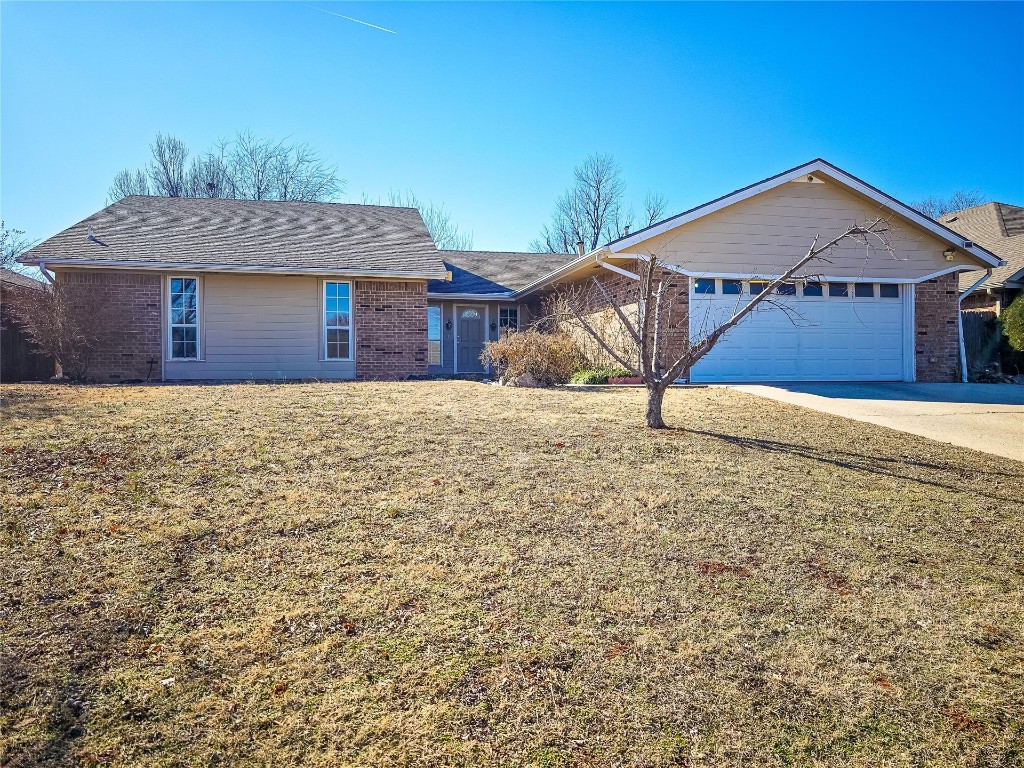
Active
$250,000
5
bds
|
3
ba
|
0
sqft
|
built
1971
8712 N Kensington Rd, Oklahoma City, OK 73132
$212
Cash flow
4.4%
Cash-on-Cash Return
6.7%
Cap rate
1.0%
Rent to Value Ratio

Active
$345,000
4
bds
|
3
ba
|
0
sqft
|
built
1960
401 Odom Rd, Oklahoma City, OK 73139
$-327
Cash flow
-4.9%
Cash-on-Cash Return
4.5%
Cap rate
0.7%
Rent to Value Ratio
Active
$205,000
3
bds
|
2
ba
|
0
sqft
|
built
1978
6716 Greenway Dr, Oklahoma City, OK 73132
$34
Cash flow
0.9%
Cash-on-Cash Return
5.9%
Cap rate
0.9%
Rent to Value Ratio
Active
$131,900
2
bds
|
2
ba
|
0
sqft
|
built
1980
915 E Hill St, Oklahoma City, OK 73105
$105
Cash flow
4.2%
Cash-on-Cash Return
6.6%
Cap rate
0.9%
Rent to Value Ratio
Active
$579,900
3
bds
|
3
ba
|
0
sqft
|
built
1930
1617 N Marion Ave, Oklahoma City, OK 73106
$-854
Cash flow
-7.7%
Cash-on-Cash Return
3.9%
Cap rate
0.6%
Rent to Value Ratio
Active
$289,900
5
bds
|
3
ba
|
0
sqft
|
built
1920
2233 NW 13th St, Oklahoma City, OK 73107
$365
Cash flow
6.6%
Cash-on-Cash Return
7.2%
Cap rate
1.0%
Rent to Value Ratio
Active
$180,000
3
bds
|
2
ba
|
0
sqft
|
built
1974
4612 Lunow Dr, Oklahoma City, OK 73135
$-16
Cash flow
-0.5%
Cash-on-Cash Return
5.6%
Cap rate
0.8%
Rent to Value Ratio
Active
$275,000
5
bds
|
2
ba
|
0
sqft
|
built
1920
2601 S May Ave, Oklahoma City, OK 73108
$113
Cash flow
2.1%
Cash-on-Cash Return
6.2%
Cap rate
0.8%
Rent to Value Ratio

Active
$374,900
3
bds
|
2
ba
|
0
sqft
|
built
1924
2225 NW 16th St, Oklahoma City, OK 73107
$49
Cash flow
0.7%
Cash-on-Cash Return
5.8%
Cap rate
0.8%
Rent to Value Ratio

Active
$250,000
3
bds
|
2
ba
|
0
sqft
|
built
2023
2425 SW 35th St, Oklahoma City, OK 73119
$46
Cash flow
1.0%
Cash-on-Cash Return
5.9%
Cap rate
0.7%
Rent to Value Ratio
Active
$240,000
3
bds
|
2
ba
|
0
sqft
|
built
1956
2916 Bird Dr, Oklahoma City, OK 73121
$155
Cash flow
3.4%
Cash-on-Cash Return
6.5%
Cap rate
0.8%
Rent to Value Ratio

Active
$249,900
3
bds
|
2
ba
|
0
sqft
|
built
1950
2737 Clermont Pl, Oklahoma City, OK 73116
$17
Cash flow
0.4%
Cash-on-Cash Return
5.8%
Cap rate
0.8%
Rent to Value Ratio
Active
$1,999,999
10
bds
|
13
ba
|
0
sqft
|
built
1936
729 NW 38th St, Oklahoma City, OK 73118
$-8,505
Cash flow
-22.2%
Cash-on-Cash Return
0.6%
Cap rate
0.2%
Rent to Value Ratio

Active
$250,000
2
bds
|
1
ba
|
0
sqft
|
built
1905
38 SE 21st St, Oklahoma City, OK 73129
$-355
Cash flow
-7.4%
Cash-on-Cash Return
4.0%
Cap rate
0.5%
Rent to Value Ratio

Active
$223,500
3
bds
|
3
ba
|
0
sqft
|
built
1965
6428 S Drexel Ave, Oklahoma City, OK 73159
$152
Cash flow
3.5%
Cash-on-Cash Return
6.5%
Cap rate
0.8%
Rent to Value Ratio
Active
$233,500
3
bds
|
1
ba
|
0
sqft
|
built
1939
3800 Key Pl, Oklahoma City, OK 73112
$-92
Cash flow
-2.1%
Cash-on-Cash Return
5.2%
Cap rate
0.7%
Rent to Value Ratio

Active
$295,333
6
bds
|
2
ba
|
0
sqft
|
built
1978
8201 NW 90th Ter, Oklahoma City, OK 73132
$-181
Cash flow
-3.2%
Cash-on-Cash Return
4.9%
Cap rate
0.7%
Rent to Value Ratio
Active
$572,999
3
bds
|
3
ba
|
0
sqft
|
built
1921
1322 NW 21st St, Oklahoma City, OK 73106
$-1,040
Cash flow
-9.5%
Cash-on-Cash Return
3.5%
Cap rate
0.5%
Rent to Value Ratio

Active
$299,950
3
bds
|
3
ba
|
0
sqft
|
built
1966
6704 Tall Oaks Dr, Oklahoma City, OK 73127
$-188
Cash flow
-3.3%
Cash-on-Cash Return
4.9%
Cap rate
0.7%
Rent to Value Ratio
Active
$208,000
2
bds
|
2
ba
|
0
sqft
|
built
1962
4412 NW 57th St, Oklahoma City, OK 73112
$-89
Cash flow
-2.2%
Cash-on-Cash Return
5.2%
Cap rate
0.8%
Rent to Value Ratio

Active
$724,000
4
bds
|
4
ba
|
0
sqft
|
built
1930
1917 N Shartel Ave, Oklahoma City, OK 73103
$-1,554
Cash flow
-11.2%
Cash-on-Cash Return
3.1%
Cap rate
0.5%
Rent to Value Ratio
Active
$239,995
3
bds
|
3
ba
|
0
sqft
|
built
1998
6813 NW 133rd Ter, Oklahoma City, OK 73142
$-417
Cash flow
-9.1%
Cash-on-Cash Return
3.6%
Cap rate
0.6%
Rent to Value Ratio
Active
$456,000
3
bds
|
3
ba
|
0
sqft
|
built
2012
14509 Almond Valley Dr, Oklahoma City, OK 73165
$-734
Cash flow
-8.4%
Cash-on-Cash Return
3.7%
Cap rate
0.6%
Rent to Value Ratio