Olive Branch, MS Investment Properties for Sale
Browse homes for sale and investment properties in Olive Branch, MS. Refine your search by price, property type, or more.
Best cash flowing properties in Olive Branch, MS
Active
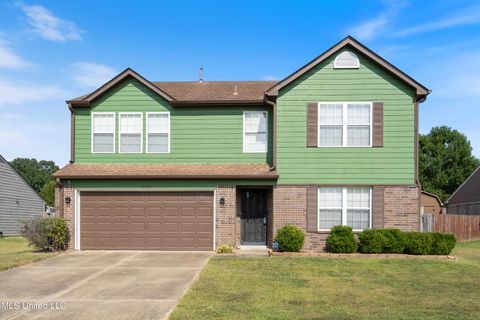
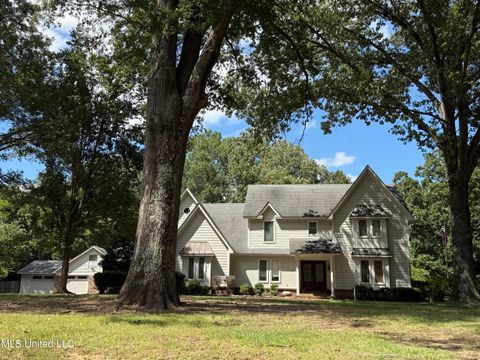
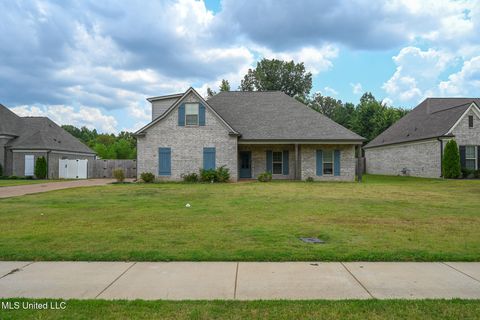
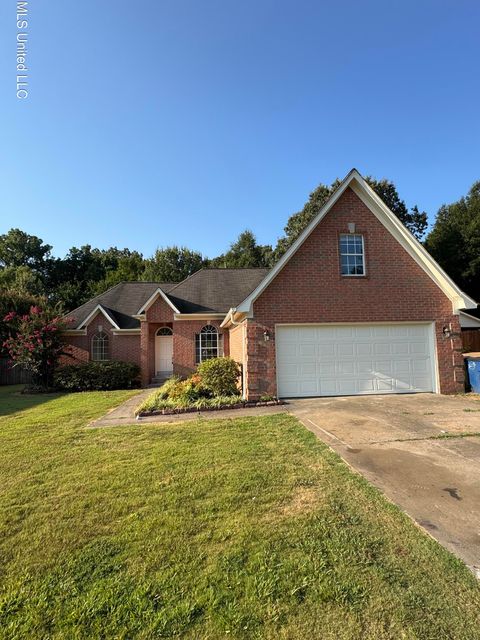
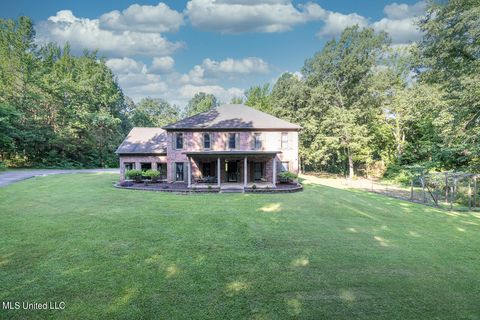
$360,000
5
bds
|
3
ba
|
0
sqft
|
built
2002
7338 Hunters Horn Dr, Olive Branch, MS 38654
$142
Cash flow
2.1%
Cash-on-Cash Return
6.2%
Cap rate
0.8%
Rent to Value Ratio
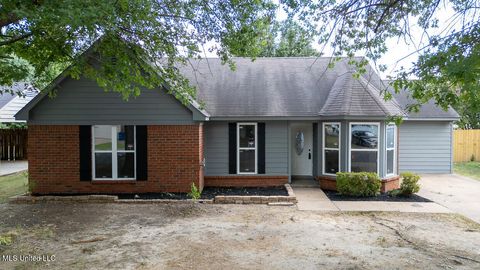
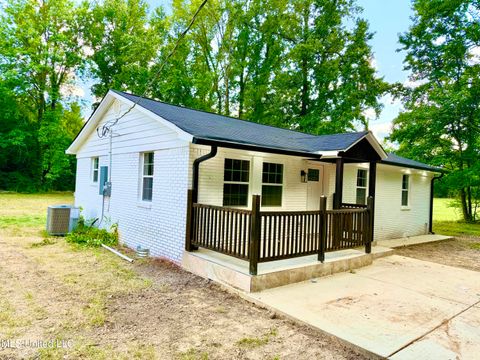
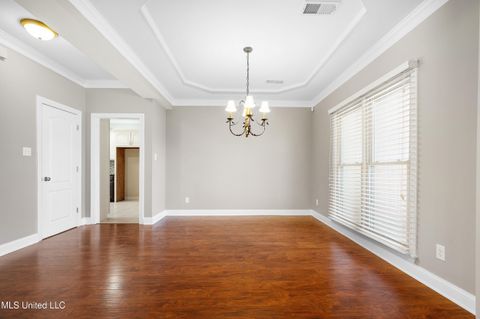
Active
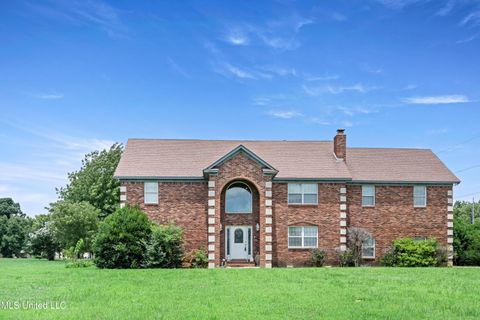
$235,000
3
bds
|
2
ba
|
0
sqft
|
built
1993
10335 Yates Dr, Olive Branch, MS 38654
$72
Cash flow
1.6%
Cash-on-Cash Return
6.0%
Cap rate
0.8%
Rent to Value Ratio
94 out of 103 properties for sale in Olive Branch, MS
Limited Results Shown
Create a free account, or log in to reveal all property listings and enjoy the complete experience.
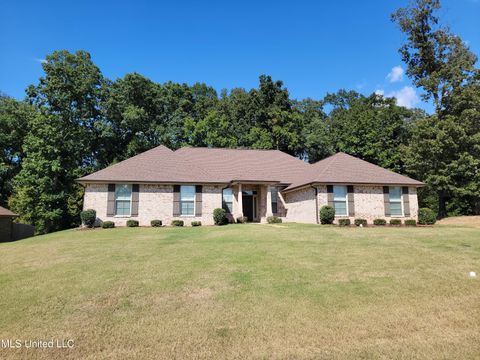
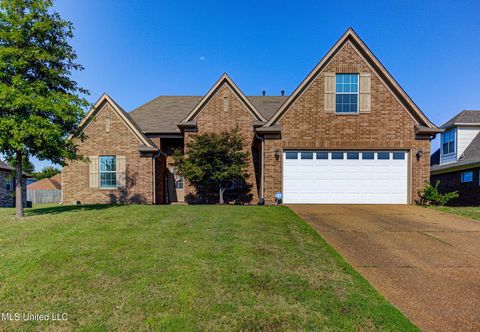
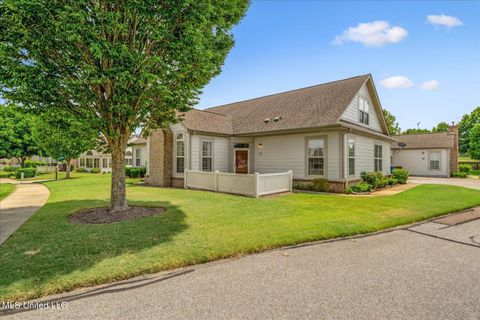
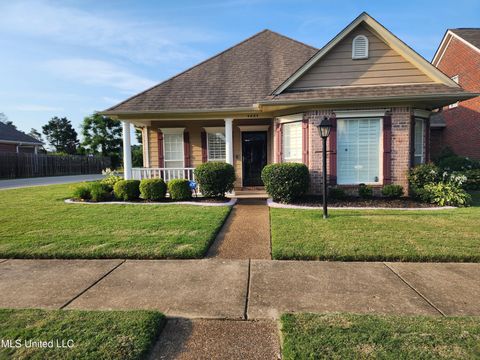
Active
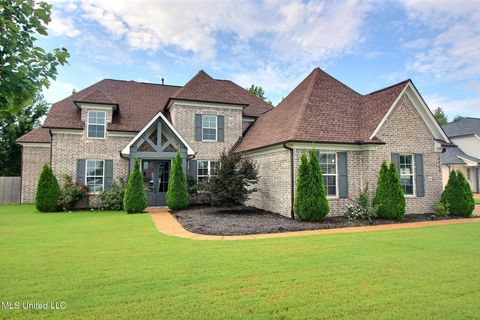
$375,000
4
bds
|
3
ba
|
0
sqft
|
built
2020
9598 Nielsen Dr, Olive Branch, MS 38654
$-202
Cash flow
-2.8%
Cash-on-Cash Return
5.0%
Cap rate
0.7%
Rent to Value Ratio
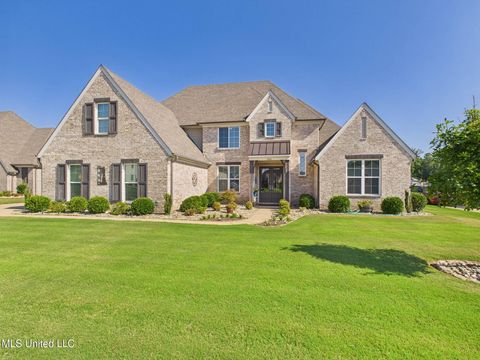
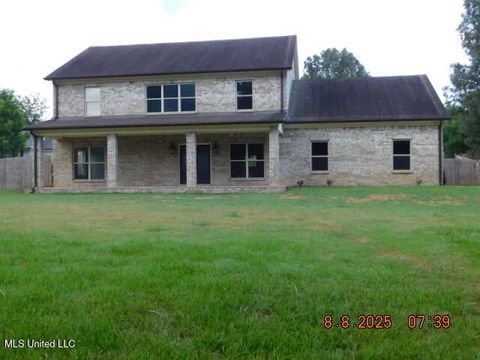
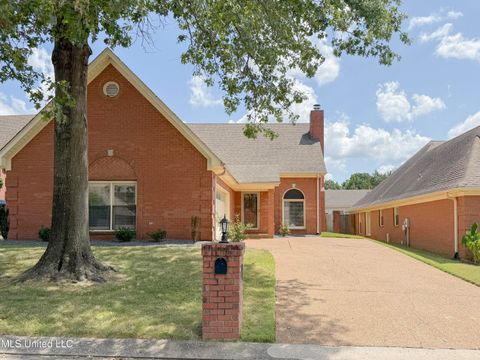
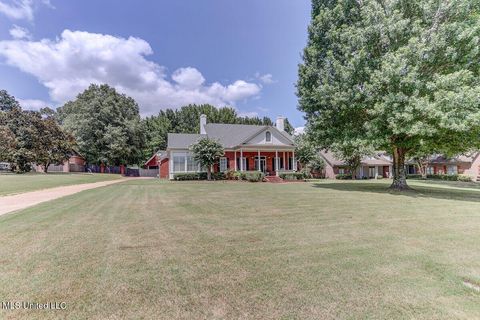
Active
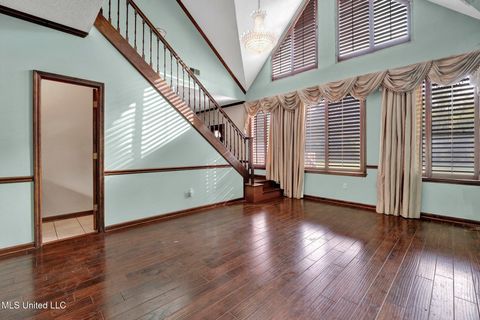
$465,000
4
bds
|
3
ba
|
0
sqft
|
built
2020
4410 John Joseph Dr, Olive Branch, MS 38654
$-107
Cash flow
-1.2%
Cash-on-Cash Return
5.4%
Cap rate
0.8%
Rent to Value Ratio
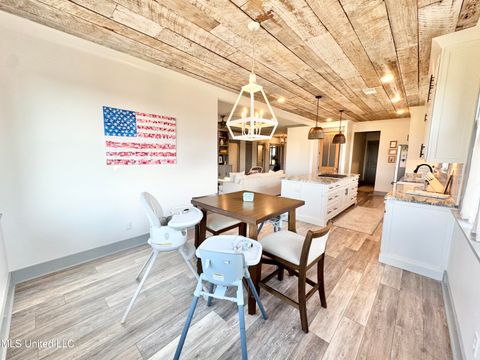
Active
$599,900
4
bds
|
4
ba
|
0
sqft
|
built
1985
8870 Collinswood Dr, Olive Branch, MS 38654
$-1,110
Cash flow
-9.7%
Cash-on-Cash Return
3.5%
Cap rate
0.5%
Rent to Value Ratio

Active
$550,000
5
bds
|
4
ba
|
0
sqft
|
built
1994
6880 Autumn Oaks Dr, Olive Branch, MS 38654
$-368
Cash flow
-3.5%
Cash-on-Cash Return
4.9%
Cap rate
0.7%
Rent to Value Ratio

Active
$340,000
3
bds
|
3
ba
|
0
sqft
|
built
1984
3575 Shady Oaks Dr, Olive Branch, MS 38654
$-268
Cash flow
-4.1%
Cash-on-Cash Return
4.7%
Cap rate
0.6%
Rent to Value Ratio
Active
$350,000
5
bds
|
4
ba
|
0
sqft
|
built
2000
10668 Stark Acres Rd, Olive Branch, MS 38654
$-133
Cash flow
-2.0%
Cash-on-Cash Return
5.2%
Cap rate
0.7%
Rent to Value Ratio
Active
$569,900
5
bds
|
3
ba
|
0
sqft
|
built
2020
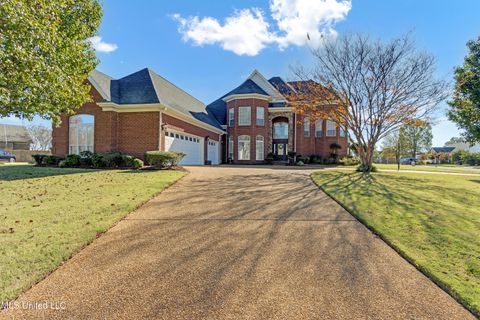
6729 Farm Cv, Olive Branch, MS 38654
$-796
Cash flow
-7.3%
Cash-on-Cash Return
4.0%
Cap rate
0.6%
Rent to Value Ratio
Active
$425,000
5
bds
|
5
ba
|
0
sqft
|
built
2002
8939 Youngblood Rd, Olive Branch, MS 38654
$-256
Cash flow
-3.1%
Cash-on-Cash Return
5.0%
Cap rate
0.7%
Rent to Value Ratio
Active
$399,900
4
bds
|
2
ba
|
0
sqft
|
built
2021
5217 Nail Rd, Olive Branch, MS 38654
$-364
Cash flow
-4.7%
Cash-on-Cash Return
4.6%
Cap rate
0.6%
Rent to Value Ratio
Active
$329,900
4
bds
|
2
ba
|
0
sqft
|
built
2015
9097 Gavin Dr, Olive Branch, MS 38654
$-180
Cash flow
-2.8%
Cash-on-Cash Return
5.0%
Cap rate
0.7%
Rent to Value Ratio
Active
$479,000
5
bds
|
3
ba
|
0
sqft
|
built
2016
8511 Byhalia Rd, Olive Branch, MS 38654
$-589
Cash flow
-6.4%
Cash-on-Cash Return
4.2%
Cap rate
0.6%
Rent to Value Ratio

Active
$279,900
3
bds
|
2
ba
|
0
sqft
|
built
1990
6650 Player Dr, Olive Branch, MS 38654
$34
Cash flow
0.6%
Cash-on-Cash Return
5.8%
Cap rate
0.8%
Rent to Value Ratio

Active
$364,900
4
bds
|
3
ba
|
0
sqft
|
built
2000
7056 Apache Dr, Olive Branch, MS 38654
$-139
Cash flow
-2.0%
Cash-on-Cash Return
5.2%
Cap rate
0.7%
Rent to Value Ratio
Active
$569,900
4
bds
|
4
ba
|
0
sqft
|
built
2022
6790 Farm Cv, Olive Branch, MS 38654
$-151
Cash flow
-1.4%
Cash-on-Cash Return
5.4%
Cap rate
0.7%
Rent to Value Ratio
Active
$299,900
3
bds
|
2
ba
|
0
sqft
|
built
1996
8853 Bell Ridge Dr, Olive Branch, MS 38654
$-50
Cash flow
-0.9%
Cash-on-Cash Return
5.5%
Cap rate
0.7%
Rent to Value Ratio
Active
$250,000
3
bds
|
2
ba
|
0
sqft
|
built
1975
14679 Burton Rd, Olive Branch, MS 38654
$-183
Cash flow
-3.8%
Cash-on-Cash Return
4.8%
Cap rate
0.6%
Rent to Value Ratio
Active
$295,000
3
bds
|
3
ba
|
0
sqft
|
built
2008
8817 Parkview Oaks Cir, Olive Branch, MS 38654
$-74
Cash flow
-1.3%
Cash-on-Cash Return
5.4%
Cap rate
0.7%
Rent to Value Ratio
Active
$359,900
3
bds
|
3
ba
|
0
sqft
|
built
1993
6570 Masters Dr, Olive Branch, MS 38654
$-205
Cash flow
-3.0%
Cash-on-Cash Return
5.0%
Cap rate
0.6%
Rent to Value Ratio
Active
$650,000
5
bds
|
4
ba
|
0
sqft
|
built
2000
3981 Pleasant Hill Rd, Olive Branch, MS 38654
$-689
Cash flow
-5.5%
Cash-on-Cash Return
4.4%
Cap rate
0.5%
Rent to Value Ratio
Active
$460,000
5
bds
|
4
ba
|
0
sqft
|
built
2001
4985 Bobo Pl, Olive Branch, MS 38654
$-259
Cash flow
-2.9%
Cash-on-Cash Return
5.0%
Cap rate
0.7%
Rent to Value Ratio
Active
$330,000
3
bds
|
2
ba
|
0
sqft
|
built
2003
4885 Stone Cross Dr, Olive Branch, MS 38654
$-120
Cash flow
-1.9%
Cash-on-Cash Return
5.2%
Cap rate
0.7%
Rent to Value Ratio
Active
$569,900
4
bds
|
4
ba
|
0
sqft
|
built
1998
5460 Wedgewood Dr, Olive Branch, MS 38654
$-801
Cash flow
-7.3%
Cash-on-Cash Return
4.0%
Cap rate
0.5%
Rent to Value Ratio
Active
$665,000
5
bds
|
4
ba
|
0
sqft
|
built
2003
6550 Shenandoah Ln, Olive Branch, MS 38654
$-559
Cash flow
-4.4%
Cash-on-Cash Return
4.7%
Cap rate
0.7%
Rent to Value Ratio
Active
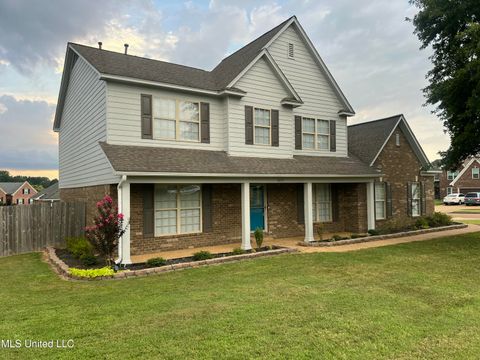
$399,900
5
bds
|
3
ba
|
0
sqft
|
built
2025
4213 Sidlehill Dr, Olive Branch, MS 38654
$-201
Cash flow
-2.6%
Cash-on-Cash Return
5.1%
Cap rate
0.7%
Rent to Value Ratio
Active
$260,000
3
bds
|
2
ba
|
0
sqft
|
built
1998
9821 Morgan Manor Dr, Olive Branch, MS 38654
$-39
Cash flow
-0.8%
Cash-on-Cash Return
5.5%
Cap rate
0.7%
Rent to Value Ratio

Active
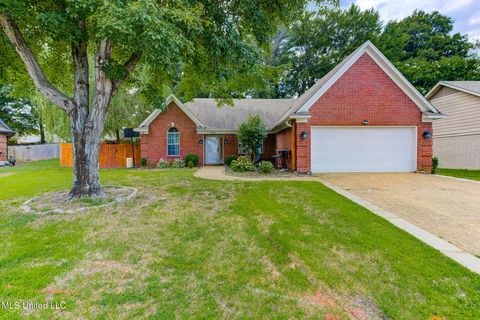
$282,500
3
bds
|
2
ba
|
0
sqft
|
built
2017
7880 Allenwood Ln, Olive Branch, MS 38654
$-201
Cash flow
-3.7%
Cash-on-Cash Return
4.8%
Cap rate
0.6%
Rent to Value Ratio
Active
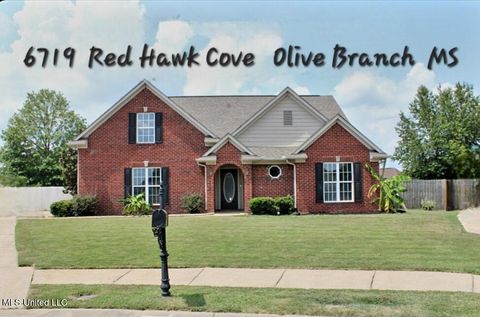
$399,500
5
bds
|
3
ba
|
0
sqft
|
built
2004
6719 Red Hawk Cv, Olive Branch, MS 38654
$-329
Cash flow
-4.3%
Cash-on-Cash Return
4.7%
Cap rate
0.6%
Rent to Value Ratio
Active
$334,000
3
bds
|
2
ba
|
0
sqft
|
built
1996
8823 Bell Forrest Dr, Olive Branch, MS 38654
$-191
Cash flow
-3.0%
Cash-on-Cash Return
5.0%
Cap rate
0.7%
Rent to Value Ratio

Active
$499,900
3
bds
|
3
ba
|
0
sqft
|
built
1988
9095 Willow Branch Dr, Olive Branch, MS 38654
$-590
Cash flow
-6.2%
Cash-on-Cash Return
4.3%
Cap rate
0.6%
Rent to Value Ratio
Active
$239,900
3
bds
|
2
ba
|
0
sqft
|
built
1997
10625 Kristen Dr, Olive Branch, MS 38654
$41
Cash flow
0.9%
Cash-on-Cash Return
5.9%
Cap rate
0.8%
Rent to Value Ratio
Active
$615,000
5
bds
|
4
ba
|
0
sqft
|
built
1997
5035 Saint Andrews Cv, Olive Branch, MS 38654
$-747
Cash flow
-6.3%
Cash-on-Cash Return
4.2%
Cap rate
0.6%
Rent to Value Ratio
Active
$295,000
2
bds
|
2
ba
|
0
sqft
|
built
2015
8710 Parkview Oaks Cir, Olive Branch, MS 38654
$-413
Cash flow
-7.3%
Cash-on-Cash Return
4.0%
Cap rate
0.7%
Rent to Value Ratio
Active
$440,000
3
bds
|
3
ba
|
0
sqft
|
built
1994
6555 Masters Dr, Olive Branch, MS 38654
$-483
Cash flow
-5.7%
Cash-on-Cash Return
4.4%
Cap rate
0.6%
Rent to Value Ratio

Active
$259,900
3
bds
|
2
ba
|
0
sqft
|
built
2003
9759 Pigeon Roost Park Cir, Olive Branch, MS 38654
$-32
Cash flow
-0.6%
Cash-on-Cash Return
5.5%
Cap rate
0.7%
Rent to Value Ratio

Active
$409,900
4
bds
|
2
ba
|
0
sqft
|
built
2024
4990 Witt Cv, Olive Branch, MS 38654
$-398
Cash flow
-5.1%
Cash-on-Cash Return
4.5%
Cap rate
0.6%
Rent to Value Ratio

Active
$795,000
3
bds
|
5
ba
|
0
sqft
|
built
2020
1615 Highway 305 N, Olive Branch, MS 38654
$-1,499
Cash flow
-9.8%
Cash-on-Cash Return
3.4%
Cap rate
0.5%
Rent to Value Ratio

Active
$369,000
5
bds
|
3
ba
|
0
sqft
|
built
2002
4333 Rocky Top Cv, Olive Branch, MS 38654
$64
Cash flow
0.9%
Cash-on-Cash Return
5.9%
Cap rate
0.8%
Rent to Value Ratio

Active
$525,000
5
bds
|
3
ba
|
0
sqft
|
built
1994
6760 Autumn Oaks Dr, Olive Branch, MS 38654
$-368
Cash flow
-3.7%
Cash-on-Cash Return
4.8%
Cap rate
0.7%
Rent to Value Ratio