Olive Branch, MS Investment Properties for Sale
Browse homes for sale and investment properties in Olive Branch, MS. Refine your search by price, property type, or more.
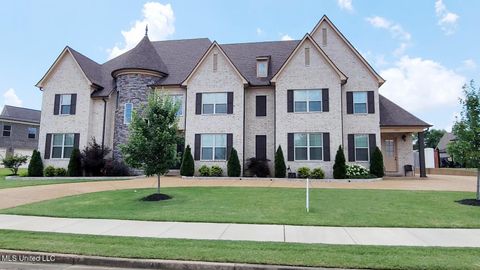
Best cash flowing properties in Olive Branch, MS

Active
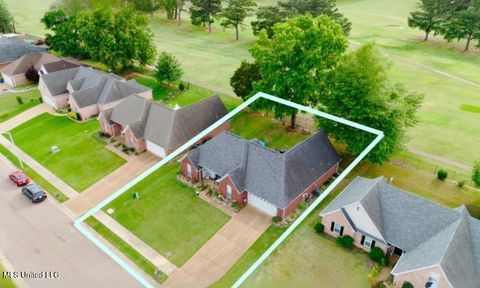
$289,900
3
bds
|
2
ba
|
0
sqft
|
built
2007
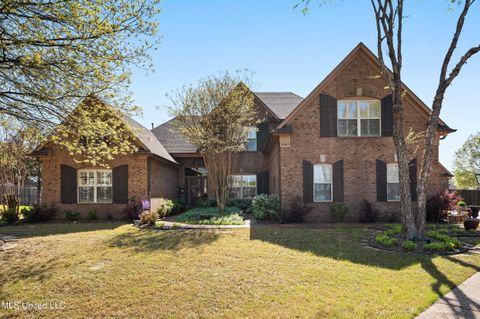
4458 Stone Park Blvd, Olive Branch, MS 38654
$-49
Cash flow
-0.9%
Cash-on-Cash Return
6.1%
Cap rate
0.8%
Rent to Value Ratio

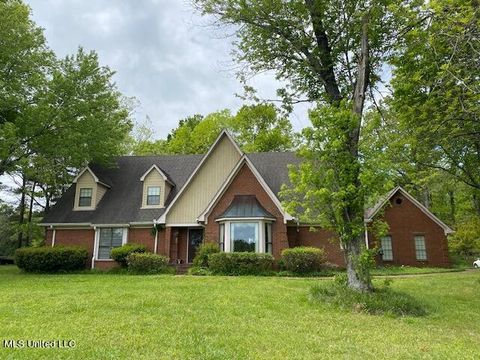
Active
$379,900
4
bds
|
3
ba
|
0
sqft
|
built
1990
5305 Tournament Dr, Olive Branch, MS 38654
$-69
Cash flow
-0.9%
Cash-on-Cash Return
6.0%
Cap rate
0.8%
Rent to Value Ratio
160 out of 169 properties for sale in Olive Branch, MS
Limited Results Shown
Create a free account, or log in to reveal all property listings and enjoy the complete experience.

Active
$479,000
5
bds
|
4
ba
|
0
sqft
|
built
1975
8532 Cedar Crest Ln, Olive Branch, MS 38654
$-413
Cash flow
-4.5%
Cash-on-Cash Return
5.2%
Cap rate
0.7%
Rent to Value Ratio
Active
$342,900
4
bds
|
2
ba
|
0
sqft
|
built
2002
7741 Meadow Ridge Ln, Olive Branch, MS 38654
$-357
Cash flow
-5.4%
Cash-on-Cash Return
5.0%
Cap rate
0.7%
Rent to Value Ratio

Active
$329,900
3
bds
|
2
ba
|
0
sqft
|
built
2003
4891 Stone Cross Dr, Olive Branch, MS 38654
$-372
Cash flow
-5.9%
Cash-on-Cash Return
4.9%
Cap rate
0.7%
Rent to Value Ratio

Active
$469,500
4
bds
|
3
ba
|
0
sqft
|
built
2021
9653 Trenton Trl, Olive Branch, MS 38654
$-673
Cash flow
-7.5%
Cash-on-Cash Return
4.5%
Cap rate
0.6%
Rent to Value Ratio

Pending
$390,900
4
bds
|
4
ba
|
0
sqft
|
built
1987
6401 Northwood Cv, Olive Branch, MS 38654
$-549
Cash flow
-7.3%
Cash-on-Cash Return
4.6%
Cap rate
0.6%
Rent to Value Ratio
Active
$289,900
3
bds
|
2
ba
|
0
sqft
|
built
2007
4458 Stone Park Blvd, Olive Branch, MS 38654
$-49
Cash flow
-0.9%
Cash-on-Cash Return
6.1%
Cap rate
0.8%
Rent to Value Ratio

Active
$399,900
4
bds
|
3
ba
|
0
sqft
|
built
2006
7199 Terrace Stone Dr, Olive Branch, MS 38654
$-419
Cash flow
-5.5%
Cash-on-Cash Return
5.0%
Cap rate
0.7%
Rent to Value Ratio
Active
$1,100,000
5
bds
|
5
ba
|
0
sqft
|
built
1993
12965 Whispering Pines Dr, Olive Branch, MS 38654
$-3,228
Cash flow
-15.3%
Cash-on-Cash Return
2.7%
Cap rate
0.4%
Rent to Value Ratio

Active
$365,000
3
bds
|
3
ba
|
0
sqft
|
built
1998
9082 Fox Cv, Olive Branch, MS 38654
$-340
Cash flow
-4.9%
Cash-on-Cash Return
5.1%
Cap rate
0.7%
Rent to Value Ratio
Active
$544,900
4
bds
|
3
ba
|
0
sqft
|
built
2016
4342 Robinson Loop E, Olive Branch, MS 38654
$-468
Cash flow
-4.5%
Cash-on-Cash Return
5.2%
Cap rate
0.7%
Rent to Value Ratio

Pending
$382,800
3
bds
|
3
ba
|
0
sqft
|
built
1997
9476 Plantation Rd, Olive Branch, MS 38654
$-560
Cash flow
-7.6%
Cash-on-Cash Return
4.5%
Cap rate
0.6%
Rent to Value Ratio

Pending
$459,900
5
bds
|
4
ba
|
0
sqft
|
built
1991
7883 Germantown Rd, Olive Branch, MS 38654
$-399
Cash flow
-4.5%
Cash-on-Cash Return
5.2%
Cap rate
0.7%
Rent to Value Ratio

Active
$399,900
4
bds
|
3
ba
|
0
sqft
|
built
1996
4481 Summers Place Dr, Olive Branch, MS 38654
$-885
Cash flow
-11.5%
Cash-on-Cash Return
3.6%
Cap rate
0.5%
Rent to Value Ratio

Pending
$310,000
4
bds
|
2
ba
|
0
sqft
|
built
1978
9750 Quail Rd, Olive Branch, MS 38654
$-285
Cash flow
-4.8%
Cash-on-Cash Return
5.2%
Cap rate
0.6%
Rent to Value Ratio
Active
$413,500
4
bds
|
3
ba
|
0
sqft
|
built
2014
4120 Mitchell Pl, Olive Branch, MS 38654
$-483
Cash flow
-6.1%
Cash-on-Cash Return
4.9%
Cap rate
0.7%
Rent to Value Ratio
Active
$334,000
3
bds
|
2
ba
|
0
sqft
|
built
1996
8823 Bell Forrest Dr, Olive Branch, MS 38654
$-354
Cash flow
-5.5%
Cash-on-Cash Return
5.0%
Cap rate
0.7%
Rent to Value Ratio

Active
$285,000
4
bds
|
3
ba
|
0
sqft
|
built
2001
9192 Rachel Shea Ave, Olive Branch, MS 38654
$-79
Cash flow
-1.4%
Cash-on-Cash Return
5.9%
Cap rate
0.8%
Rent to Value Ratio

Active
$499,000
4
bds
|
3
ba
|
0
sqft
|
built
2023
3972 Fieldstream Dr N, Olive Branch, MS 38654
$-459
Cash flow
-4.8%
Cash-on-Cash Return
5.2%
Cap rate
0.7%
Rent to Value Ratio

Active
$579,999
4
bds
|
4
ba
|
0
sqft
|
built
2014
4833 Delbridge Ct E, Olive Branch, MS 38654
$-625
Cash flow
-5.6%
Cash-on-Cash Return
5.0%
Cap rate
0.7%
Rent to Value Ratio

Active
$842,500
6
bds
|
4
ba
|
0
sqft
|
built
1999
5138 Wedgewood Dr, Olive Branch, MS 38654
$-2,243
Cash flow
-13.9%
Cash-on-Cash Return
3.1%
Cap rate
0.5%
Rent to Value Ratio

Active
$415,000
4
bds
|
3
ba
|
0
sqft
|
built
2000
6384 Acree Woods Dr, Olive Branch, MS 38654
$-623
Cash flow
-7.8%
Cash-on-Cash Return
4.5%
Cap rate
0.6%
Rent to Value Ratio

Active
$380,000
4
bds
|
3
ba
|
0
sqft
|
built
2000
10065 Lacey Dr, Olive Branch, MS 38654
$-456
Cash flow
-6.3%
Cash-on-Cash Return
4.8%
Cap rate
0.7%
Rent to Value Ratio
Active
$584,000
6
bds
|
5
ba
|
0
sqft
|
built
2007
6222 Bear Cv N, Olive Branch, MS 38654
$-686
Cash flow
-6.1%
Cash-on-Cash Return
4.9%
Cap rate
0.7%
Rent to Value Ratio

Active
$365,000
5
bds
|
3
ba
|
0
sqft
|
built
2006
4650 Stone Park Blvd, Olive Branch, MS 38654
$-142
Cash flow
-2.0%
Cash-on-Cash Return
5.8%
Cap rate
0.8%
Rent to Value Ratio
Active
$469,000
4
bds
|
3
ba
|
0
sqft
|
built
2017
4281 Lundy Bnd E, Olive Branch, MS 38654
$-581
Cash flow
-6.5%
Cash-on-Cash Return
4.8%
Cap rate
0.7%
Rent to Value Ratio

Active
$815,000
5
bds
|
5
ba
|
0
sqft
|
built
2017
6742 Malone Rd, Olive Branch, MS 38654
$-2,257
Cash flow
-14.4%
Cash-on-Cash Return
2.9%
Cap rate
0.4%
Rent to Value Ratio
Active
$569,900
4
bds
|
4
ba
|
0
sqft
|
built
2022
6790 Farm Cv, Olive Branch, MS 38654
$-429
Cash flow
-3.9%
Cash-on-Cash Return
5.4%
Cap rate
0.7%
Rent to Value Ratio

Active
$449,000
3
bds
|
2
ba
|
0
sqft
|
built
1993
5126 Saint Andrews Cv, Olive Branch, MS 38654
$-123
Cash flow
-1.4%
Cash-on-Cash Return
5.9%
Cap rate
0.8%
Rent to Value Ratio

Active
$699,000
5
bds
|
4
ba
|
0
sqft
|
built
2004
6628 Sundance Dr, Olive Branch, MS 38654
$-722
Cash flow
-5.4%
Cash-on-Cash Return
5.0%
Cap rate
0.7%
Rent to Value Ratio

Active
$399,000
4
bds
|
3
ba
|
0
sqft
|
built
2015
8330 John Wood Ln, Olive Branch, MS 38654
$-337
Cash flow
-4.4%
Cash-on-Cash Return
5.3%
Cap rate
0.7%
Rent to Value Ratio
Active
$544,900
5
bds
|
3
ba
|
0
sqft
|
built
2005
4981 Waterstone Cv, Olive Branch, MS 38654
$-539
Cash flow
-5.2%
Cash-on-Cash Return
5.1%
Cap rate
0.7%
Rent to Value Ratio
Active
$979,000
5
bds
|
4
ba
|
0
sqft
|
built
2022
4367 Whisper Trl, Olive Branch, MS 38654
$-1,831
Cash flow
-9.8%
Cash-on-Cash Return
4.0%
Cap rate
0.6%
Rent to Value Ratio

Pending
$569,000
5
bds
|
4
ba
|
0
sqft
|
built
2018
3387 Straw Bridge Rd, Olive Branch, MS 38654
$-506
Cash flow
-4.6%
Cash-on-Cash Return
5.2%
Cap rate
0.7%
Rent to Value Ratio

Active
$479,900
5
bds
|
4
ba
|
0
sqft
|
built
2005
3344 Belmor Xing, Olive Branch, MS 38654
$-608
Cash flow
-6.6%
Cash-on-Cash Return
4.7%
Cap rate
0.7%
Rent to Value Ratio
Active
$379,900
4
bds
|
3
ba
|
0
sqft
|
built
1990
5305 Tournament Dr, Olive Branch, MS 38654
$-69
Cash flow
-0.9%
Cash-on-Cash Return
6.0%
Cap rate
0.8%
Rent to Value Ratio

Active
$370,000
5
bds
|
4
ba
|
0
sqft
|
built
2000
10668 Stark Acres Rd, Olive Branch, MS 38654
$-324
Cash flow
-4.6%
Cash-on-Cash Return
5.2%
Cap rate
0.7%
Rent to Value Ratio

Active
$634,900
5
bds
|
4
ba
|
0
sqft
|
built
2003
8679 Saddlecreek Dr, Olive Branch, MS 38654
$-944
Cash flow
-7.8%
Cash-on-Cash Return
4.5%
Cap rate
0.6%
Rent to Value Ratio

Active
$499,900
5
bds
|
5
ba
|
0
sqft
|
built
1993
3555 Bonner Dr, Olive Branch, MS 38654
$-416
Cash flow
-4.3%
Cash-on-Cash Return
5.3%
Cap rate
0.7%
Rent to Value Ratio

Active
$494,900
5
bds
|
5
ba
|
0
sqft
|
built
1996
7738 Windersgate Cir, Olive Branch, MS 38654
$-656
Cash flow
-6.9%
Cash-on-Cash Return
4.7%
Cap rate
0.6%
Rent to Value Ratio
Active
$625,000
3
bds
|
4
ba
|
0
sqft
|
built
1988
7235 Davidson Rd, Olive Branch, MS 38654
$-813
Cash flow
-6.8%
Cash-on-Cash Return
4.7%
Cap rate
0.6%
Rent to Value Ratio