Orange, TX Investment Properties for Sale
Browse homes for sale and investment properties in Orange, TX. Refine your search by price, property type, or more.
Best cash flowing properties in Orange, TX
Active
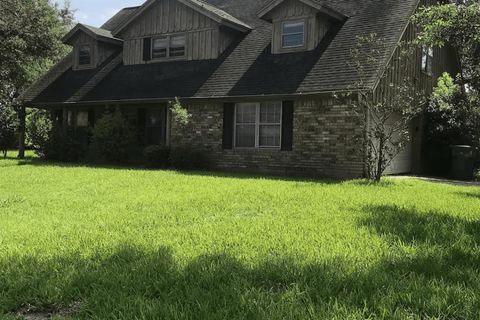
$275,000
6
bds
|
0
ba
|
3,194
sqft
|
built
1976
2800 Country Club Dr, Orange, TX 77630
$2,359
Cash flow
44.8%
Cash-on-Cash Return
16.6%
Cap rate
2.0%
Rent to Value Ratio
Active
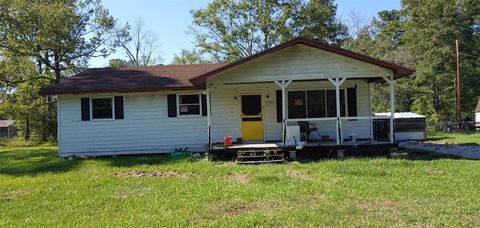
$174,000
3
bds
|
0
ba
|
1,320
sqft
|
built
1991
9743 Westbend, Orange, TX 77632
$1,368
Cash flow
41.0%
Cash-on-Cash Return
15.7%
Cap rate
2.1%
Rent to Value Ratio
67 out of 76 properties for sale in Orange, TX
Limited Results Shown
Create a free account, or log in to reveal all property listings and enjoy the complete experience.
Active
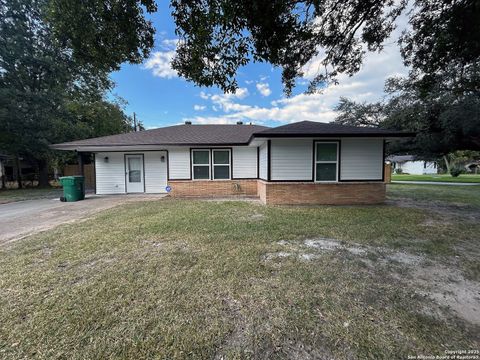
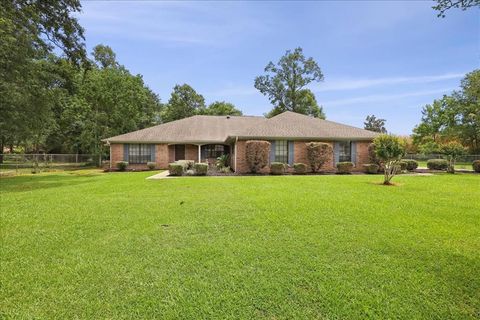
$219,000
3
bds
|
1
ba
|
1,281
sqft
|
built
1947
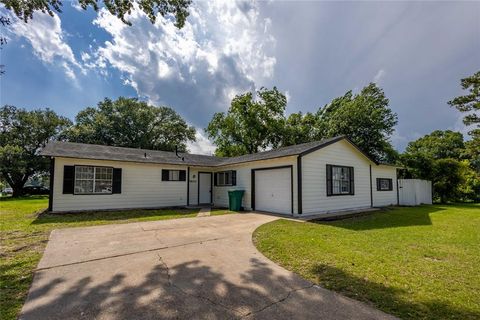
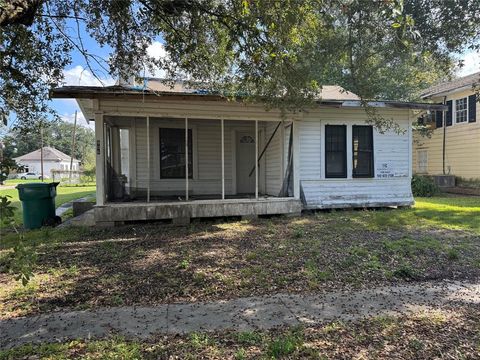
202 Azalea Ave, Orange, TX 77630
$-310
Cash flow
-7.4%
Cash-on-Cash Return
4.6%
Cap rate
0.6%
Rent to Value Ratio
Active
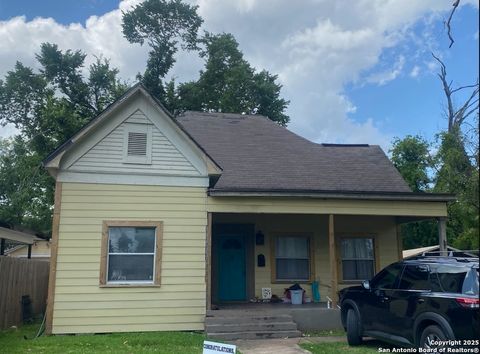
$99,000
3
bds
|
2
ba
|
2,212
sqft
|
built
1936
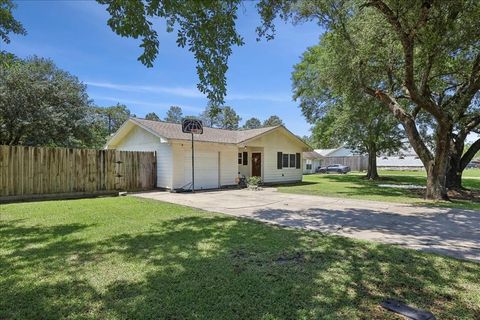
1202 Pine Ave, Orange, TX 77630
$349
Cash flow
18.4%
Cash-on-Cash Return
10.5%
Cap rate
1.6%
Rent to Value Ratio

Active
$112,200
3
bds
|
1
ba
|
1,410
sqft
|
built
1954
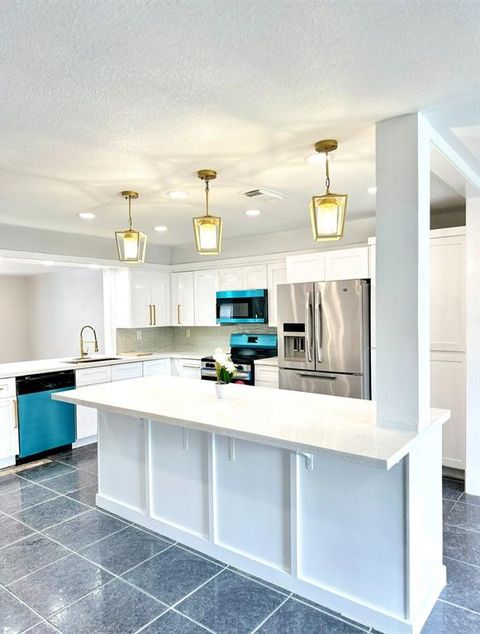
13 Byron Rd, Orange, TX 77630
$73
Cash flow
3.4%
Cash-on-Cash Return
7.0%
Cap rate
1.1%
Rent to Value Ratio
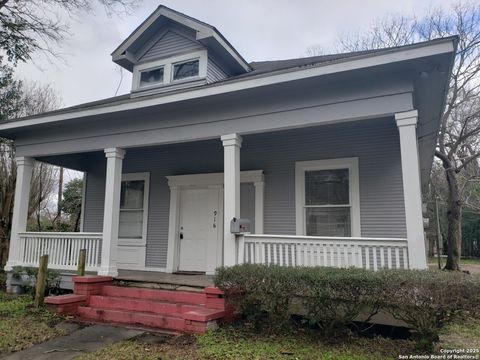
Active
$93,500
2
bds
|
1
ba
|
1,050
sqft
|
built
1930
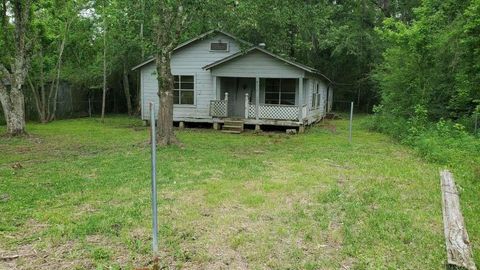
916 5th St, Orange, TX 77630
$292
Cash flow
16.3%
Cash-on-Cash Return
10.0%
Cap rate
1.4%
Rent to Value Ratio

Active
$159,500
4
bds
|
2
ba
|
1,660
sqft
|
built
1940
906 W Scott St, Orange, TX 77630
$-757
Cash flow
-24.8%
Cash-on-Cash Return
0.6%
Cap rate
1.0%
Rent to Value Ratio

Active
$185,000
3
bds
|
0
ba
|
1,730
sqft
|
built
1967
1808 Wilson Ave, Orange, TX 77632
$276
Cash flow
7.8%
Cash-on-Cash Return
8.1%
Cap rate
1.0%
Rent to Value Ratio

Active
$329,900
3
bds
|
0
ba
|
2,126
sqft
|
built
1987
4711 Burns Cir, Orange, TX 77630
$-342
Cash flow
-5.4%
Cash-on-Cash Return
5.0%
Cap rate
0.6%
Rent to Value Ratio

Active
$239,900
3
bds
|
0
ba
|
2,448
sqft
|
built
1967
3301 Pelican St, Orange, TX 77630
$10
Cash flow
0.2%
Cash-on-Cash Return
6.3%
Cap rate
1.0%
Rent to Value Ratio
Active
$129,000
3
bds
|
0
ba
|
2,640
sqft
|
built
1992
3911 Fm 1136, Orange, TX 77632
$210
Cash flow
8.5%
Cash-on-Cash Return
8.2%
Cap rate
1.4%
Rent to Value Ratio
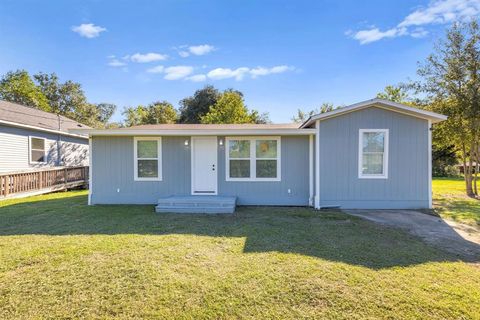
Active
$174,000
3
bds
|
0
ba
|
1,320
sqft
|
built
1991
9743 Westbend, Orange, TX 77632
$1,368
Cash flow
41.0%
Cash-on-Cash Return
15.7%
Cap rate
2.1%
Rent to Value Ratio

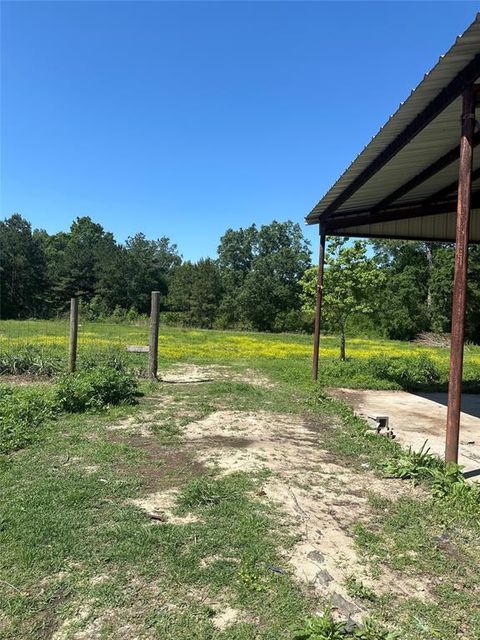
Active
$102,599
2
bds
|
0
ba
|
912
sqft
|
built
1982
7894 Alice St, Orange, TX 77632
$76
Cash flow
3.9%
Cash-on-Cash Return
7.2%
Cap rate
1.0%
Rent to Value Ratio

Active
$189,900
3
bds
|
0
ba
|
2,021
sqft
|
built
1958
1907 Link Ave, Orange, TX 77630
$-89
Cash flow
-2.4%
Cash-on-Cash Return
5.7%
Cap rate
0.9%
Rent to Value Ratio

Active
$65,000
3
bds
|
0
ba
|
1,424
sqft
|
built
1957
6168 Inez Ave, Orange, TX 77630
$889
Cash flow
15.9%
Cash-on-Cash Return
16.4%
Cap rate
2.0%
Rent to Value Ratio

Active
$75,999
1
bds
|
0
ba
|
536
sqft
|
built
1969
1205 Rein Ave, Orange, TX 77630
$209
Cash flow
14.3%
Cash-on-Cash Return
9.6%
Cap rate
1.3%
Rent to Value Ratio
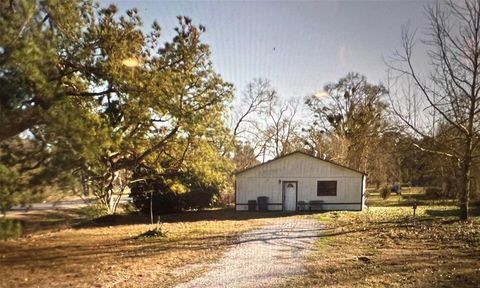
Active
$51,500
2
bds
|
0
ba
|
900
sqft
|
built
1980
9221 Oliver Rd, Orange, TX 77632
$529
Cash flow
12.0%
Cash-on-Cash Return
12.3%
Cap rate
1.7%
Rent to Value Ratio

Active
$485,000
5
bds
|
0
ba
|
4,943
sqft
|
built
1973
2719 Holcomb Rd, Orange, TX 77632
$-1,117
Cash flow
-12.0%
Cash-on-Cash Return
3.5%
Cap rate
0.6%
Rent to Value Ratio

Active
$699,900
5
bds
|
0
ba
|
4,087
sqft
|
built
1995
302 Waterwood Dr, Orange, TX 77630
$-3,058
Cash flow
-22.8%
Cash-on-Cash Return
1.0%
Cap rate
0.3%
Rent to Value Ratio
Active
$170,000
3
bds
|
0
ba
|
1,038
sqft
|
built
1949
1112 8th St, Orange, TX 77630
$82
Cash flow
2.5%
Cash-on-Cash Return
6.8%
Cap rate
0.9%
Rent to Value Ratio

Active
$165,000
3
bds
|
0
ba
|
1,691
sqft
|
built
1977
2017 5th St, Orange, TX 77630
$-89
Cash flow
-2.8%
Cash-on-Cash Return
5.6%
Cap rate
1.0%
Rent to Value Ratio

Active
$229,900
2
bds
|
0
ba
|
2,318
sqft
|
built
1989
3109 Pebble Beach Ln, Orange, TX 77630
$-120
Cash flow
-2.7%
Cash-on-Cash Return
5.6%
Cap rate
1.0%
Rent to Value Ratio

Active
$65,000
3
bds
|
0
ba
|
1,160
sqft
|
built
1948
2203 Norwood Dr, Orange, TX 77630
$781
Cash flow
14.0%
Cash-on-Cash Return
14.4%
Cap rate
2.0%
Rent to Value Ratio
Active
$109,997
3
bds
|
0
ba
|
0
sqft
|
built
1968
3600 Kenwood St, Orange, TX 77630
$530
Cash flow
25.1%
Cash-on-Cash Return
12.0%
Cap rate
1.5%
Rent to Value Ratio

Active
$115,000
3
bds
|
0
ba
|
1,519
sqft
|
built
1952
101 Azalea Ave, Orange, TX 77630
$217
Cash flow
9.8%
Cash-on-Cash Return
8.5%
Cap rate
1.2%
Rent to Value Ratio

Active
$229,900
3
bds
|
0
ba
|
3,043
sqft
|
built
1968
1903 W Sunset Dr, Orange, TX 77630
$-290
Cash flow
-6.6%
Cash-on-Cash Return
4.7%
Cap rate
0.9%
Rent to Value Ratio

Active
$659,900
4
bds
|
0
ba
|
3,615
sqft
|
built
2023
9472 Acadian Way, Orange, TX 77630
$-2,350
Cash flow
-18.6%
Cash-on-Cash Return
2.0%
Cap rate
0.4%
Rent to Value Ratio

Active
$279,900
4
bds
|
0
ba
|
3,032
sqft
|
built
1981
2918 Clark Cir, Orange, TX 77632
$264
Cash flow
4.9%
Cash-on-Cash Return
7.4%
Cap rate
0.9%
Rent to Value Ratio
Active
$149,900
3
bds
|
0
ba
|
1,096
sqft
|
built
1984
233 Spooner, Orange, TX 77630
$117
Cash flow
4.1%
Cash-on-Cash Return
7.2%
Cap rate
1.1%
Rent to Value Ratio

Active
$399,900
4
bds
|
0
ba
|
3,414
sqft
|
built
2005
305 Tyler Dr, Orange, TX 77630
$-943
Cash flow
-12.3%
Cash-on-Cash Return
3.4%
Cap rate
0.6%
Rent to Value Ratio
Active
$219,500
4
bds
|
0
ba
|
2,319
sqft
|
built
1955
312 Bridal Wreath Ave, Orange, TX 77630
$-153
Cash flow
-3.6%
Cash-on-Cash Return
5.4%
Cap rate
0.8%
Rent to Value Ratio

Active
$60,000
3
bds
|
0
ba
|
1,084
sqft
|
built
1950
2228 Norwood Dr, Orange, TX 77630
$716
Cash flow
13.9%
Cash-on-Cash Return
14.3%
Cap rate
2.0%
Rent to Value Ratio
Active
$59,499
3
bds
|
0
ba
|
1,655
sqft
|
built
1960
7128 Panther Run, Orange, TX 77632
$806
Cash flow
15.8%
Cash-on-Cash Return
16.3%
Cap rate
2.0%
Rent to Value Ratio
Active
$25,000
2
bds
|
0
ba
|
1,074
sqft
|
built
1925
906 6th St, Orange, TX 77630
$621
Cash flow
28.9%
Cash-on-Cash Return
29.8%
Cap rate
3.6%
Rent to Value Ratio
Active
$329,900
3
bds
|
0
ba
|
2,813
sqft
|
built
2007
6208 Rosewood Dr, Orange, TX 77632
$-759
Cash flow
-12.0%
Cash-on-Cash Return
3.5%
Cap rate
0.8%
Rent to Value Ratio
Active
$275,000
6
bds
|
0
ba
|
3,194
sqft
|
built
1976
2800 Country Club Dr, Orange, TX 77630
$2,359
Cash flow
44.8%
Cash-on-Cash Return
16.6%
Cap rate
2.0%
Rent to Value Ratio

Active
$425,000
4
bds
|
0
ba
|
2,108
sqft
|
built
2016
9671 Mistletoe Dr, Orange, TX 77630
$-1,197
Cash flow
-14.7%
Cash-on-Cash Return
2.9%
Cap rate
0.5%
Rent to Value Ratio

Active
$214,900
3
bds
|
0
ba
|
1,736
sqft
|
built
1969
1845 King Arthur Ct, Orange, TX 77630
$-184
Cash flow
-4.5%
Cash-on-Cash Return
5.2%
Cap rate
0.9%
Rent to Value Ratio

Active
$169,000
4
bds
|
0
ba
|
2,361
sqft
|
built
2000
4408 Highland Ave, Orange, TX 77632
$76
Cash flow
2.3%
Cash-on-Cash Return
6.8%
Cap rate
1.3%
Rent to Value Ratio

Active
$277,950
4
bds
|
0
ba
|
1,974
sqft
|
built
2019
4406 Sequoia Dr, Orange, TX 77630
$67
Cash flow
1.3%
Cash-on-Cash Return
6.6%
Cap rate
0.8%
Rent to Value Ratio

Active
$859,800
5
bds
|
0
ba
|
5,926
sqft
|
built
2001
145 Greenhead Pt, Orange, TX 77630
$-3,983
Cash flow
-24.2%
Cash-on-Cash Return
0.7%
Cap rate
0.3%
Rent to Value Ratio

Active
$599,999
3
bds
|
0
ba
|
2,548
sqft
|
built
2016
2210 Honey Bear Dr, Orange, TX 77632
$-1,131
Cash flow
-9.8%
Cash-on-Cash Return
4.0%
Cap rate
0.5%
Rent to Value Ratio