Orange, TX Investment Properties for Sale
Browse homes for sale and investment properties in Orange, TX. Refine your search by price, property type, or more.
Best cash flowing properties in Orange, TX
Active
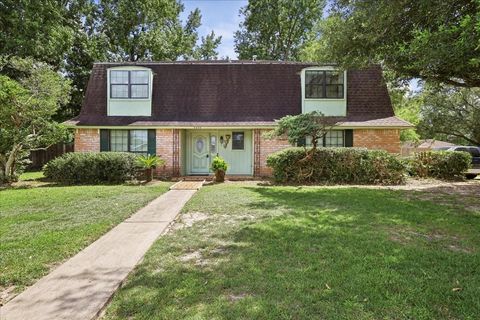
$275,000
6
bds
|
3
ba
|
3,194
sqft
|
built
1976
2800 Country Club Dr, Orange, TX 77630
$2,494
Cash flow
47.3%
Cash-on-Cash Return
16.6%
Cap rate
2.0%
Rent to Value Ratio
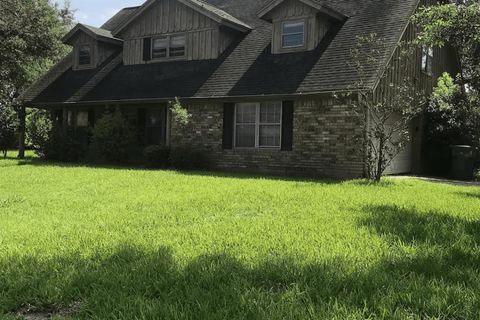
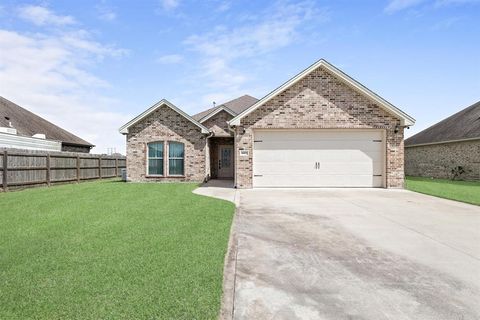
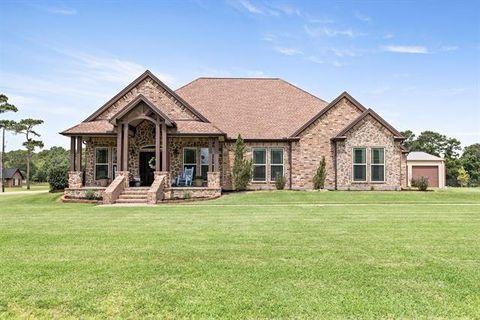
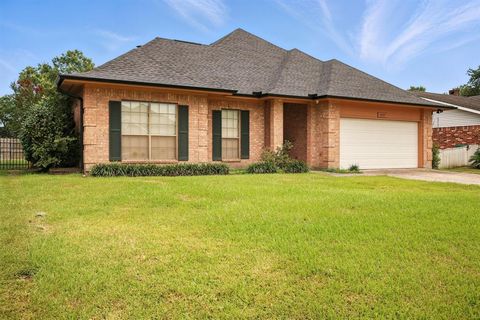
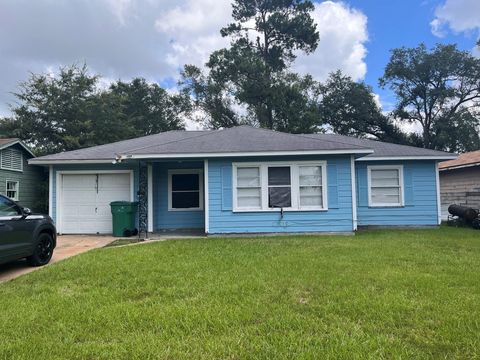
Active
$174,000
3
bds
|
2
ba
|
1,320
sqft
|
built
1991
9743 Westbend, Orange, TX 77632
$1,453
Cash flow
43.6%
Cash-on-Cash Return
15.7%
Cap rate
2.1%
Rent to Value Ratio
49 out of 66 properties for sale in Orange, TX
Limited Results Shown
Create a free account, or log in to reveal all property listings and enjoy the complete experience.
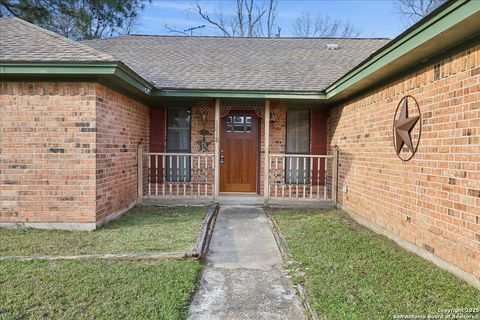
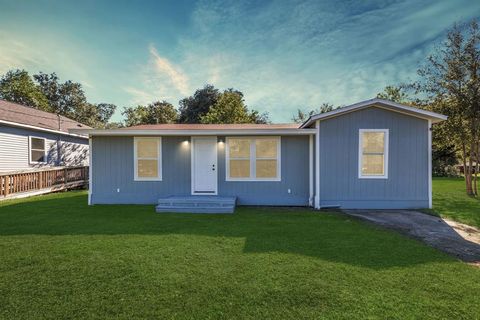
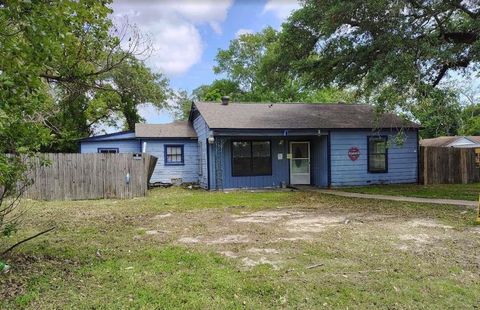
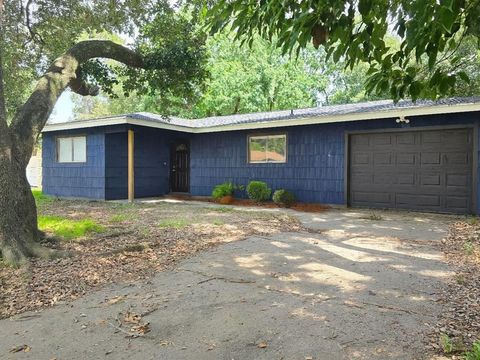
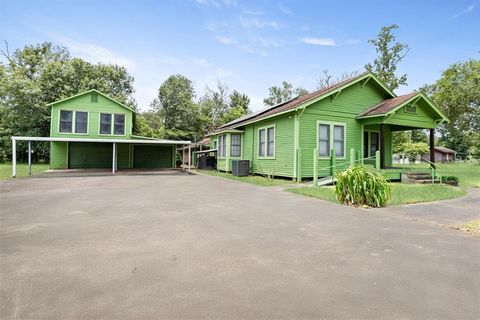
Active
$205,000
3
bds
|
2
ba
|
1,633
sqft
|
built
1977
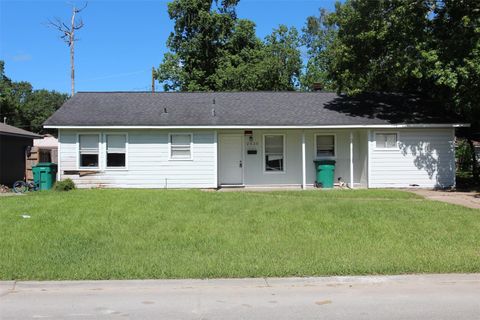
1818 W Ada Dr, Orange, TX 77632
$-140
Cash flow
-3.6%
Cash-on-Cash Return
4.9%
Cap rate
0.9%
Rent to Value Ratio

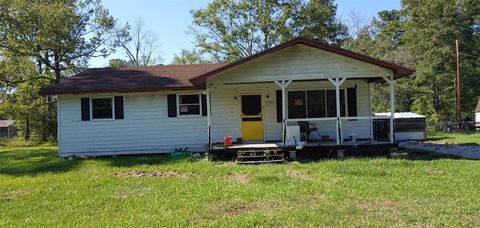
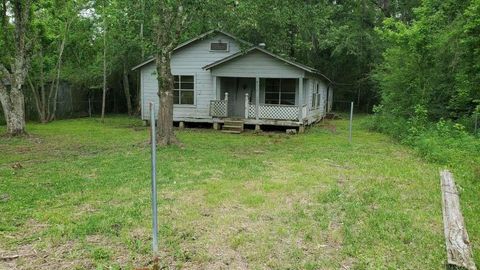
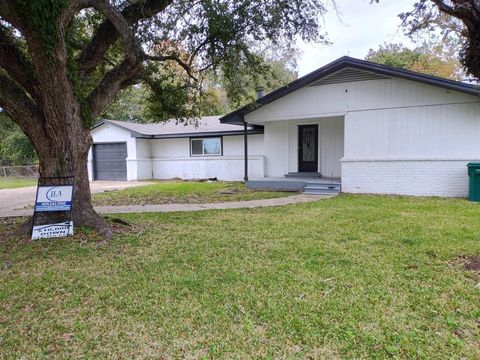
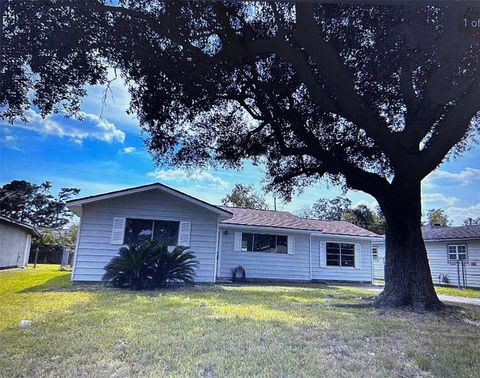
Active
$112,200
3
bds
|
1
ba
|
1,410
sqft
|
built
1954
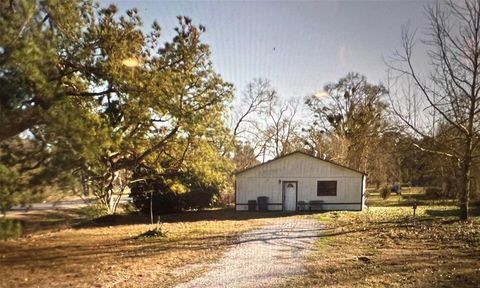
13 Byron Rd, Orange, TX 77630
$128
Cash flow
6.0%
Cash-on-Cash Return
7.0%
Cap rate
1.1%
Rent to Value Ratio
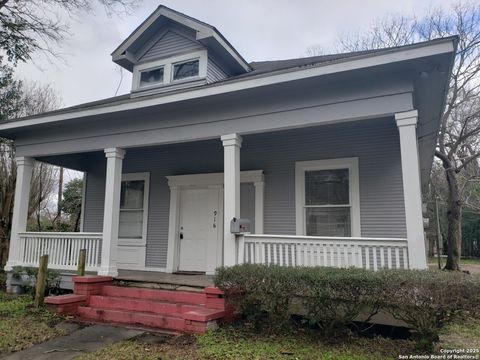
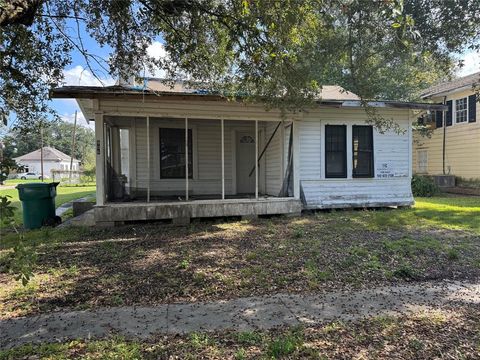
Active
$93,500
2
bds
|
1
ba
|
1,050
sqft
|
built
1930
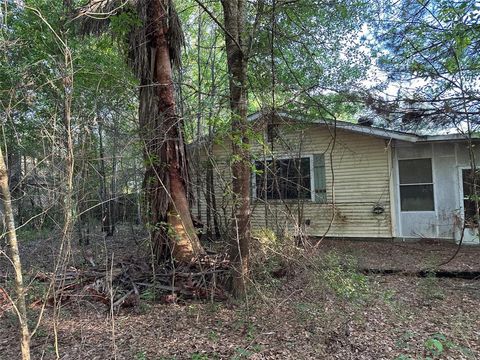
916 5th St, Orange, TX 77630
$338
Cash flow
18.9%
Cash-on-Cash Return
10.0%
Cap rate
1.4%
Rent to Value Ratio

Active
$159,500
4
bds
|
2
ba
|
1,660
sqft
|
built
1940
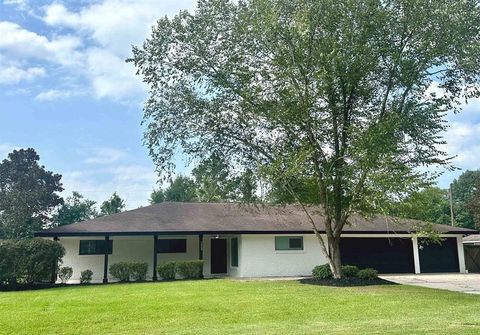
906 W Scott St, Orange, TX 77630
$-679
Cash flow
-22.2%
Cash-on-Cash Return
0.6%
Cap rate
1.0%
Rent to Value Ratio
Active
$51,500
2
bds
|
1
ba
|
900
sqft
|
built
1980
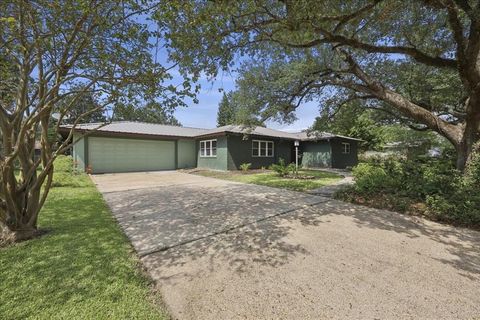
9221 Oliver Rd, Orange, TX 77632
$529
Cash flow
12.0%
Cash-on-Cash Return
12.3%
Cap rate
1.7%
Rent to Value Ratio
Active
$65,000
3
bds
|
2
ba
|
1,424
sqft
|
built
1957
6168 Inez Ave, Orange, TX 77630
$889
Cash flow
15.9%
Cash-on-Cash Return
16.4%
Cap rate
2.0%
Rent to Value Ratio

Active
$75,999
1
bds
|
1
ba
|
536
sqft
|
built
1969
1205 Rein Ave, Orange, TX 77630
$246
Cash flow
16.9%
Cash-on-Cash Return
9.6%
Cap rate
1.3%
Rent to Value Ratio
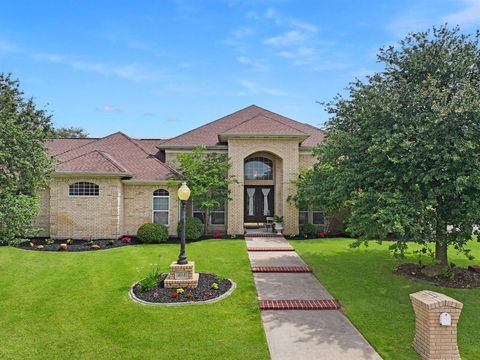
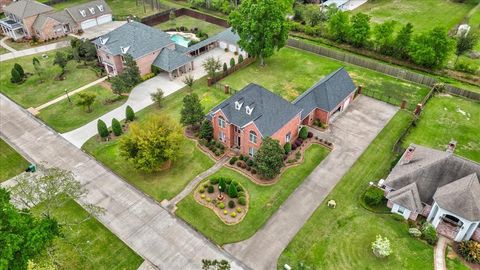
Active
$349,900
4
bds
|
3
ba
|
1,657
sqft
|
built
1967
2053 Duhon St, Orange, TX 77632
$-768
Cash flow
-11.5%
Cash-on-Cash Return
3.0%
Cap rate
0.5%
Rent to Value Ratio
Active
$269,900
3
bds
|
3
ba
|
2,242
sqft
|
built
1960
2140 Live Oak Rd, Orange, TX 77630
$-383
Cash flow
-7.4%
Cash-on-Cash Return
4.0%
Cap rate
0.7%
Rent to Value Ratio
Active
$111,000
3
bds
|
2
ba
|
1,324
sqft
|
built
1955
2325 Butler Dr, Orange, TX 77630
$337
Cash flow
15.8%
Cash-on-Cash Return
9.3%
Cap rate
1.4%
Rent to Value Ratio
Active
$750,000
4
bds
|
2
ba
|
3,828
sqft
|
built
2022
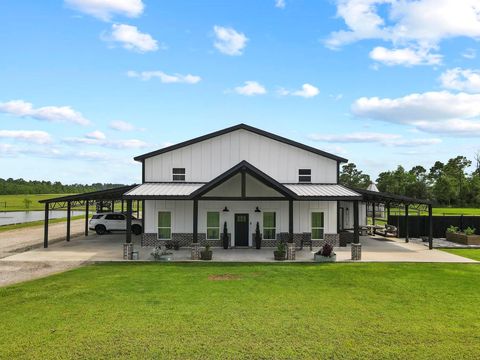
10885 Fm 1130, Orange, TX 77632
$-1,962
Cash flow
-13.6%
Cash-on-Cash Return
2.5%
Cap rate
0.3%
Rent to Value Ratio
Active
$165,000
3
bds
|
2
ba
|
1,691
sqft
|
built
1977
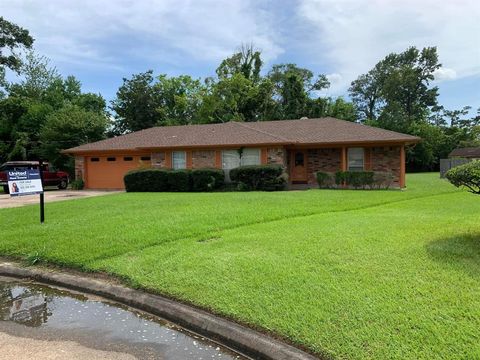
2017 5th St, Orange, TX 77630
$-9
Cash flow
-0.3%
Cash-on-Cash Return
5.6%
Cap rate
1.0%
Rent to Value Ratio
Active
$239,500
3
bds
|
2
ba
|
2,018
sqft
|
built
1976
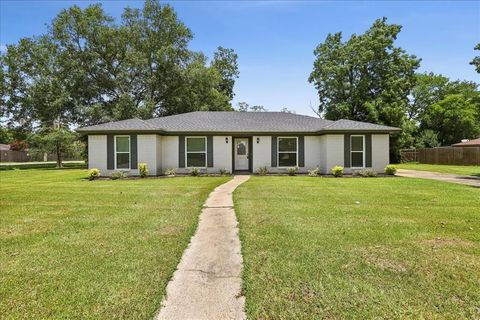
2024 International Ave, Orange, TX 77632
$109
Cash flow
2.4%
Cash-on-Cash Return
6.2%
Cap rate
0.8%
Rent to Value Ratio

Active
$699,900
5
bds
|
5
ba
|
4,087
sqft
|
built
1995
302 Waterwood Dr, Orange, TX 77630
$-2,716
Cash flow
-20.2%
Cash-on-Cash Return
1.0%
Cap rate
0.3%
Rent to Value Ratio
Active
$259,000
3
bds
|
2
ba
|
1,819
sqft
|
built
2018
4403 Persimmon Cir, Orange, TX 77630
$-336
Cash flow
-6.8%
Cash-on-Cash Return
4.1%
Cap rate
0.8%
Rent to Value Ratio
Active
$150,000
3
bds
|
1
ba
|
1,038
sqft
|
built
1949
1112 8th St, Orange, TX 77630
$260
Cash flow
9.0%
Cash-on-Cash Return
7.8%
Cap rate
1.1%
Rent to Value Ratio
Active
$59,499
3
bds
|
2
ba
|
1,655
sqft
|
built
1960
7128 Panther Run, Orange, TX 77632
$806
Cash flow
15.8%
Cash-on-Cash Return
16.3%
Cap rate
2.0%
Rent to Value Ratio

Active
$369,900
4
bds
|
3
ba
|
3,414
sqft
|
built
2005
305 Tyler Dr, Orange, TX 77630
$-605
Cash flow
-8.5%
Cash-on-Cash Return
3.7%
Cap rate
0.7%
Rent to Value Ratio
Active
$25,000
2
bds
|
1
ba
|
1,074
sqft
|
built
1925
906 6th St, Orange, TX 77630
$621
Cash flow
28.9%
Cash-on-Cash Return
29.8%
Cap rate
3.6%
Rent to Value Ratio
Active
$189,900
4
bds
|
3
ba
|
2,849
sqft
|
built
1971
3335 Old Castle Ln, Orange, TX 77630
$-117
Cash flow
-3.2%
Cash-on-Cash Return
4.9%
Cap rate
0.9%
Rent to Value Ratio
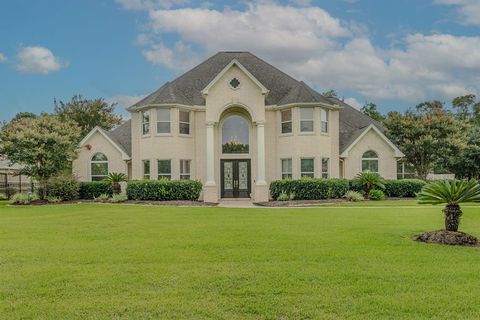
Active
$559,900
4
bds
|
3
ba
|
2,891
sqft
|
built
2014
1830 Langham Forest Blvd, Orange, TX 77630
$-1,531
Cash flow
-14.3%
Cash-on-Cash Return
2.4%
Cap rate
0.5%
Rent to Value Ratio

Active
$249,999
3
bds
|
1
ba
|
1,700
sqft
|
built
1992
2605 N 10th St, Orange, TX 77630
$-393
Cash flow
-8.2%
Cash-on-Cash Return
3.8%
Cap rate
0.6%
Rent to Value Ratio
Active
$56,249
3
bds
|
2
ba
|
1,571
sqft
|
built
1950
2241 Cross Ln, Orange, TX 77630
$675
Cash flow
14.0%
Cash-on-Cash Return
14.4%
Cap rate
1.8%
Rent to Value Ratio

Active
$209,900
4
bds
|
4
ba
|
3,244
sqft
|
built
1979
1625 Lindenwood Dr, Orange, TX 77630
$387
Cash flow
9.6%
Cash-on-Cash Return
7.9%
Cap rate
1.0%
Rent to Value Ratio
Active
$110,000
3
bds
|
1
ba
|
1,533
sqft
|
built
1952
510 W Decatur Ave, Orange, TX 77630
$158
Cash flow
7.5%
Cash-on-Cash Return
7.4%
Cap rate
1.2%
Rent to Value Ratio
Active
$222,500
3
bds
|
2
ba
|
2,211
sqft
|
built
1989
2517 Thunderbird Dr, Orange, TX 77630
$-386
Cash flow
-9.1%
Cash-on-Cash Return
3.6%
Cap rate
0.8%
Rent to Value Ratio
Active
$549,999
3
bds
|
3
ba
|
2,833
sqft
|
built
1998
404 Pintail Ln, Orange, TX 77630
$-1,563
Cash flow
-14.8%
Cash-on-Cash Return
2.3%
Cap rate
0.5%
Rent to Value Ratio
Active
$143,900
4
bds
|
2
ba
|
1,750
sqft
|
built
1960
545 Gardenia Ave, Orange, TX 77630
$310
Cash flow
11.2%
Cash-on-Cash Return
8.3%
Cap rate
1.1%
Rent to Value Ratio
Active
$708,750
3
bds
|
5
ba
|
4,788
sqft
|
built
2003
9010 Taylor Cir, Orange, TX 77630
$-2,471
Cash flow
-18.2%
Cash-on-Cash Return
1.5%
Cap rate
0.4%
Rent to Value Ratio
Active
$54,999
2
bds
|
1
ba
|
1,704
sqft
|
built
1941
2006 2nd St, Orange, TX 77630
$702
Cash flow
14.9%
Cash-on-Cash Return
15.3%
Cap rate
2.0%
Rent to Value Ratio
Active
$119,900
2
bds
|
2
ba
|
1,482
sqft
|
built
2018
1802 29th St, Orange, TX 77630
$187
Cash flow
8.1%
Cash-on-Cash Return
7.5%
Cap rate
1.3%
Rent to Value Ratio
Active
$124,900
3
bds
|
2
ba
|
1,368
sqft
|
built
1950
2227 Westway St, Orange, TX 77630
$11
Cash flow
0.5%
Cash-on-Cash Return
5.8%
Cap rate
0.9%
Rent to Value Ratio
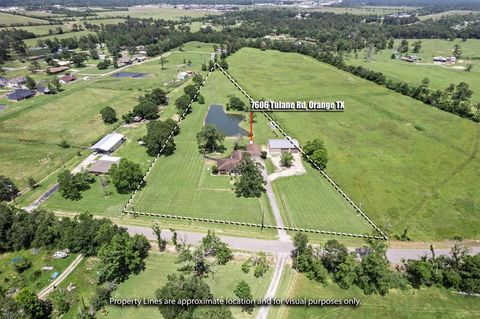
Active
$489,900
3
bds
|
3
ba
|
2,670
sqft
|
built
1976
7606 Tulane Rd, Orange, TX 77630
$-524
Cash flow
-5.6%
Cash-on-Cash Return
4.4%
Cap rate
0.5%
Rent to Value Ratio
Active
$78,000
2
bds
|
1
ba
|
1,127
sqft
|
built
1951
4 Childers Dr, Orange, TX 77630
$247
Cash flow
16.5%
Cash-on-Cash Return
9.5%
Cap rate
1.5%
Rent to Value Ratio
Active
$245,000
4
bds
|
3
ba
|
4,543
sqft
|
built
1945
8265 Maple St, Orange, TX 77632
$-5
Cash flow
-0.1%
Cash-on-Cash Return
5.7%
Cap rate
0.9%
Rent to Value Ratio
Active
$130,000
3
bds
|
1
ba
|
1,360
sqft
|
built
1962
3615 Edgemont Dr, Orange, TX 77630
$213
Cash flow
8.5%
Cash-on-Cash Return
7.6%
Cap rate
0.9%
Rent to Value Ratio
Active
$449,900
5
bds
|
4
ba
|
3,927
sqft
|
built
1998
6319 Bentwater Dr, Orange, TX 77632
$-868
Cash flow
-10.1%
Cash-on-Cash Return
3.4%
Cap rate
0.7%
Rent to Value Ratio
Active
$339,900
4
bds
|
2
ba
|
3,047
sqft
|
built
1992
6401 Steeple Chasse Dr, Orange, TX 77632
$-513
Cash flow
-7.9%
Cash-on-Cash Return
3.9%
Cap rate
0.8%
Rent to Value Ratio