Orange, TX Investment Properties for Sale
Browse homes for sale and investment properties in Orange, TX. Refine your search by price, property type, or more.
Best cash flowing properties in Orange, TX
Active
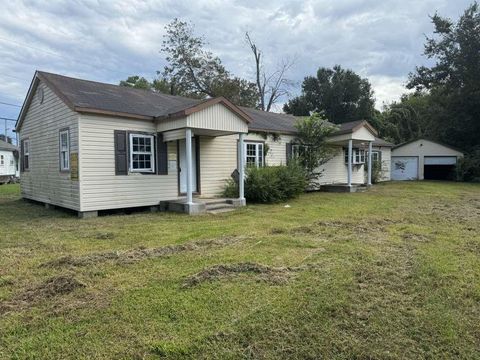
$61,749
2
bds
|
0
ba
|
1,704
sqft
|
built
1941
2006 2nd St, Orange, TX 77630
$702
Cash flow
13.2%
Cash-on-Cash Return
13.6%
Cap rate
1.8%
Rent to Value Ratio
Active
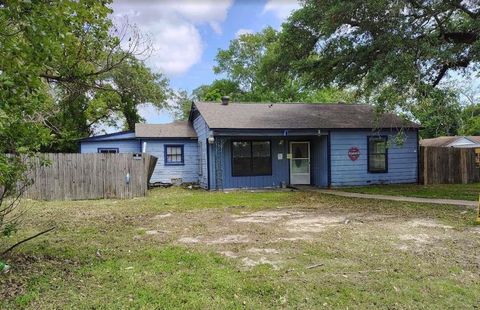
$71,249
3
bds
|
0
ba
|
1,571
sqft
|
built
1950
2241 Cross Ln, Orange, TX 77630
$675
Cash flow
11.0%
Cash-on-Cash Return
11.4%
Cap rate
1.4%
Rent to Value Ratio
67 out of 76 properties for sale in Orange, TX
Limited Results Shown
Create a free account, or log in to reveal all property listings and enjoy the complete experience.

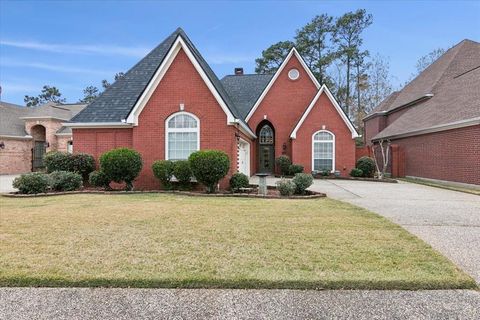
Active
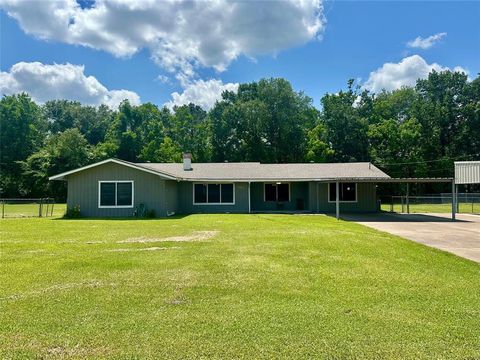
$140,000
2
bds
|
0
ba
|
1,000
sqft
|
built
1995
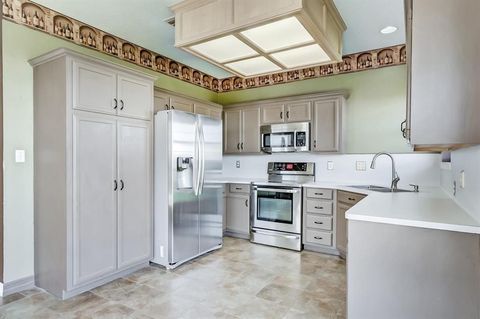
2584 Charlotte St, Orange, TX 77632
$57
Cash flow
2.1%
Cash-on-Cash Return
6.8%
Cap rate
0.9%
Rent to Value Ratio

Active
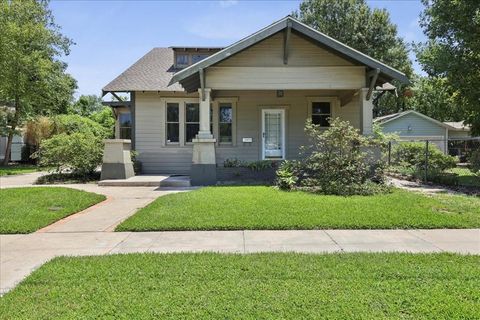
$255,000
4
bds
|
0
ba
|
3,492
sqft
|
built
1974
11 Finwick Dr, Orange, TX 77632
$-45
Cash flow
-0.9%
Cash-on-Cash Return
6.1%
Cap rate
1.0%
Rent to Value Ratio
Active
$169,900
4
bds
|
0
ba
|
2,228
sqft
|
built
1968
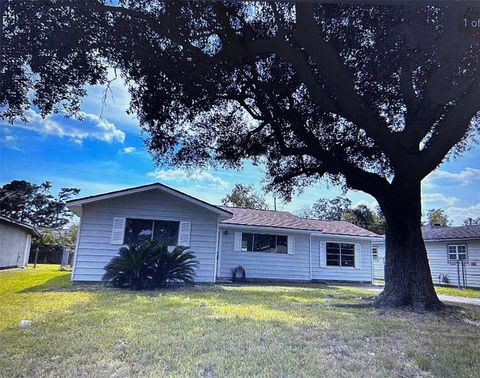
3605 Lawn Oak Dr, Orange, TX 77632
$68
Cash flow
2.1%
Cash-on-Cash Return
6.7%
Cap rate
1.1%
Rent to Value Ratio

Active
$339,000
4
bds
|
0
ba
|
2,046
sqft
|
built
2023
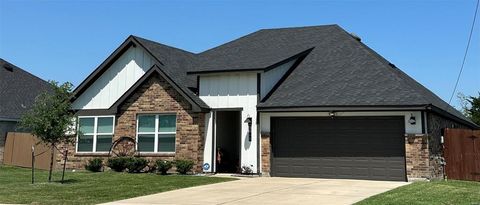
3513 Allie Payne Rd, Orange, TX 77632
$-303
Cash flow
-4.7%
Cash-on-Cash Return
5.2%
Cap rate
0.7%
Rent to Value Ratio
Active
$224,900
3
bds
|
0
ba
|
2,499
sqft
|
built
1930
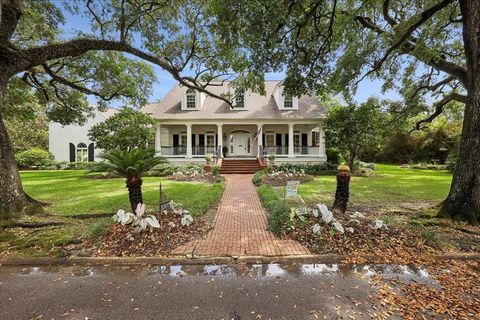
507 W Orange Ave, Orange, TX 77630
$-1
Cash flow
0.0%
Cash-on-Cash Return
6.3%
Cap rate
1.0%
Rent to Value Ratio
Active
$529,900
4
bds
|
0
ba
|
3,871
sqft
|
built
2000
1007 Pine Ave, Orange, TX 77630
$-1,842
Cash flow
-18.1%
Cash-on-Cash Return
2.1%
Cap rate
0.5%
Rent to Value Ratio

Active
$1,200,000
3
bds
|
0
ba
|
1,848
sqft
|
built
1999
3574 Hudson Rd, Orange, TX 77632
$-5,221
Cash flow
-22.7%
Cash-on-Cash Return
1.0%
Cap rate
0.2%
Rent to Value Ratio

Active
$299,900
3
bds
|
0
ba
|
2,272
sqft
|
built
1979
8718 S Dana, Orange, TX 77632
$-684
Cash flow
-11.9%
Cash-on-Cash Return
3.5%
Cap rate
0.6%
Rent to Value Ratio
Active
$359,000
4
bds
|
0
ba
|
2,329
sqft
|
built
2022
3040 Allie Payne Rd, Orange, TX 77632
$-638
Cash flow
-9.3%
Cash-on-Cash Return
4.1%
Cap rate
0.7%
Rent to Value Ratio

Active
$189,900
2
bds
|
0
ba
|
1,701
sqft
|
built
1915
606 W Cherry Ave, Orange, TX 77630
$141
Cash flow
3.9%
Cash-on-Cash Return
7.2%
Cap rate
1.1%
Rent to Value Ratio
Active
$130,000
3
bds
|
0
ba
|
1,360
sqft
|
built
1962
3615 Edgemont Dr, Orange, TX 77630
$149
Cash flow
6.0%
Cash-on-Cash Return
7.6%
Cap rate
0.9%
Rent to Value Ratio

Active
$195,000
3
bds
|
0
ba
|
1,794
sqft
|
built
1970
4303 Memorial Dr, Orange, TX 77632
$-196
Cash flow
-5.2%
Cash-on-Cash Return
5.1%
Cap rate
0.9%
Rent to Value Ratio
Active
$219,500
3
bds
|
0
ba
|
1,799
sqft
|
built
1991
2514 Thunderbird Dr, Orange, TX 77630
$-353
Cash flow
-8.4%
Cash-on-Cash Return
4.3%
Cap rate
0.8%
Rent to Value Ratio
Active
$339,900
4
bds
|
0
ba
|
3,047
sqft
|
built
1992
6401 Steeple Chasse Dr, Orange, TX 77632
$-679
Cash flow
-10.4%
Cash-on-Cash Return
3.9%
Cap rate
0.8%
Rent to Value Ratio

Active
$179,800
4
bds
|
0
ba
|
1,918
sqft
|
built
1950
1307 W Cypress Ave, Orange, TX 77630
$41
Cash flow
1.2%
Cash-on-Cash Return
6.5%
Cap rate
1.1%
Rent to Value Ratio
Active
$110,000
3
bds
|
0
ba
|
1,533
sqft
|
built
1952
510 W Decatur Ave, Orange, TX 77630
$105
Cash flow
5.0%
Cash-on-Cash Return
7.4%
Cap rate
1.2%
Rent to Value Ratio
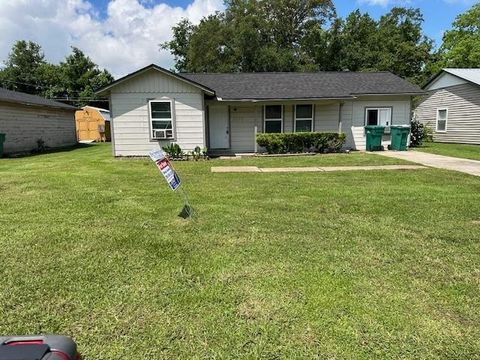
Active
$61,749
2
bds
|
0
ba
|
1,704
sqft
|
built
1941
2006 2nd St, Orange, TX 77630
$702
Cash flow
13.2%
Cash-on-Cash Return
13.6%
Cap rate
1.8%
Rent to Value Ratio

Active
$89,000
2
bds
|
0
ba
|
2,342
sqft
|
built
1953
3475 Pelican St, Orange, TX 77630
$543
Cash flow
31.8%
Cash-on-Cash Return
13.6%
Cap rate
2.0%
Rent to Value Ratio

Active
$219,900
4
bds
|
0
ba
|
2,138
sqft
|
built
1976
2812 Fairway Dr, Orange, TX 77630
$-373
Cash flow
-8.8%
Cash-on-Cash Return
4.2%
Cap rate
0.8%
Rent to Value Ratio

Active
$249,900
4
bds
|
0
ba
|
3,244
sqft
|
built
1979
1625 Lindenwood Dr, Orange, TX 77630
$75
Cash flow
1.6%
Cash-on-Cash Return
6.6%
Cap rate
0.8%
Rent to Value Ratio

Active
$549,999
3
bds
|
0
ba
|
2,833
sqft
|
built
1998
404 Pintail Ln, Orange, TX 77630
$-1,831
Cash flow
-17.4%
Cash-on-Cash Return
2.3%
Cap rate
0.5%
Rent to Value Ratio
Active
$228,000
3
bds
|
0
ba
|
2,211
sqft
|
built
1989
2517 Thunderbird Dr, Orange, TX 77630
$-520
Cash flow
-11.9%
Cash-on-Cash Return
3.5%
Cap rate
0.8%
Rent to Value Ratio
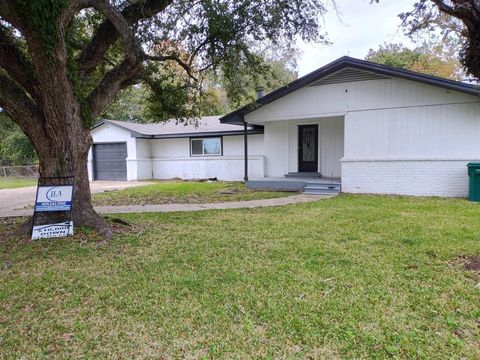
Active
$71,249
3
bds
|
0
ba
|
1,571
sqft
|
built
1950
2241 Cross Ln, Orange, TX 77630
$675
Cash flow
11.0%
Cash-on-Cash Return
11.4%
Cap rate
1.4%
Rent to Value Ratio

Active
$119,900
2
bds
|
0
ba
|
1,482
sqft
|
built
2018
1802 29th St, Orange, TX 77630
$128
Cash flow
5.6%
Cash-on-Cash Return
7.5%
Cap rate
1.3%
Rent to Value Ratio

Active
$459,000
3
bds
|
0
ba
|
4,503
sqft
|
built
2000
486 Parish Rd, Orange, TX 77632
$-464
Cash flow
-5.3%
Cash-on-Cash Return
5.1%
Cap rate
0.6%
Rent to Value Ratio
Active
$129,900
3
bds
|
0
ba
|
1,368
sqft
|
built
1950
2227 Westway St, Orange, TX 77630
$-76
Cash flow
-3.1%
Cash-on-Cash Return
5.6%
Cap rate
0.8%
Rent to Value Ratio

Active
$161,499
3
bds
|
0
ba
|
1,509
sqft
|
built
1969
5403 Old Highway 87, Orange, TX 77632
$143
Cash flow
4.6%
Cash-on-Cash Return
7.3%
Cap rate
1.0%
Rent to Value Ratio