Ormond Beach, FL Investment Properties for Sale
Browse homes for sale and investment properties in Ormond Beach, FL. Refine your search by price, property type, or more.
Best cash flowing properties in Ormond Beach, FL
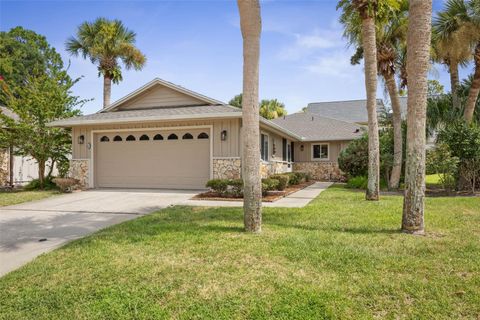
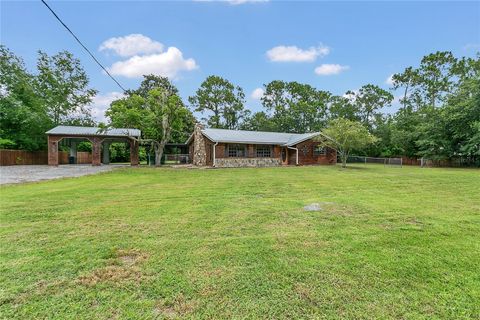
Active
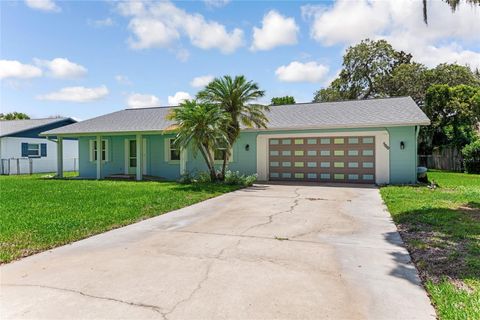
$205,000
2
bds
|
3
ba
|
1,664
sqft
|
built
1977
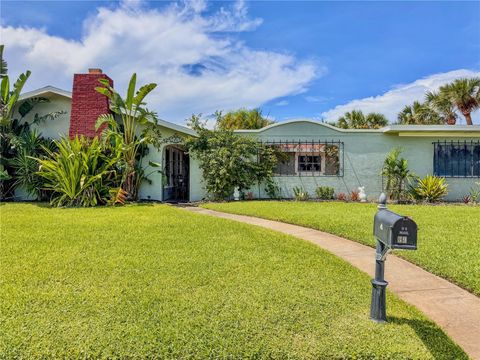
149 Pine Cone Trl, Ormond Beach, FL 32174
$143
Cash flow
3.6%
Cash-on-Cash Return
7.0%
Cap rate
1.1%
Rent to Value Ratio
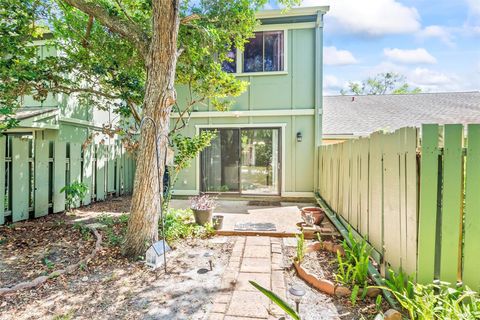
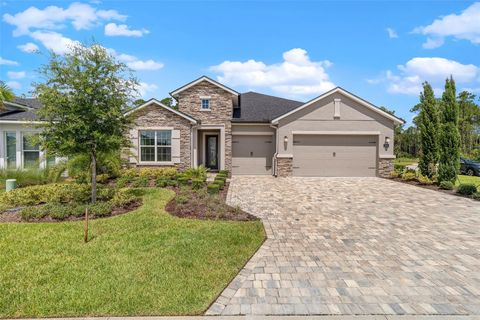
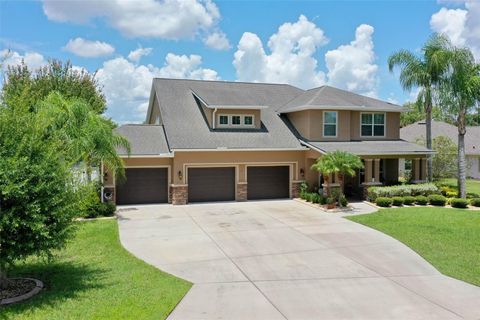
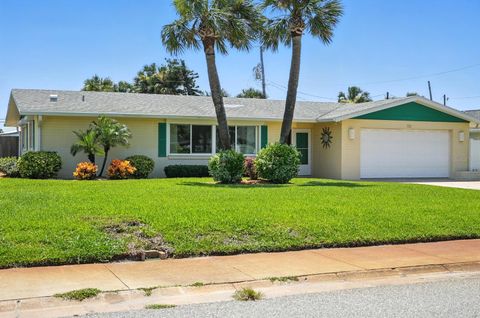
Active
$199,900
2
bds
|
2
ba
|
1,337
sqft
|
built
1977
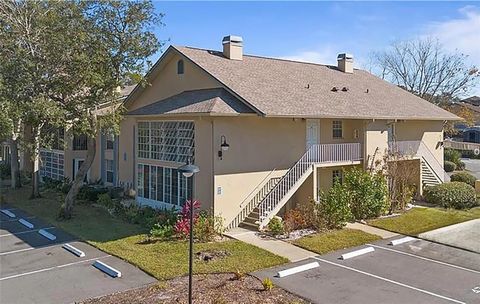
4 Sugarberry Cir, Ormond Beach, FL 32174
$83
Cash flow
2.2%
Cash-on-Cash Return
6.6%
Cap rate
1.0%
Rent to Value Ratio
159 out of 199 properties for sale in Ormond Beach, FL
Limited Results Shown
Create a free account, or log in to reveal all property listings and enjoy the complete experience.
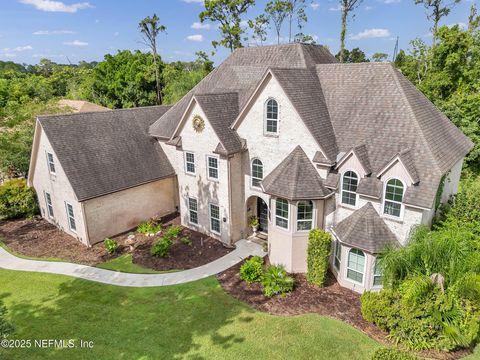
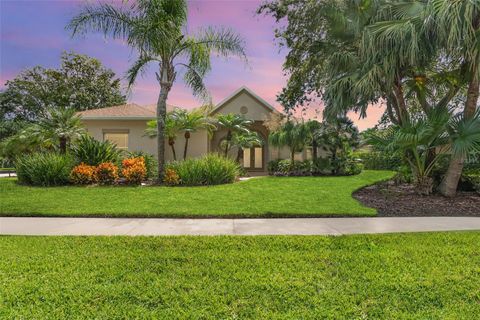
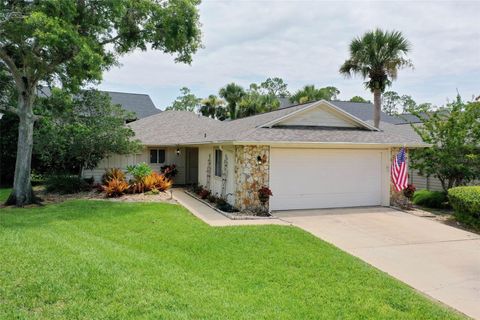
Active
$985,000
5
bds
|
5
ba
|
4,840
sqft
|
built
1990
9 Forest View Way, Ormond Beach, FL 32174
$-2,351
Cash flow
-12.5%
Cash-on-Cash Return
3.3%
Cap rate
0.6%
Rent to Value Ratio
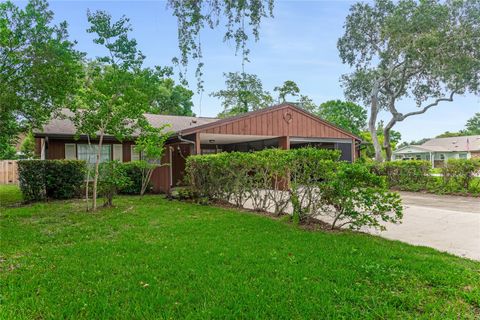
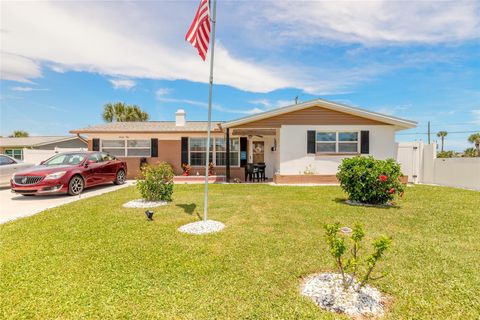
Active
$358,900
2
bds
|
3
ba
|
2,156
sqft
|
built
1987
3 Treetop Trl, Ormond Beach, FL 32174
$-83
Cash flow
-1.2%
Cash-on-Cash Return
5.9%
Cap rate
0.8%
Rent to Value Ratio
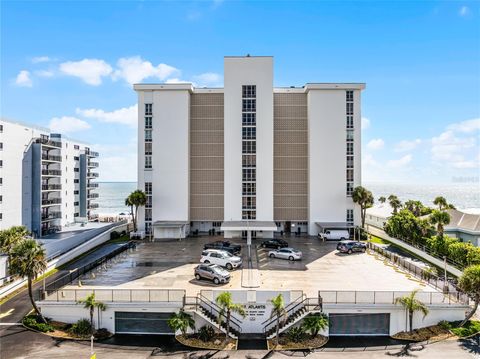
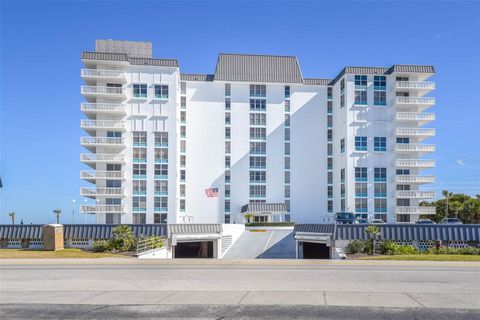
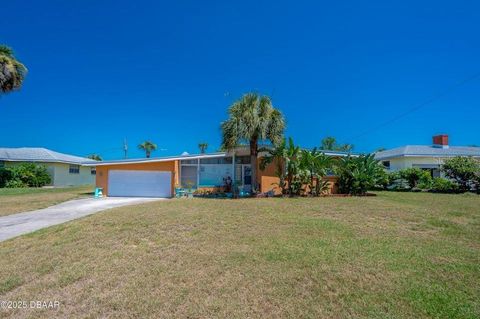
Active
$509,000
2
bds
|
2
ba
|
1,634
sqft
|
built
1982
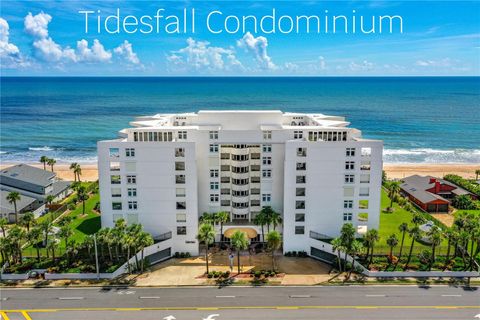
395 S Atlantic Ave, Ormond Beach, FL 32176
$-2,108
Cash flow
-21.6%
Cash-on-Cash Return
1.2%
Cap rate
0.5%
Rent to Value Ratio
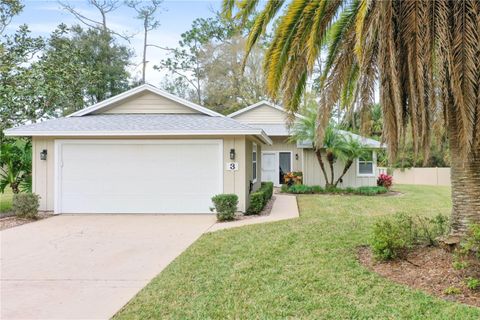
Active
$170,000
2
bds
|
2
ba
|
1,108
sqft
|
built
1986
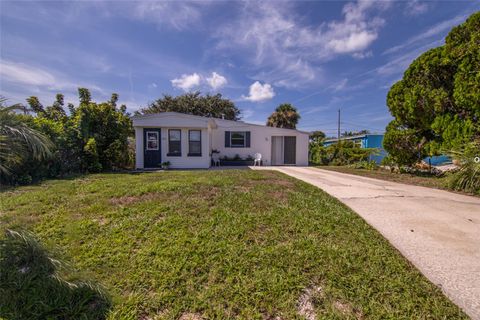
689 Wellington Station Blvd, Ormond Beach, FL 32174
$54
Cash flow
1.7%
Cash-on-Cash Return
6.5%
Cap rate
0.9%
Rent to Value Ratio
Active
$549,000
4
bds
|
3
ba
|
1,890
sqft
|
built
1969
39 Surfside Dr, Ormond Beach, FL 32176
$-1,145
Cash flow
-10.9%
Cash-on-Cash Return
3.6%
Cap rate
0.5%
Rent to Value Ratio
Active
$329,000
3
bds
|
2
ba
|
1,146
sqft
|
built
1953
151 Holland Rd, Ormond Beach, FL 32176
$-567
Cash flow
-9.0%
Cash-on-Cash Return
4.1%
Cap rate
0.7%
Rent to Value Ratio
Active
$299,900
2
bds
|
2
ba
|
1,515
sqft
|
built
1984
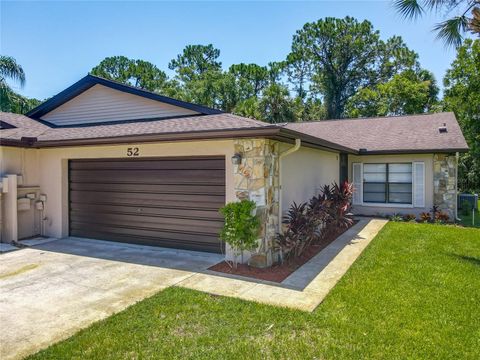
52 Big Buck Trl, Ormond Beach, FL 32174
$-760
Cash flow
-13.2%
Cash-on-Cash Return
3.1%
Cap rate
0.7%
Rent to Value Ratio
Active
$385,000
2
bds
|
2
ba
|
1,131
sqft
|
built
1974
111 S Atlantic Ave, Ormond Beach, FL 32176
$-866
Cash flow
-11.7%
Cash-on-Cash Return
3.4%
Cap rate
0.6%
Rent to Value Ratio
Active
$2,834,201
4
bds
|
5
ba
|
0
sqft
|
built
2023
1009 Sudbury Ln, Ormond Beach, FL 32174
$-12,664
Cash flow
-23.3%
Cash-on-Cash Return
0.8%
Cap rate
0.2%
Rent to Value Ratio
Active
$165,000
2
bds
|
2
ba
|
932
sqft
|
built
1976
640 N Nova Rd, Ormond Beach, FL 32174
$-466
Cash flow
-14.7%
Cash-on-Cash Return
2.8%
Cap rate
1.0%
Rent to Value Ratio
Active
$339,000
3
bds
|
2
ba
|
1,427
sqft
|
built
1979
500 S Center St, Ormond Beach, FL 32174
$-321
Cash flow
-4.9%
Cash-on-Cash Return
5.0%
Cap rate
0.6%
Rent to Value Ratio
Active
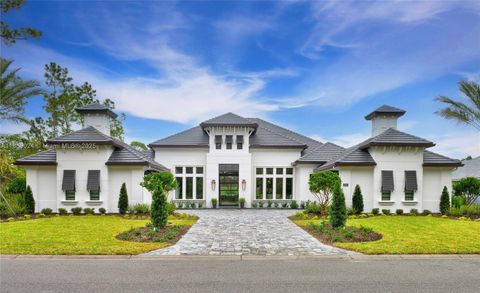
$669,900
4
bds
|
3
ba
|
2,193
sqft
|
built
2023
380 Stirling Bridge Dr, Ormond Beach, FL 32174
$-1,804
Cash flow
-14.1%
Cash-on-Cash Return
2.9%
Cap rate
0.5%
Rent to Value Ratio
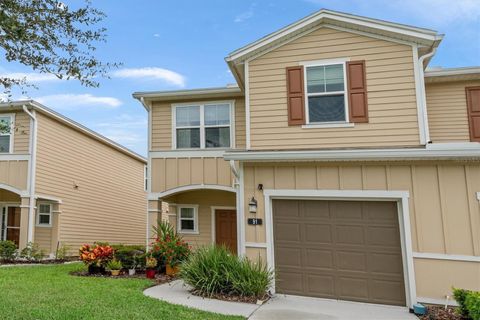
Active
$299,900
3
bds
|
3
ba
|
1,736
sqft
|
built
2020
91 Bella Vita Way, Ormond Beach, FL 32174
$-451
Cash flow
-7.8%
Cash-on-Cash Return
4.3%
Cap rate
0.8%
Rent to Value Ratio

Active
$289,000
2
bds
|
2
ba
|
1,000
sqft
|
built
1958
311 Kenilworth Ave, Ormond Beach, FL 32174
$-494
Cash flow
-8.9%
Cash-on-Cash Return
4.1%
Cap rate
0.6%
Rent to Value Ratio
Active
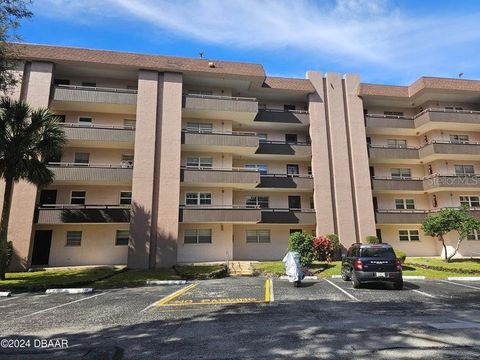
$479,900
2
bds
|
2
ba
|
1,312
sqft
|
built
1974
1575 Ocean Shore Blvd, Ormond Beach, FL 32176
$-2,113
Cash flow
-23.0%
Cash-on-Cash Return
0.9%
Cap rate
0.6%
Rent to Value Ratio
Active
$849,900
4
bds
|
4
ba
|
3,647
sqft
|
built
1994
7 Foxfords Chase, Ormond Beach, FL 32174
$-2,159
Cash flow
-13.3%
Cash-on-Cash Return
3.1%
Cap rate
0.5%
Rent to Value Ratio
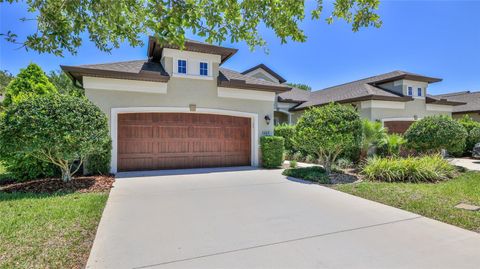
Active
$324,999
3
bds
|
2
ba
|
1,684
sqft
|
built
2005
3005 Glin Cir, Ormond Beach, FL 32174
$-527
Cash flow
-8.5%
Cash-on-Cash Return
4.2%
Cap rate
0.8%
Rent to Value Ratio
Active
$359,000
3
bds
|
2
ba
|
1,695
sqft
|
built
2019
3217 Bailey Ann Dr, Ormond Beach, FL 32174
$-720
Cash flow
-10.5%
Cash-on-Cash Return
3.7%
Cap rate
0.7%
Rent to Value Ratio
Active
$474,900
3
bds
|
3
ba
|
2,040
sqft
|
built
2022
2892 Monaghan Dr, Ormond Beach, FL 32174
$-1,078
Cash flow
-11.8%
Cash-on-Cash Return
3.4%
Cap rate
0.6%
Rent to Value Ratio
Active
$325,000
2
bds
|
2
ba
|
1,386
sqft
|
built
1986
5 Jasmine Run, Ormond Beach, FL 32174
$-540
Cash flow
-8.7%
Cash-on-Cash Return
4.2%
Cap rate
0.7%
Rent to Value Ratio
Active
$729,000
4
bds
|
4
ba
|
3,289
sqft
|
built
2013
6 Black Pine Way, Ormond Beach, FL 32174
$-1,549
Cash flow
-11.1%
Cash-on-Cash Return
3.6%
Cap rate
0.6%
Rent to Value Ratio
Active
$375,000
3
bds
|
2
ba
|
1,624
sqft
|
built
1958
75 Harvard Dr, Ormond Beach, FL 32176
$-299
Cash flow
-4.2%
Cash-on-Cash Return
5.2%
Cap rate
0.7%
Rent to Value Ratio
Active
$699,900
4
bds
|
3
ba
|
2,924
sqft
|
built
2005
3413 Rexford Cir, Ormond Beach, FL 32174
$-1,708
Cash flow
-12.7%
Cash-on-Cash Return
3.2%
Cap rate
0.5%
Rent to Value Ratio
Active
$649,900
3
bds
|
3
ba
|
3,455
sqft
|
built
2005
7 Old Mc Duffie Cir, Ormond Beach, FL 32174
$-1,104
Cash flow
-8.9%
Cash-on-Cash Return
4.1%
Cap rate
0.6%
Rent to Value Ratio
Active
$799,000
5
bds
|
4
ba
|
3,094
sqft
|
built
1968
29 Twin River Dr, Ormond Beach, FL 32174
$-1,592
Cash flow
-10.4%
Cash-on-Cash Return
3.8%
Cap rate
0.6%
Rent to Value Ratio
Active
$635,000
4
bds
|
2
ba
|
3,104
sqft
|
built
1992
11 Forest View Way, Ormond Beach, FL 32174
$-1,275
Cash flow
-10.5%
Cash-on-Cash Return
3.7%
Cap rate
0.6%
Rent to Value Ratio
Active
$449,000
4
bds
|
3
ba
|
2,020
sqft
|
built
1965
22 Plaza Dr, Ormond Beach, FL 32176
$-1,126
Cash flow
-13.1%
Cash-on-Cash Return
3.1%
Cap rate
0.6%
Rent to Value Ratio
Active
$435,000
2
bds
|
2
ba
|
1,706
sqft
|
built
1976
9 Sunny Rd, Ormond Beach, FL 32174
$-1,288
Cash flow
-15.4%
Cash-on-Cash Return
2.6%
Cap rate
0.4%
Rent to Value Ratio
Active
$625,000
4
bds
|
3
ba
|
1,870
sqft
|
built
1963
792 Marvin Rd, Ormond Beach, FL 32176
$-1,920
Cash flow
-16.0%
Cash-on-Cash Return
2.5%
Cap rate
0.4%
Rent to Value Ratio

Active
$355,000
3
bds
|
2
ba
|
1,598
sqft
|
built
1980
62 Mayfield Cir, Ormond Beach, FL 32174
$-333
Cash flow
-4.9%
Cash-on-Cash Return
5.0%
Cap rate
0.6%
Rent to Value Ratio

Active
$315,000
2
bds
|
2
ba
|
1,300
sqft
|
built
1992
39 Magnolia Dr S, Ormond Beach, FL 32174
$-610
Cash flow
-10.1%
Cash-on-Cash Return
3.8%
Cap rate
0.6%
Rent to Value Ratio
Active
$350,000
2
bds
|
2
ba
|
2,037
sqft
|
built
1987
4 Jasmine Run, Ormond Beach, FL 32174
$-665
Cash flow
-9.9%
Cash-on-Cash Return
3.9%
Cap rate
0.6%
Rent to Value Ratio

Active
$350,000
2
bds
|
2
ba
|
1,087
sqft
|
built
1973
2100 Ocean Shore Blvd, Ormond Beach, FL 32176
$-677
Cash flow
-10.1%
Cash-on-Cash Return
3.8%
Cap rate
0.6%
Rent to Value Ratio
Active
$425,000
3
bds
|
4
ba
|
1,611
sqft
|
built
1972
21 Sunset Blvd, Ormond Beach, FL 32176
$-559
Cash flow
-6.9%
Cash-on-Cash Return
4.6%
Cap rate
0.7%
Rent to Value Ratio
Active
$569,900
3
bds
|
2
ba
|
1,631
sqft
|
built
2000
3806 Islamorada Dr, Ormond Beach, FL 32176
$-1,439
Cash flow
-13.2%
Cash-on-Cash Return
3.1%
Cap rate
0.5%
Rent to Value Ratio
Active
$1,200,000
4
bds
|
4
ba
|
3,135
sqft
|
built
1920
236 S Beach St, Ormond Beach, FL 32174
$-4,504
Cash flow
-19.6%
Cash-on-Cash Return
1.6%
Cap rate
0.3%
Rent to Value Ratio
Active
$489,000
4
bds
|
3
ba
|
2,106
sqft
|
built
2023
2983 Monaghan Dr, Ormond Beach, FL 32174
$-993
Cash flow
-10.6%
Cash-on-Cash Return
3.7%
Cap rate
0.6%
Rent to Value Ratio
Active
$429,000
3
bds
|
2
ba
|
1,492
sqft
|
built
1971
39 Sandra Dr, Ormond Beach, FL 32176
$-968
Cash flow
-11.8%
Cash-on-Cash Return
3.4%
Cap rate
0.6%
Rent to Value Ratio