Ormond Beach, FL Investment Properties for Sale
Browse homes for sale and investment properties in Ormond Beach, FL. Refine your search by price, property type, or more.
Best cash flowing properties in Ormond Beach, FL

Active
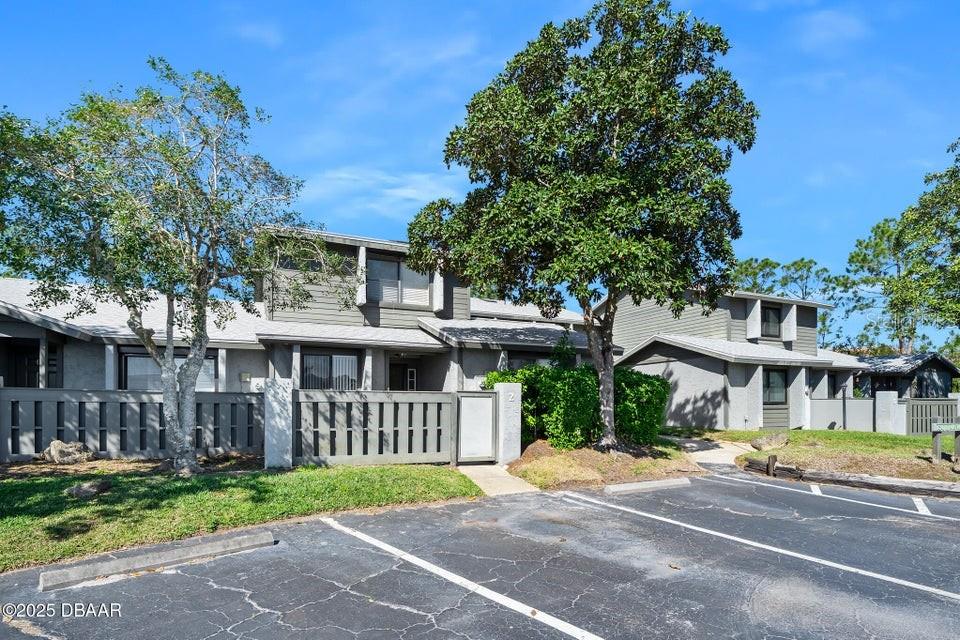
$285,500
3
bds
|
3
ba
|
1,775
sqft
|
built
1982
171 Fox Glen Ct, Ormond Beach, FL 32174
$11
Cash flow
0.2%
Cash-on-Cash Return
6.2%
Cap rate
0.8%
Rent to Value Ratio

Active
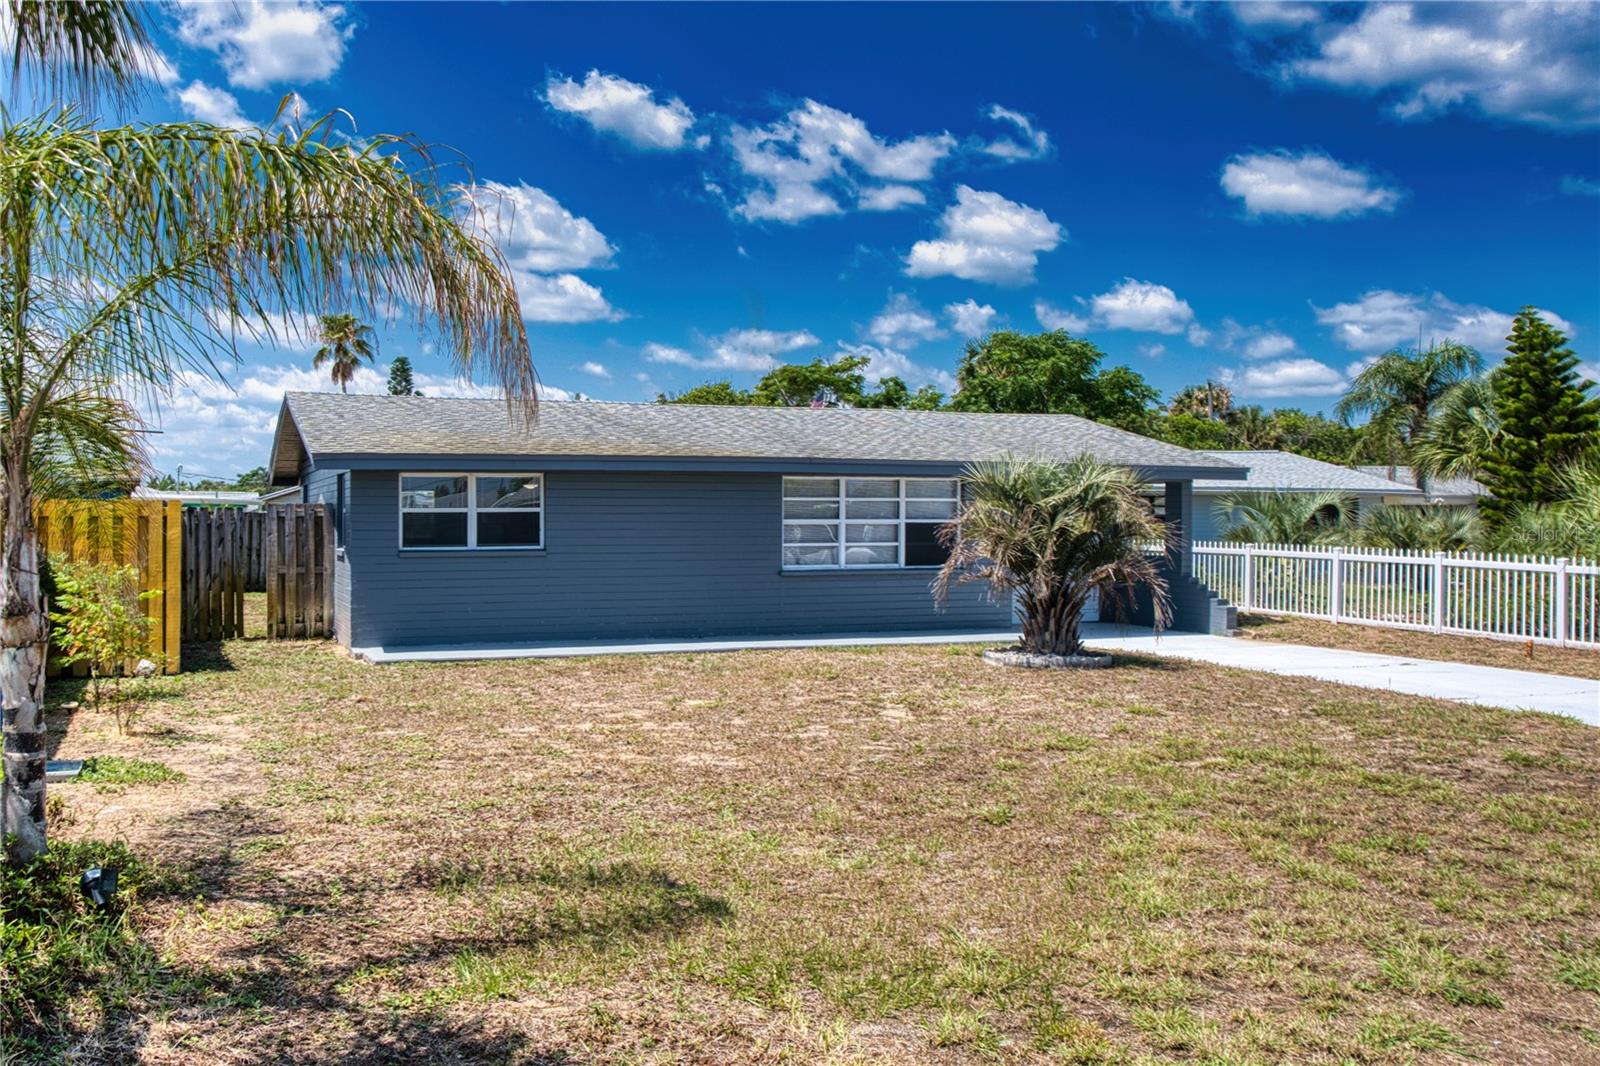
$249,500
3
bds
|
2
ba
|
1,260
sqft
|
built
1977
38 Snaresbrook Ct, Ormond Beach, FL 32174
$-103
Cash flow
-2.2%
Cash-on-Cash Return
5.7%
Cap rate
0.9%
Rent to Value Ratio
340 out of 399 properties for sale in Ormond Beach, FL
Limited Results Shown
Create a free account, or log in to reveal all property listings and enjoy the complete experience.
Active
$249,900
2
bds
|
2
ba
|
1,393
sqft
|
built
1997
1184 Athlone Way, Ormond Beach, FL 32174
$-273
Cash flow
-5.7%
Cash-on-Cash Return
4.8%
Cap rate
0.8%
Rent to Value Ratio

Active
$349,000
3
bds
|
3
ba
|
1,674
sqft
|
built
2005
1128 Hansberry Ct, Ormond Beach, FL 32174
$-672
Cash flow
-10.0%
Cash-on-Cash Return
3.8%
Cap rate
0.7%
Rent to Value Ratio

Active
$636,000
4
bds
|
3
ba
|
2,640
sqft
|
built
2002
1404 Newry Cir, Ormond Beach, FL 32174
$-1,616
Cash flow
-13.3%
Cash-on-Cash Return
3.1%
Cap rate
0.6%
Rent to Value Ratio
Active
$259,500
2
bds
|
1
ba
|
822
sqft
|
built
1947
11 Cardinal Dr, Ormond Beach, FL 32176
$-408
Cash flow
-8.2%
Cash-on-Cash Return
4.3%
Cap rate
0.7%
Rent to Value Ratio
Active
$845,000
3
bds
|
2
ba
|
1,728
sqft
|
built
1984
3216 John Anderson Dr, Ormond Beach, FL 32176
$-2,118
Cash flow
-13.1%
Cash-on-Cash Return
3.1%
Cap rate
0.5%
Rent to Value Ratio

Active
$449,000
3
bds
|
2
ba
|
1,891
sqft
|
built
2000
3349 Glenshane Way, Ormond Beach, FL 32174
$-1,029
Cash flow
-12.0%
Cash-on-Cash Return
3.4%
Cap rate
0.6%
Rent to Value Ratio
Active
$899,900
5
bds
|
3
ba
|
3,110
sqft
|
built
1990
15 Winchester Rd, Ormond Beach, FL 32174
$-2,672
Cash flow
-15.5%
Cash-on-Cash Return
2.6%
Cap rate
0.4%
Rent to Value Ratio

Active
$304,900
2
bds
|
1
ba
|
1,214
sqft
|
built
1955
82 Margaret Rd, Ormond Beach, FL 32176
$-366
Cash flow
-6.3%
Cash-on-Cash Return
4.7%
Cap rate
0.8%
Rent to Value Ratio
Active
$165,000
2
bds
|
2
ba
|
975
sqft
|
built
1997
678 Wellington Station Blvd, Ormond Beach, FL 32174
$-422
Cash flow
-13.3%
Cash-on-Cash Return
3.1%
Cap rate
1.0%
Rent to Value Ratio
Active
$1,997,000
4
bds
|
5
ba
|
5,352
sqft
|
built
2001
1117 Oxbridge Ln, Ormond Beach, FL 32174
$-7,983
Cash flow
-20.9%
Cash-on-Cash Return
1.4%
Cap rate
0.3%
Rent to Value Ratio

Active
$649,000
3
bds
|
3
ba
|
2,073
sqft
|
built
2020
827 Creekwood Dr, Ormond Beach, FL 32174
$-1,443
Cash flow
-11.6%
Cash-on-Cash Return
3.5%
Cap rate
0.6%
Rent to Value Ratio
Active
$399,630
4
bds
|
3
ba
|
3,274
sqft
|
built
1973
370 S Center St, Ormond Beach, FL 32174
$-349
Cash flow
-4.6%
Cash-on-Cash Return
5.1%
Cap rate
0.7%
Rent to Value Ratio
Active
$329,000
3
bds
|
2
ba
|
1,146
sqft
|
built
1953
151 Holland Rd, Ormond Beach, FL 32176
$-567
Cash flow
-9.0%
Cash-on-Cash Return
4.1%
Cap rate
0.7%
Rent to Value Ratio
Active
$1,850,000
4
bds
|
4
ba
|
3,738
sqft
|
built
2002
3310 John Anderson Dr, Ormond Beach, FL 32176
$-4,932
Cash flow
-13.9%
Cash-on-Cash Return
2.9%
Cap rate
0.4%
Rent to Value Ratio

Active
$675,000
4
bds
|
3
ba
|
1,834
sqft
|
built
1948
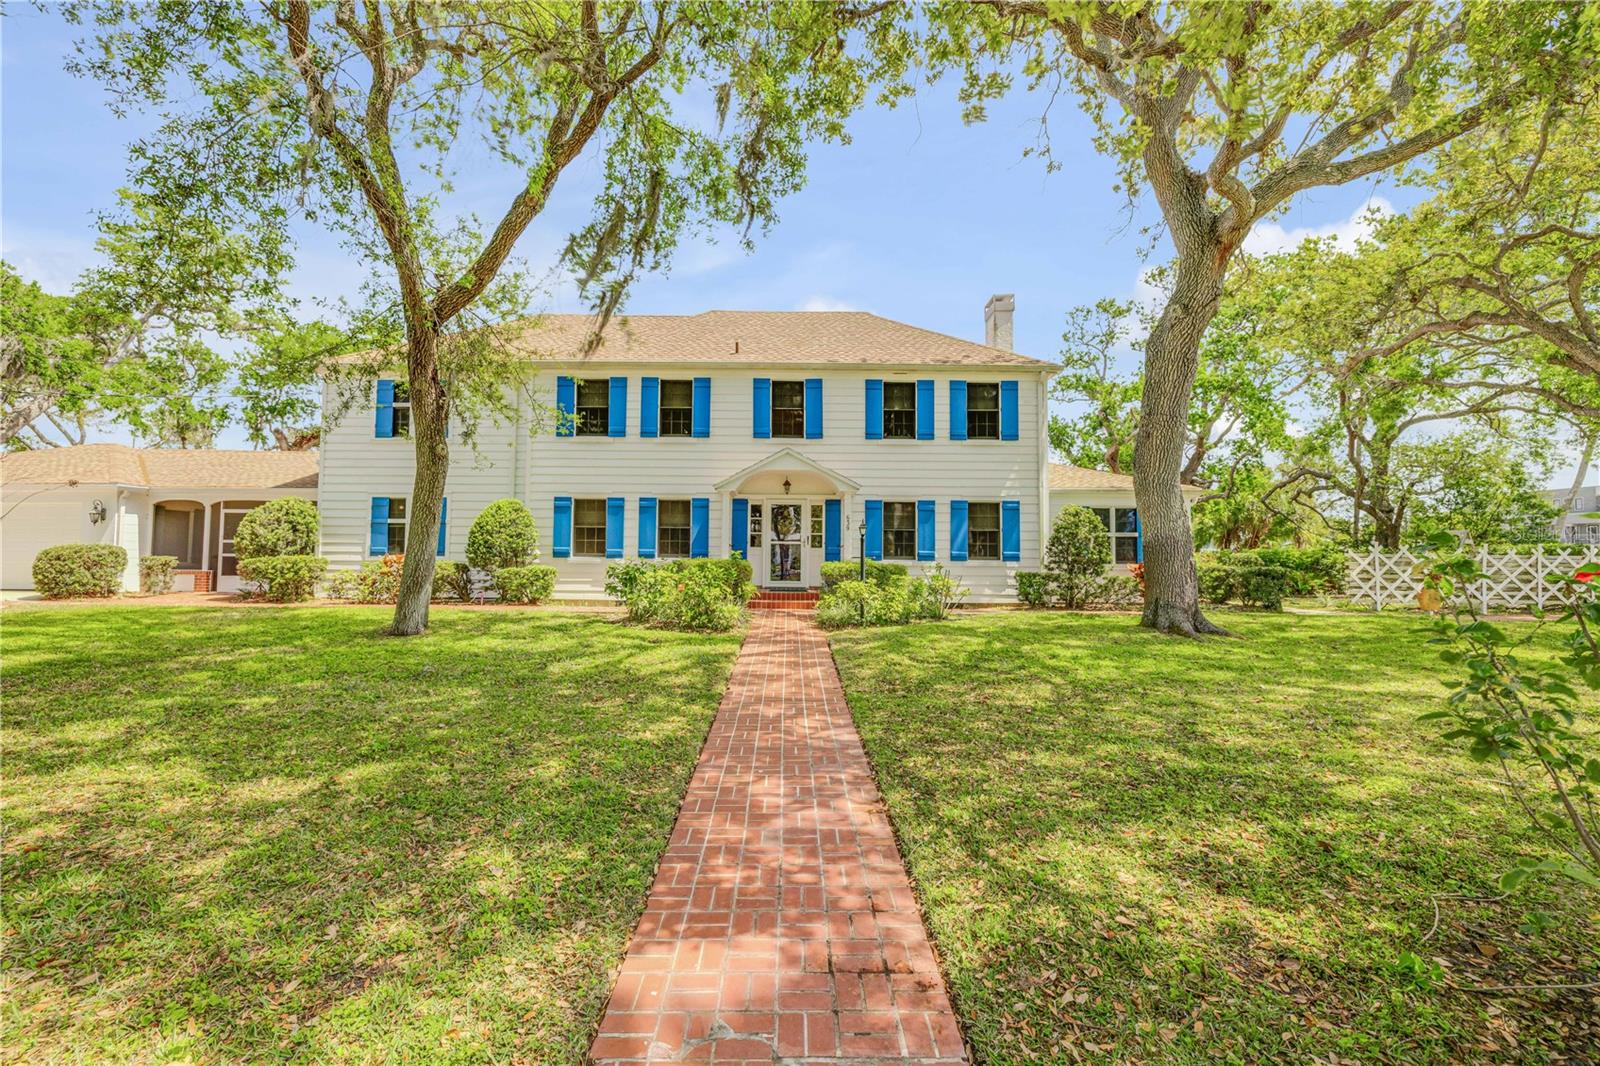
762 S Beach St, Ormond Beach, FL 32174
$-1,729
Cash flow
-13.4%
Cash-on-Cash Return
3.1%
Cap rate
0.5%
Rent to Value Ratio
Active
$649,900
3
bds
|
3
ba
|
2,184
sqft
|
built
1987
229 Riverbend Rd, Ormond Beach, FL 32174
$-885
Cash flow
-7.1%
Cash-on-Cash Return
4.5%
Cap rate
0.6%
Rent to Value Ratio
Active
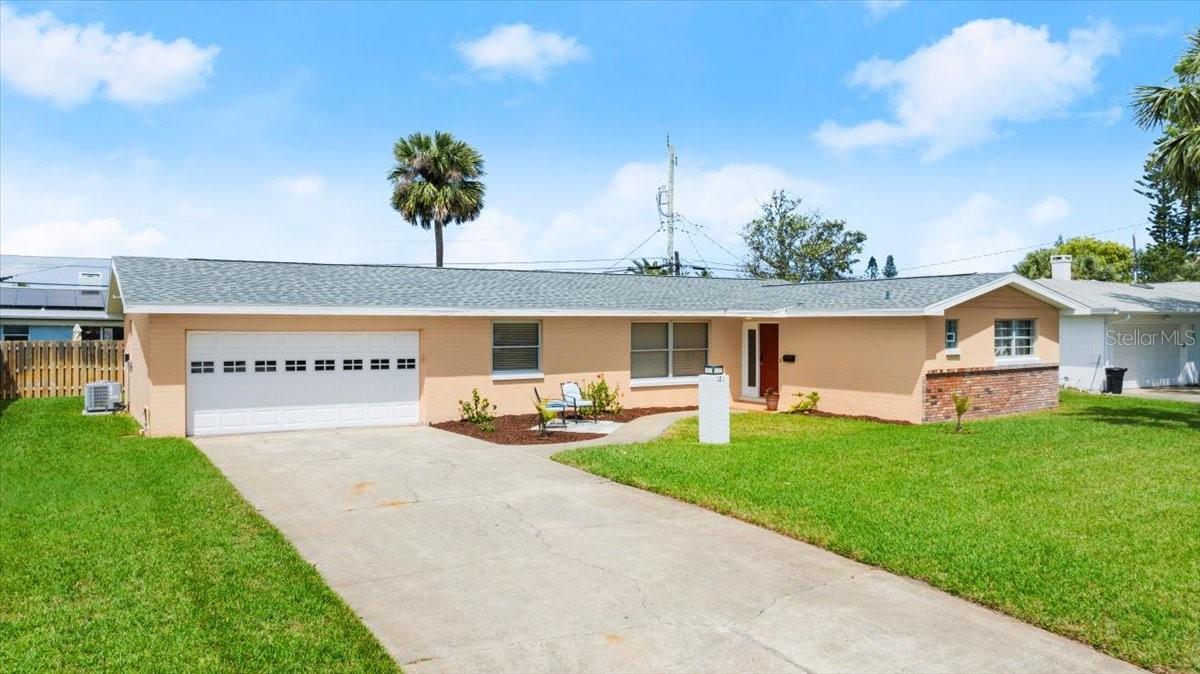
$285,500
3
bds
|
3
ba
|
1,775
sqft
|
built
1982
171 Fox Glen Ct, Ormond Beach, FL 32174
$11
Cash flow
0.2%
Cash-on-Cash Return
6.2%
Cap rate
0.8%
Rent to Value Ratio
Active
$380,000
2
bds
|
1
ba
|
1,088
sqft
|
built
1963
5 San Jose Cir, Ormond Beach, FL 32176
$-533
Cash flow
-7.3%
Cash-on-Cash Return
4.5%
Cap rate
0.6%
Rent to Value Ratio
Active
$445,000
3
bds
|
2
ba
|
1,666
sqft
|
built
1976
18 Buckingham Dr, Ormond Beach, FL 32176
$-929
Cash flow
-10.9%
Cash-on-Cash Return
3.6%
Cap rate
0.6%
Rent to Value Ratio

Active
$3,199,999
6
bds
|
8
ba
|
9,436
sqft
|
built
1902
253 John Anderson Dr, Ormond Beach, FL 32176
$-13,639
Cash flow
-22.2%
Cash-on-Cash Return
1.0%
Cap rate
0.2%
Rent to Value Ratio
Active
$399,000
3
bds
|
2
ba
|
1,986
sqft
|
built
1979
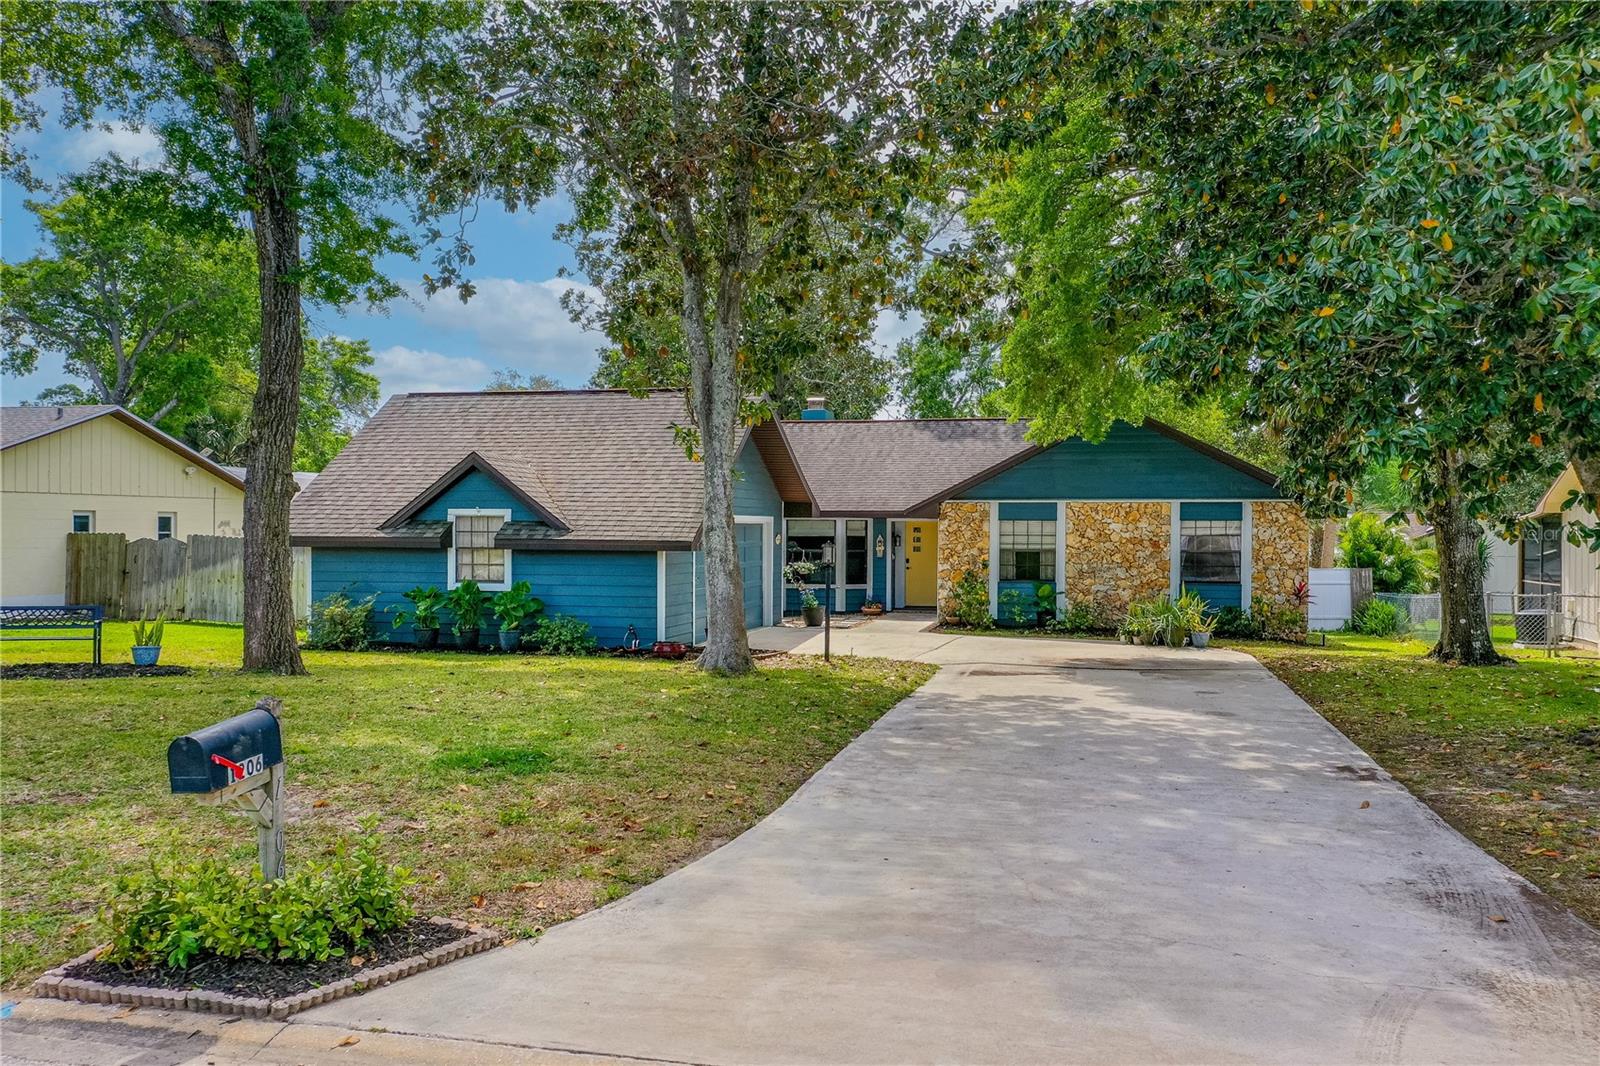
1206 Parkside Dr, Ormond Beach, FL 32174
$-473
Cash flow
-6.2%
Cash-on-Cash Return
4.7%
Cap rate
0.6%
Rent to Value Ratio

Active
$345,000
3
bds
|
2
ba
|
1,760
sqft
|
built
1988
717 S Ridgewood Ave, Ormond Beach, FL 32174
$-439
Cash flow
-6.6%
Cash-on-Cash Return
4.6%
Cap rate
0.7%
Rent to Value Ratio
Active
$1,400,000
5
bds
|
6
ba
|
4,948
sqft
|
built
1910
639 John Anderson Dr, Ormond Beach, FL 32176
$-4,482
Cash flow
-16.7%
Cash-on-Cash Return
2.3%
Cap rate
0.4%
Rent to Value Ratio

Active
$707,000
5
bds
|
3
ba
|
2,717
sqft
|
built
2015
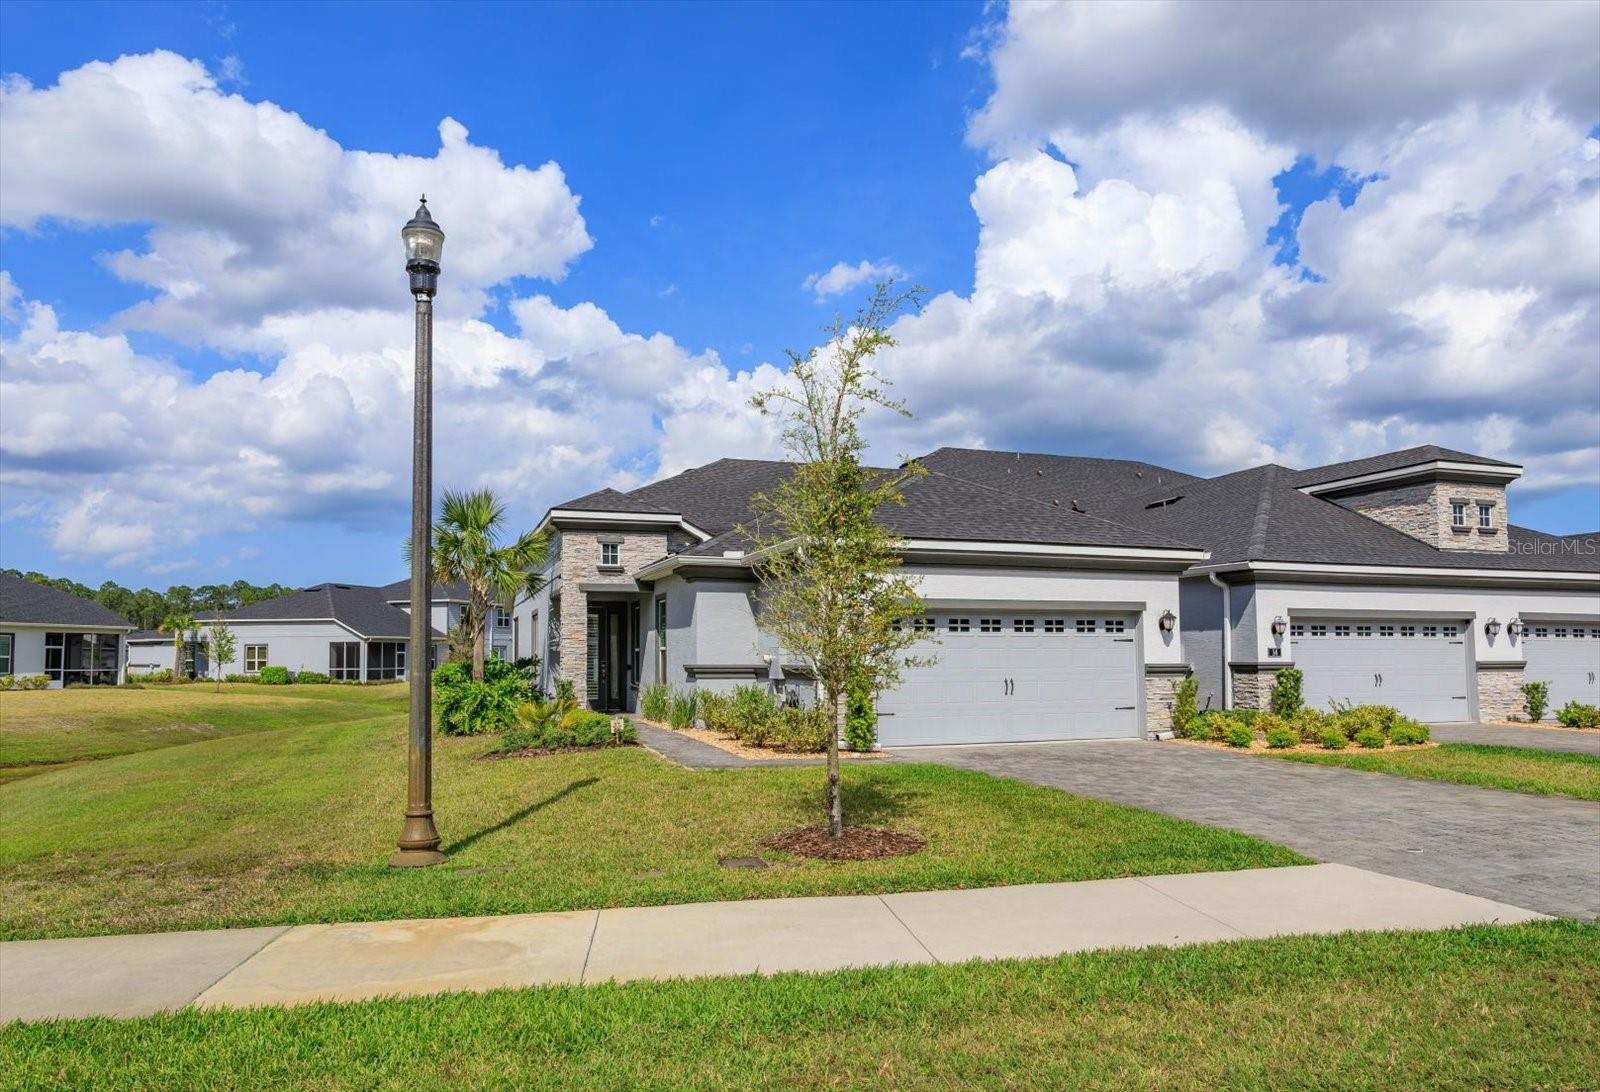
341 Chelsea Place Ave, Ormond Beach, FL 32174
$-2,214
Cash flow
-16.3%
Cash-on-Cash Return
2.4%
Cap rate
0.5%
Rent to Value Ratio
Active
$375,000
3
bds
|
2
ba
|
1,529
sqft
|
built
2021
16 Newhaven Ln, Ormond Beach, FL 32174
$-977
Cash flow
-13.6%
Cash-on-Cash Return
3.0%
Cap rate
0.7%
Rent to Value Ratio
Active
$400,000
3
bds
|
3
ba
|
1,956
sqft
|
built
1961
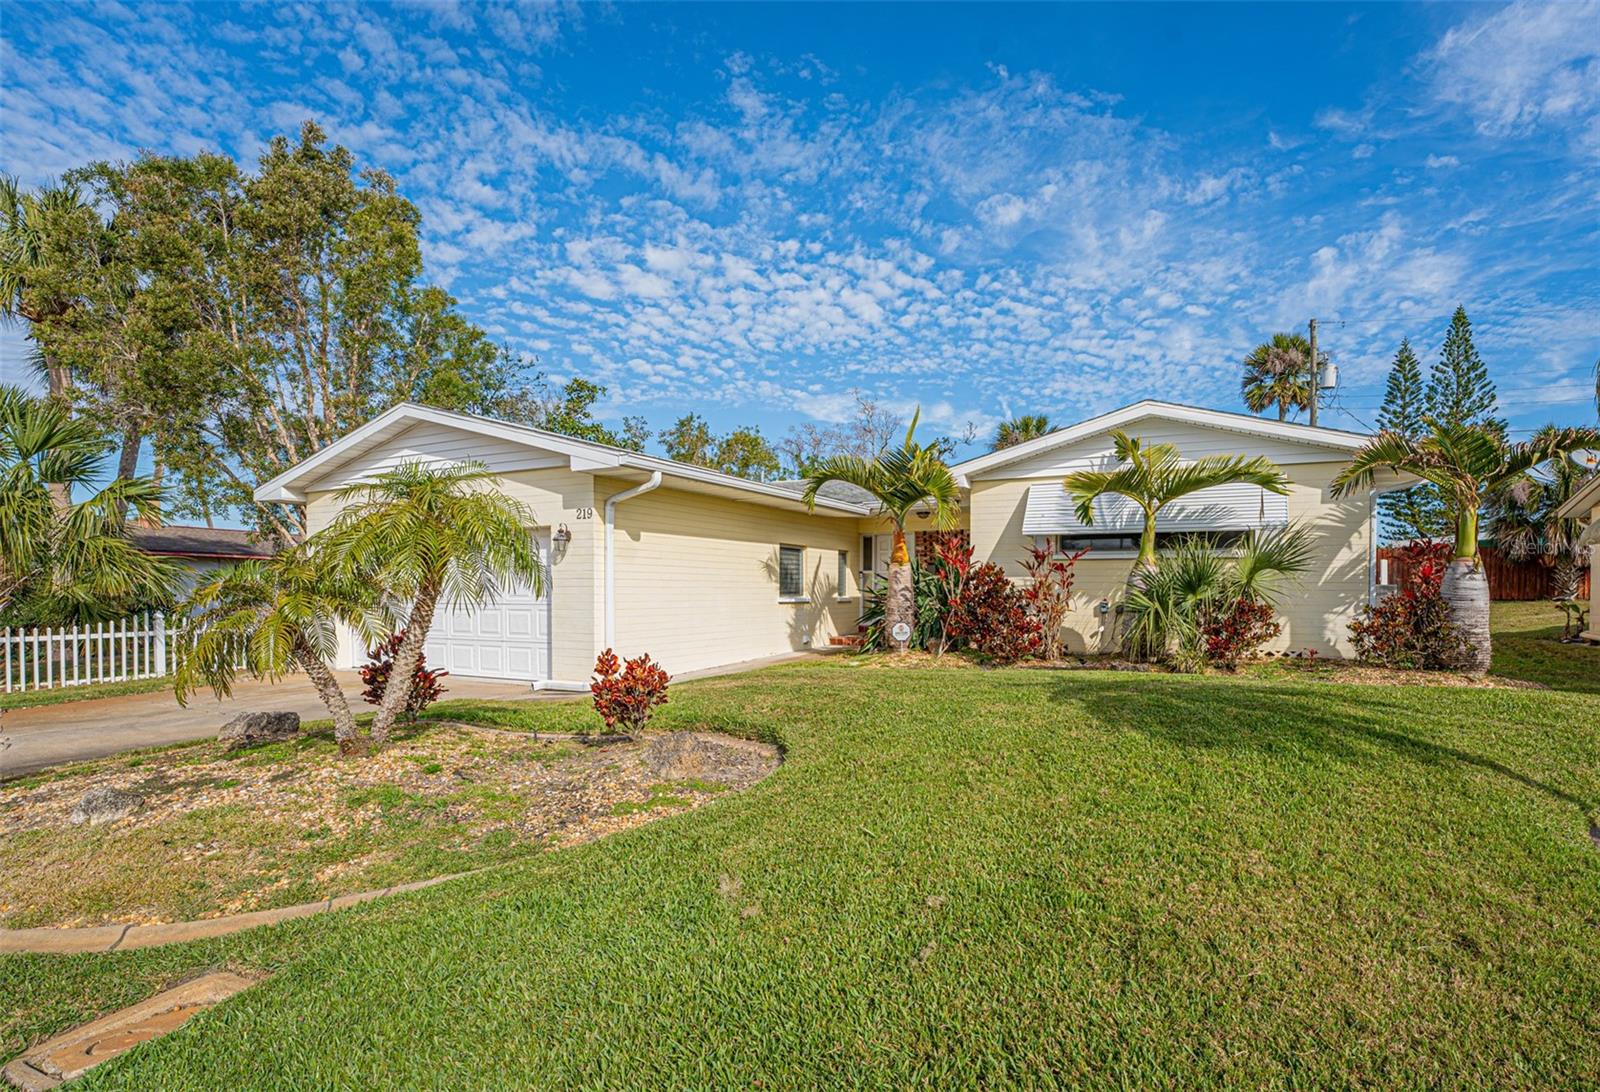
219 Lynnhurst Dr, Ormond Beach, FL 32176
$-289
Cash flow
-3.8%
Cash-on-Cash Return
5.3%
Cap rate
0.7%
Rent to Value Ratio
Active
$425,000
4
bds
|
2
ba
|
1,670
sqft
|
built
1963
121 Ellicott Dr, Ormond Beach, FL 32176
$-335
Cash flow
-4.1%
Cash-on-Cash Return
5.2%
Cap rate
0.7%
Rent to Value Ratio
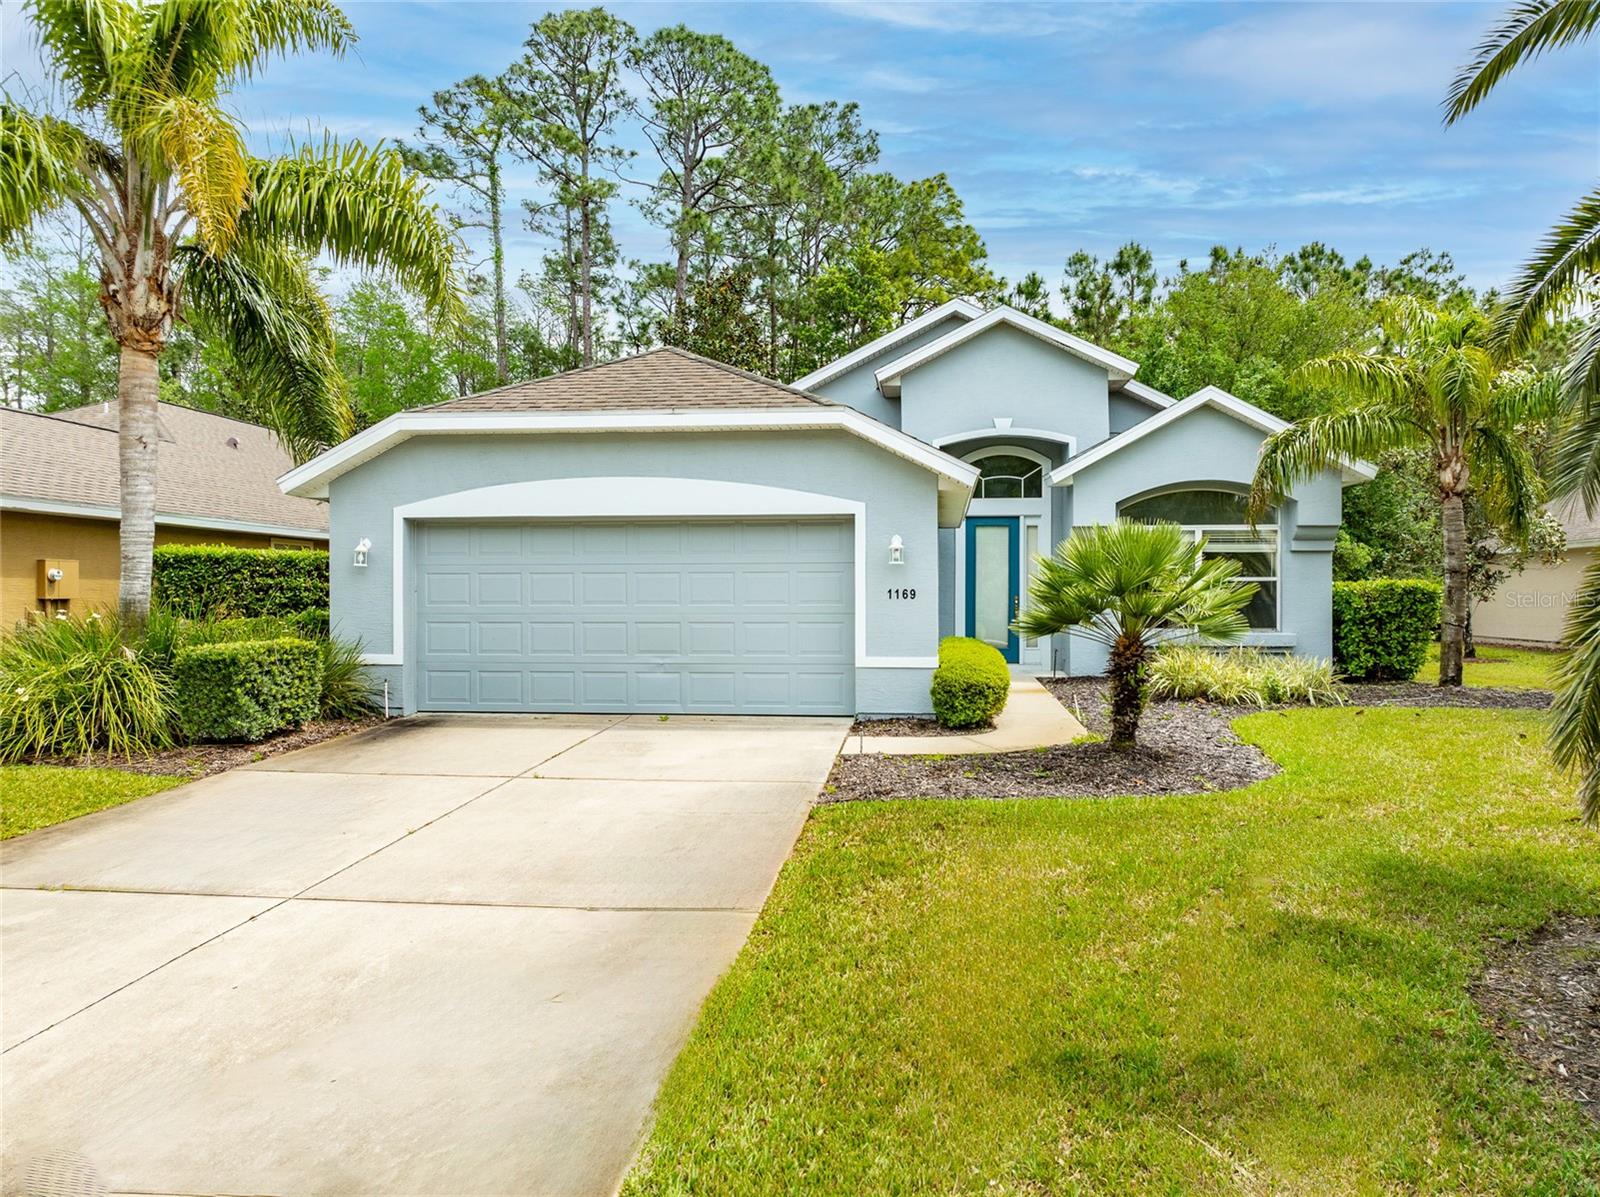
Active
$450,000
3
bds
|
2
ba
|
1,910
sqft
|
built
2006
1169 Kilkenny Ln, Ormond Beach, FL 32174
$-959
Cash flow
-11.1%
Cash-on-Cash Return
3.6%
Cap rate
0.6%
Rent to Value Ratio
Active
$249,500
3
bds
|
2
ba
|
1,260
sqft
|
built
1977
38 Snaresbrook Ct, Ormond Beach, FL 32174
$-103
Cash flow
-2.2%
Cash-on-Cash Return
5.7%
Cap rate
0.9%
Rent to Value Ratio
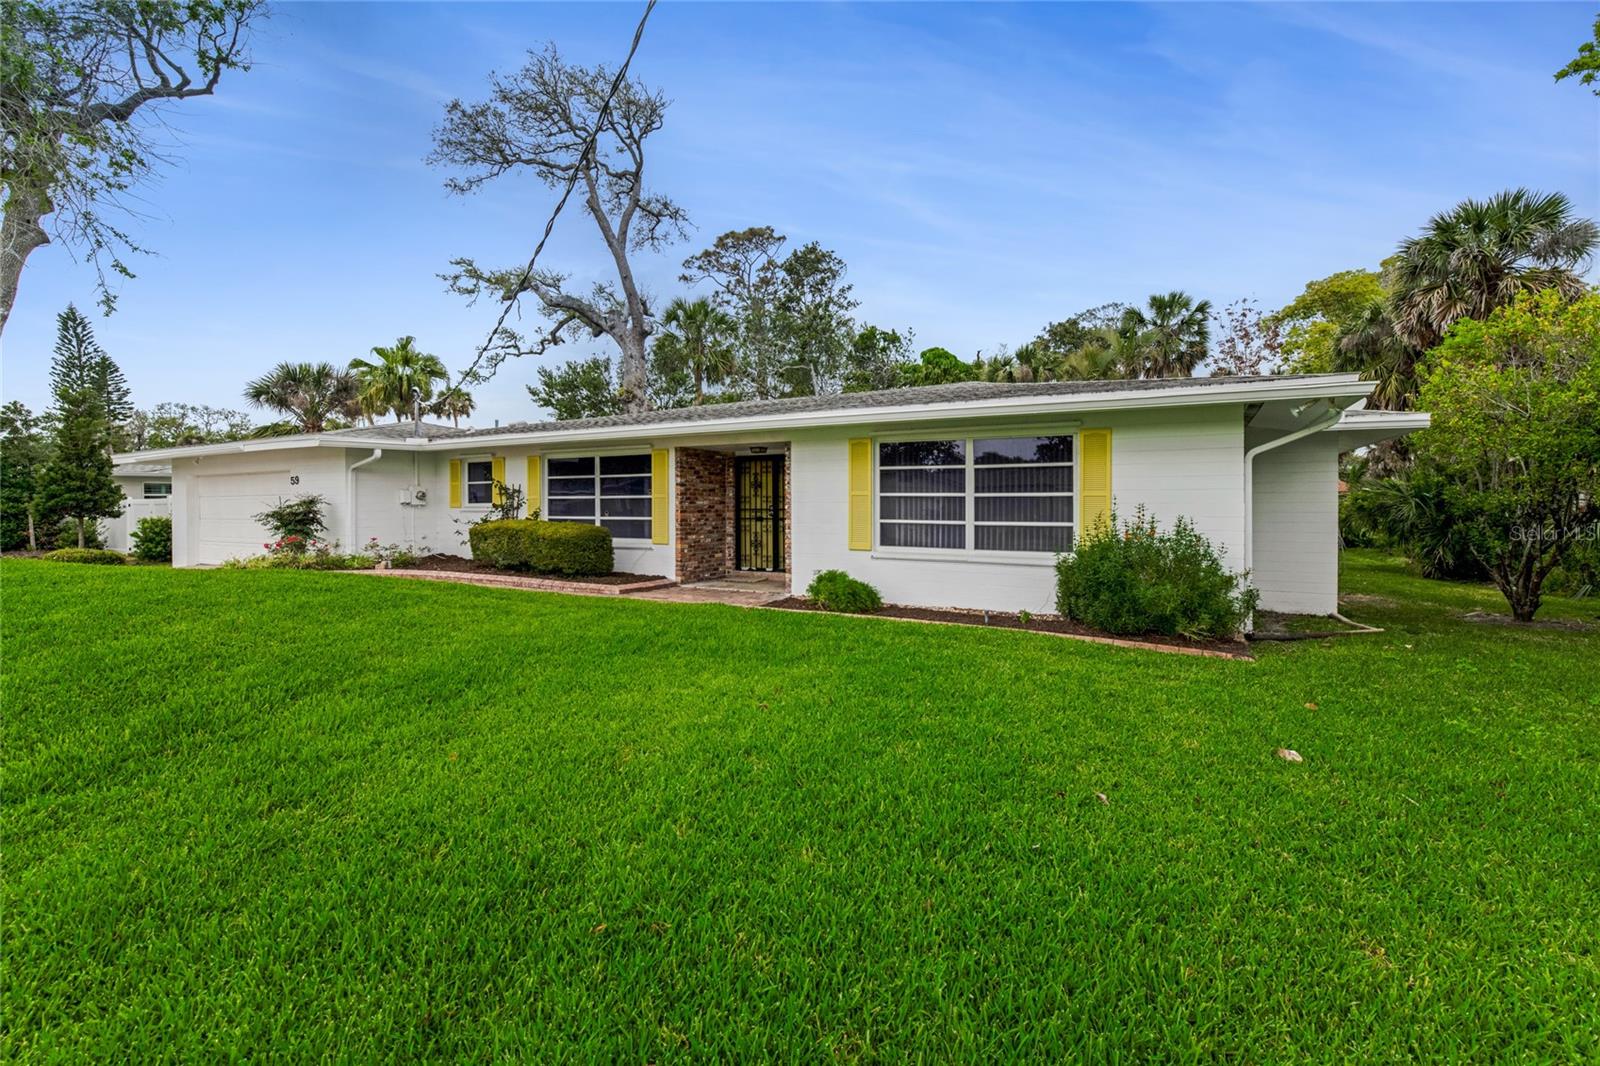
Active
$480,000
4
bds
|
3
ba
|
2,187
sqft
|
built
1963
59 Amsden Rd, Ormond Beach, FL 32176
$-1,054
Cash flow
-11.5%
Cash-on-Cash Return
3.5%
Cap rate
0.6%
Rent to Value Ratio
Active
$649,500
3
bds
|
2
ba
|
1,873
sqft
|
built
2014
642 Elk River Dr, Ormond Beach, FL 32174
$-1,736
Cash flow
-13.9%
Cash-on-Cash Return
2.9%
Cap rate
0.5%
Rent to Value Ratio
Active
$475,000
3
bds
|
3
ba
|
2,137
sqft
|
built
2022
27 Longridge Ln, Ormond Beach, FL 32174
$-1,387
Cash flow
-15.2%
Cash-on-Cash Return
2.6%
Cap rate
0.7%
Rent to Value Ratio
Active
$1,200,000
2
bds
|
4
ba
|
1,897
sqft
|
built
1954
2260 John Anderson Dr, Ormond Beach, FL 32176
$-4,620
Cash flow
-20.1%
Cash-on-Cash Return
1.5%
Cap rate
0.3%
Rent to Value Ratio
Active
$279,995
2
bds
|
2
ba
|
1,344
sqft
|
built
1982
2600 Ocean Shore Blvd, Ormond Beach, FL 32176
$-604
Cash flow
-11.3%
Cash-on-Cash Return
3.6%
Cap rate
0.6%
Rent to Value Ratio
Active
$260,000
2
bds
|
1
ba
|
1,278
sqft
|
built
1954
290 Pine St, Ormond Beach, FL 32174
$-260
Cash flow
-5.2%
Cash-on-Cash Return
4.9%
Cap rate
0.7%
Rent to Value Ratio

Active
$299,000
3
bds
|
2
ba
|
1,328
sqft
|
built
1968
614 Johnson Dr, Ormond Beach, FL 32174
$-343
Cash flow
-6.0%
Cash-on-Cash Return
4.8%
Cap rate
0.6%
Rent to Value Ratio
Active
$234,900
3
bds
|
3
ba
|
1,617
sqft
|
built
1985
130 Limewood Pl, Ormond Beach, FL 32174
$-421
Cash flow
-9.4%
Cash-on-Cash Return
4.0%
Cap rate
0.9%
Rent to Value Ratio
Active
$399,900
2
bds
|
2
ba
|
1,015
sqft
|
built
1956
30 Azalea Dr, Ormond Beach, FL 32176
$-871
Cash flow
-11.4%
Cash-on-Cash Return
3.5%
Cap rate
0.6%
Rent to Value Ratio

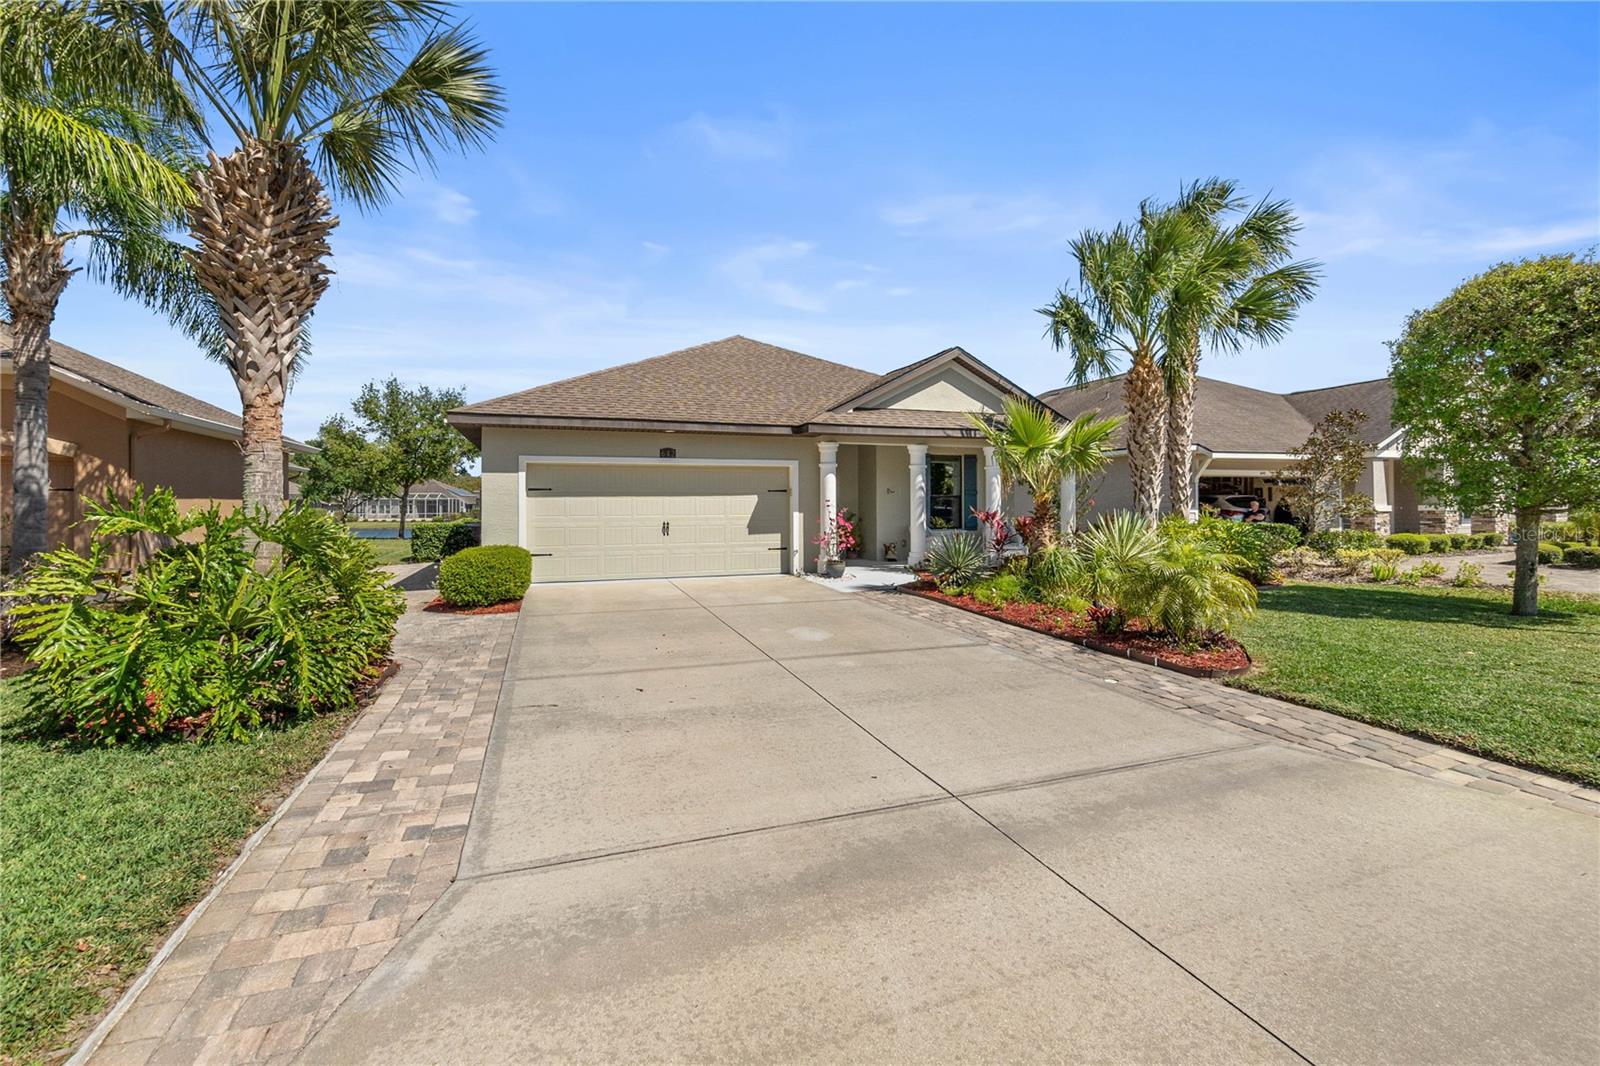
Active
$669,000
3
bds
|
2
ba
|
2,328
sqft
|
built
2014
1316 Harwick Ln, Ormond Beach, FL 32174
$-1,771
Cash flow
-13.8%
Cash-on-Cash Return
3.0%
Cap rate
0.5%
Rent to Value Ratio
Active
$529,000
4
bds
|
3
ba
|
2,625
sqft
|
built
1974
19 Twin River Dr, Ormond Beach, FL 32174
$-571
Cash flow
-5.6%
Cash-on-Cash Return
4.9%
Cap rate
0.7%
Rent to Value Ratio