Ormond Beach, FL Investment Properties for Sale
Browse homes for sale and investment properties in Ormond Beach, FL. Refine your search by price, property type, or more.
Best cash flowing properties in Ormond Beach, FL

Active
$259,000
2
bds
|
2
ba
|
1,396
sqft
|
built
1982
14 Butternut Cir, Ormond Beach, FL 32174
$9
Cash flow
0.2%
Cash-on-Cash Return
6.2%
Cap rate
0.8%
Rent to Value Ratio

Active
$299,500
2
bds
|
1
ba
|
942
sqft
|
built
1956
37 Seaside Dr, Ormond Beach, FL 32176
$-84
Cash flow
-1.5%
Cash-on-Cash Return
5.8%
Cap rate
0.8%
Rent to Value Ratio
341 out of 399 properties for sale in Ormond Beach, FL
Limited Results Shown
Create a free account, or log in to reveal all property listings and enjoy the complete experience.
Active
$234,900
3
bds
|
3
ba
|
1,617
sqft
|
built
1985
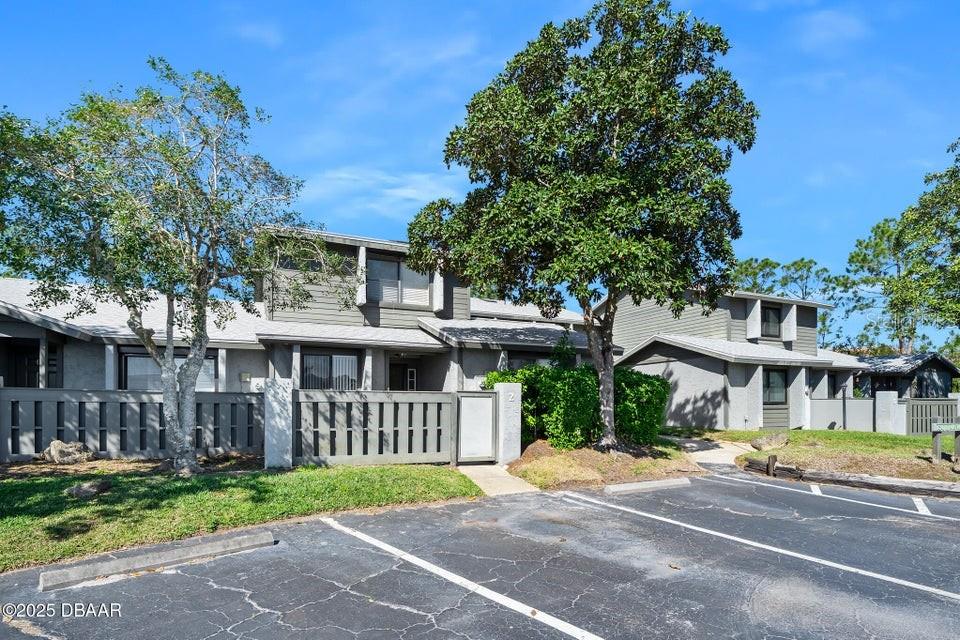
130 Limewood Pl, Ormond Beach, FL 32174
$-421
Cash flow
-9.4%
Cash-on-Cash Return
4.0%
Cap rate
0.9%
Rent to Value Ratio

Active
$669,000
3
bds
|
2
ba
|
2,328
sqft
|
built
2014
1316 Harwick Ln, Ormond Beach, FL 32174
$-1,771
Cash flow
-13.8%
Cash-on-Cash Return
3.0%
Cap rate
0.5%
Rent to Value Ratio
Active
$529,000
4
bds
|
3
ba
|
2,625
sqft
|
built
1974
19 Twin River Dr, Ormond Beach, FL 32174
$-571
Cash flow
-5.6%
Cash-on-Cash Return
4.9%
Cap rate
0.7%
Rent to Value Ratio
Active
$660,000
4
bds
|
3
ba
|
3,040
sqft
|
built
1976
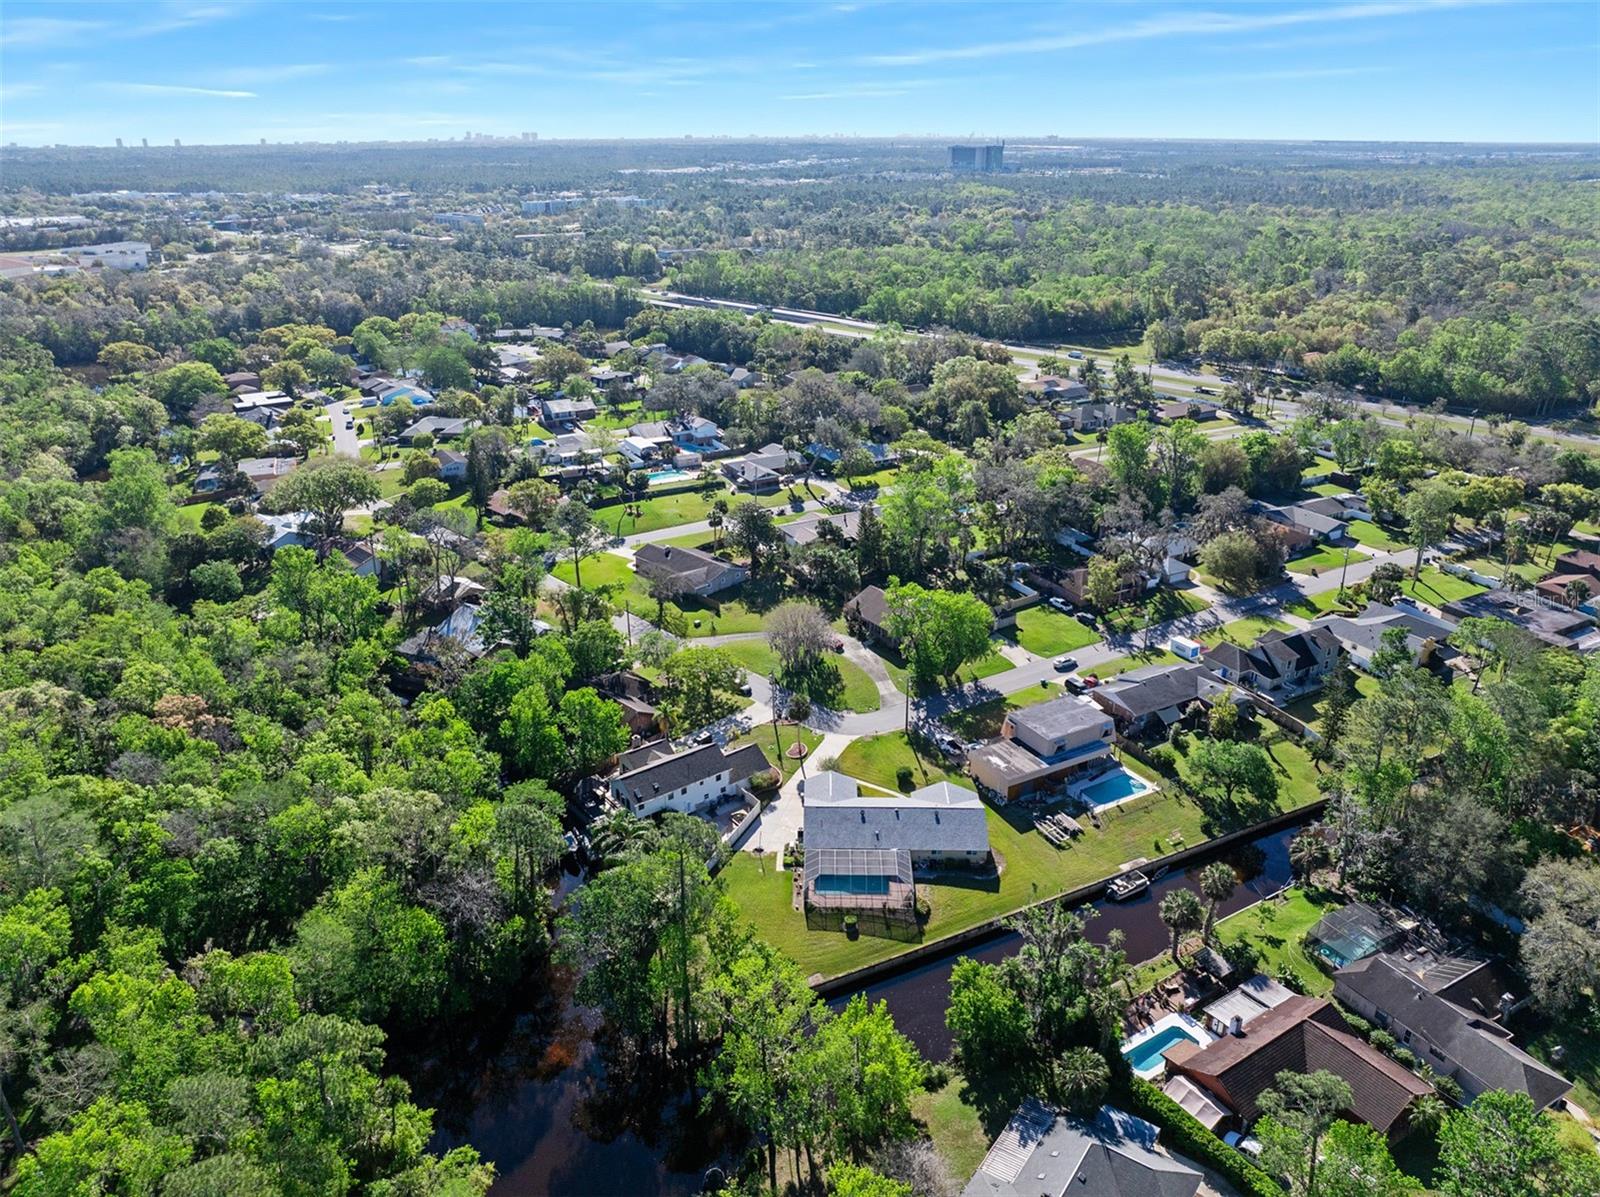
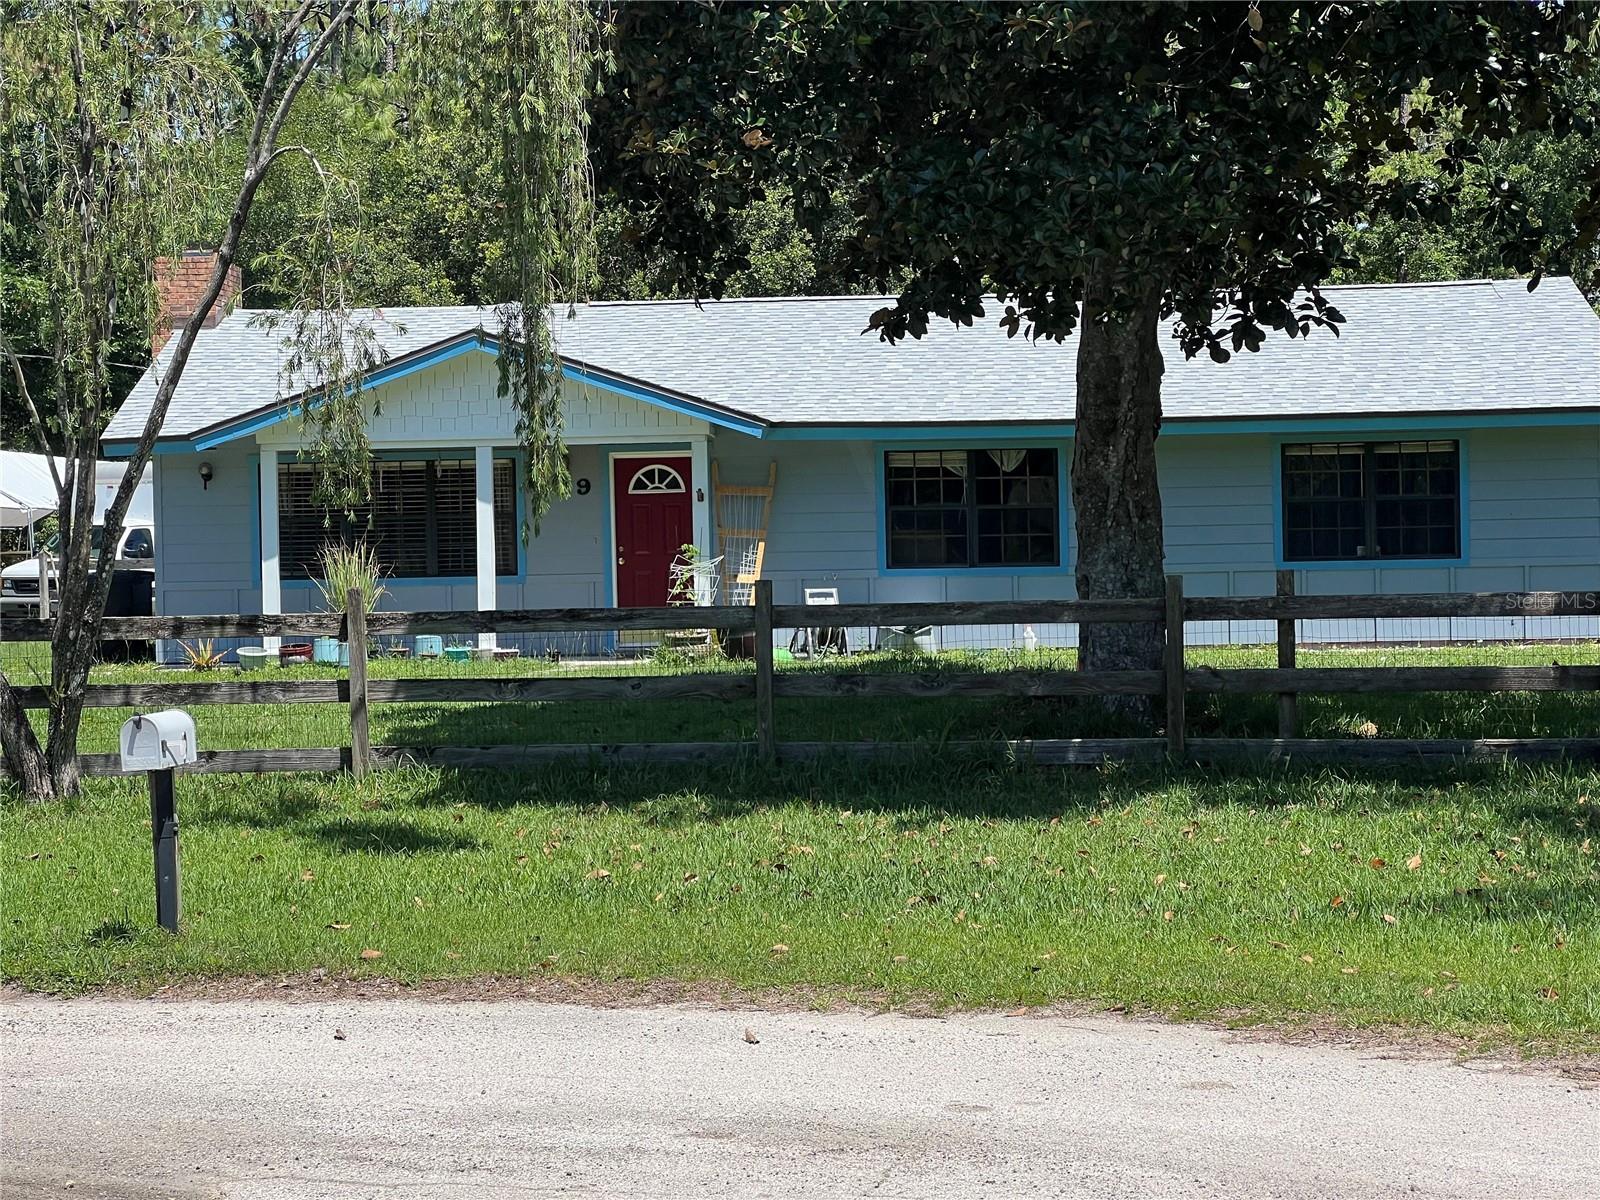
9 Shadow Ln, Ormond Beach, FL 32174
$-1,521
Cash flow
-12.0%
Cash-on-Cash Return
3.4%
Cap rate
0.5%
Rent to Value Ratio
Active
$527,500
3
bds
|
2
ba
|
1,867
sqft
|
built
1988
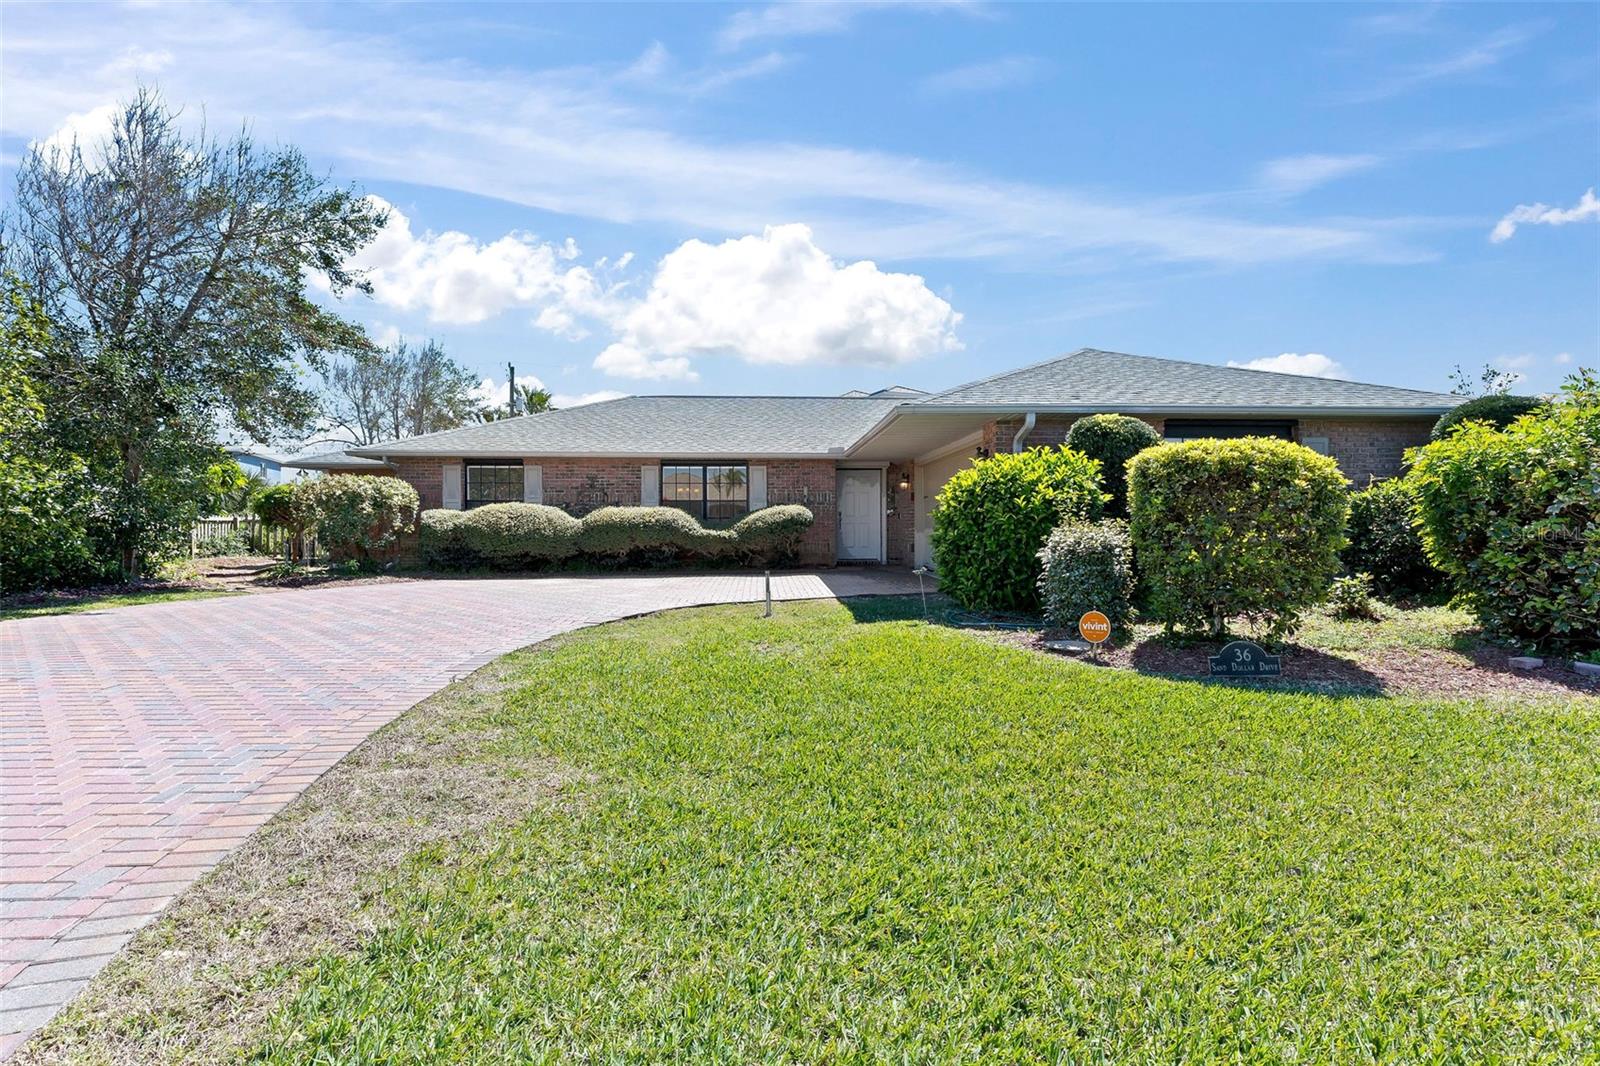
36 Sand Dollar Dr, Ormond Beach, FL 32176
$-1,351
Cash flow
-13.4%
Cash-on-Cash Return
3.1%
Cap rate
0.5%
Rent to Value Ratio
Active
$439,000
3
bds
|
3
ba
|
2,107
sqft
|
built
2006
3145 Connemara Dr, Ormond Beach, FL 32174
$-1,067
Cash flow
-12.7%
Cash-on-Cash Return
3.2%
Cap rate
0.6%
Rent to Value Ratio
Active
$849,000
4
bds
|
3
ba
|
2,537
sqft
|
built
2021
354 Stirling Bridge Dr, Ormond Beach, FL 32174
$-2,198
Cash flow
-13.5%
Cash-on-Cash Return
3.0%
Cap rate
0.5%
Rent to Value Ratio

Active
$300,000
2
bds
|
2
ba
|
1,275
sqft
|
built
1987
3370 Ocean Shore Blvd, Ormond Beach, FL 32176
$-1,309
Cash flow
-22.8%
Cash-on-Cash Return
0.9%
Cap rate
0.8%
Rent to Value Ratio
Active
$299,500
2
bds
|
1
ba
|
942
sqft
|
built
1956
37 Seaside Dr, Ormond Beach, FL 32176
$-84
Cash flow
-1.5%
Cash-on-Cash Return
5.8%
Cap rate
0.8%
Rent to Value Ratio
Active
$299,000
3
bds
|
3
ba
|
1,696
sqft
|
built
1978
210 Pine Cone Trl, Ormond Beach, FL 32174
$-215
Cash flow
-3.8%
Cash-on-Cash Return
5.3%
Cap rate
0.8%
Rent to Value Ratio
Active
$540,000
4
bds
|
2
ba
|
2,427
sqft
|
built
2000
6 Greenvale Dr, Ormond Beach, FL 32174
$-1,173
Cash flow
-11.3%
Cash-on-Cash Return
3.5%
Cap rate
0.6%
Rent to Value Ratio
Active
$355,000
3
bds
|
2
ba
|
1,488
sqft
|
built
1973
44 Sunset Blvd, Ormond Beach, FL 32176
$-557
Cash flow
-8.2%
Cash-on-Cash Return
4.3%
Cap rate
0.7%
Rent to Value Ratio
Active
$529,000
4
bds
|
3
ba
|
2,534
sqft
|
built
2009
376 Chelsea Place Ave, Ormond Beach, FL 32174
$-1,453
Cash flow
-14.3%
Cash-on-Cash Return
2.9%
Cap rate
0.6%
Rent to Value Ratio
Active
$695,000
4
bds
|
3
ba
|
2,531
sqft
|
built
2023
14 Deerfield Ct, Ormond Beach, FL 32174
$-1,624
Cash flow
-12.2%
Cash-on-Cash Return
3.3%
Cap rate
0.6%
Rent to Value Ratio
Active
$399,900
2
bds
|
2
ba
|
1,687
sqft
|
built
2021
3329 Bailey Ann Dr, Ormond Beach, FL 32174
$-880
Cash flow
-11.5%
Cash-on-Cash Return
3.5%
Cap rate
0.7%
Rent to Value Ratio
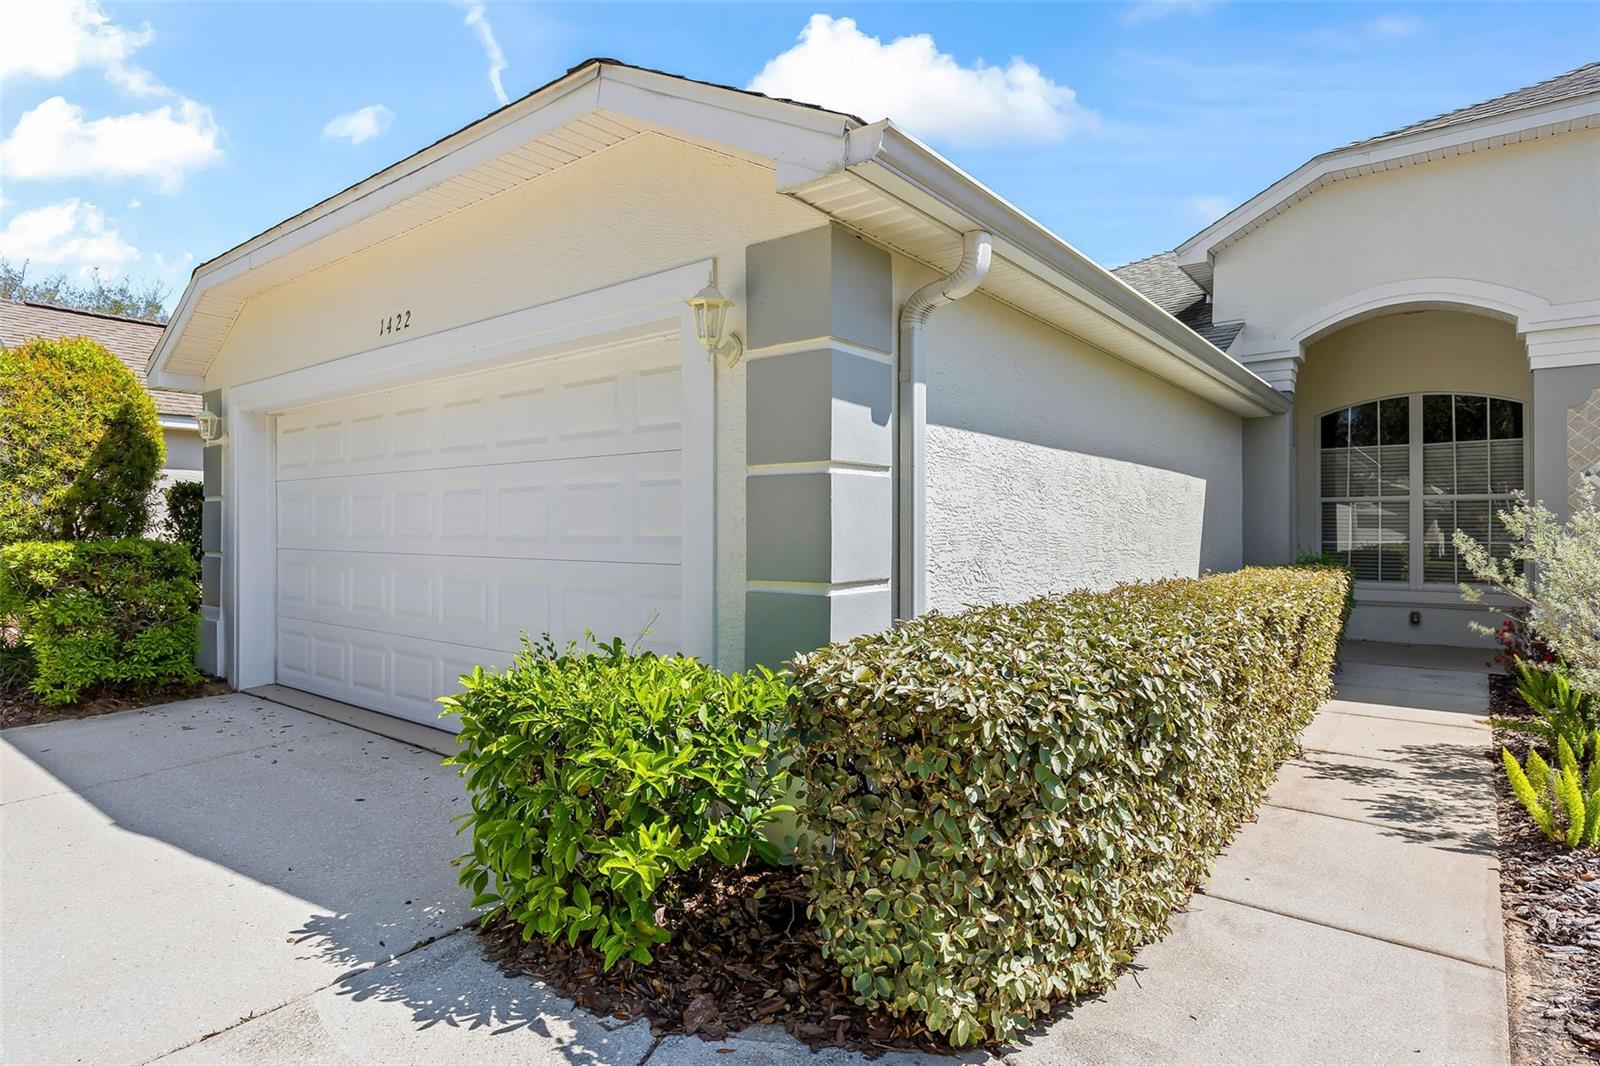
Active
$334,900
3
bds
|
2
ba
|
1,684
sqft
|
built
2006
1422 Carlow Cir, Ormond Beach, FL 32174
$-662
Cash flow
-10.3%
Cash-on-Cash Return
3.8%
Cap rate
0.7%
Rent to Value Ratio
Active
$529,000
3
bds
|
3
ba
|
2,641
sqft
|
built
2014
3232 Tralee Dr, Ormond Beach, FL 32174
$-910
Cash flow
-9.0%
Cash-on-Cash Return
4.1%
Cap rate
0.7%
Rent to Value Ratio
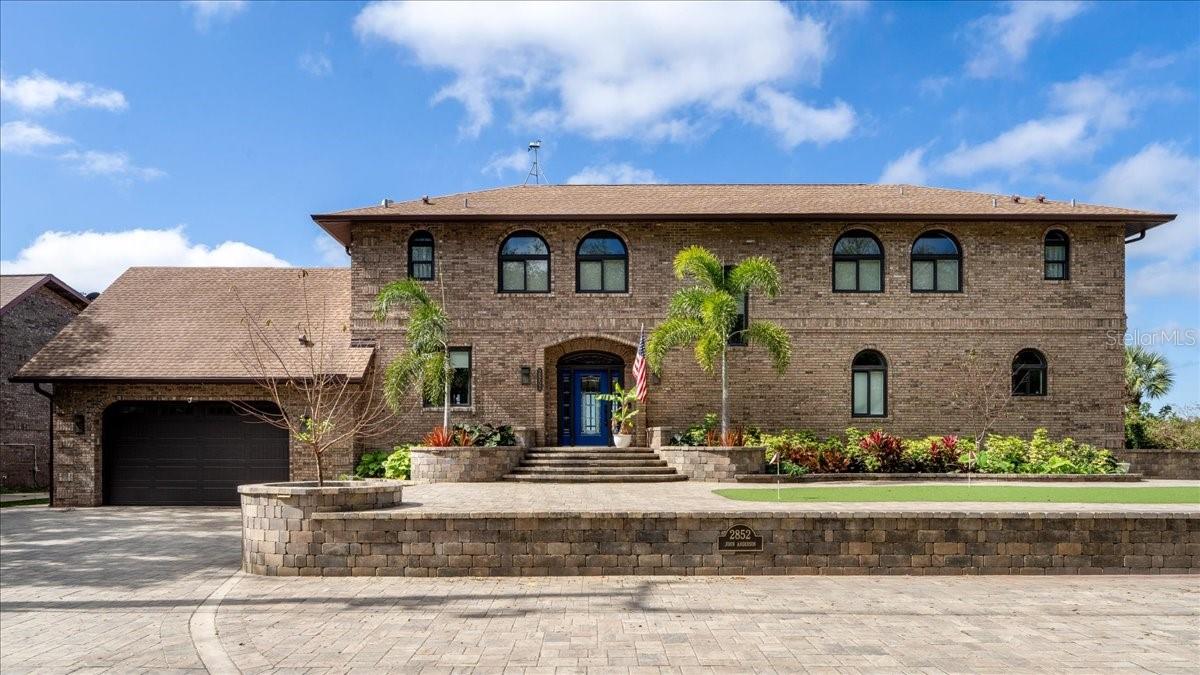
Active
$1,444,000
5
bds
|
5
ba
|
3,808
sqft
|
built
1990
2852 John Anderson Dr, Ormond Beach, FL 32176
$-3,155
Cash flow
-11.4%
Cash-on-Cash Return
3.5%
Cap rate
0.4%
Rent to Value Ratio
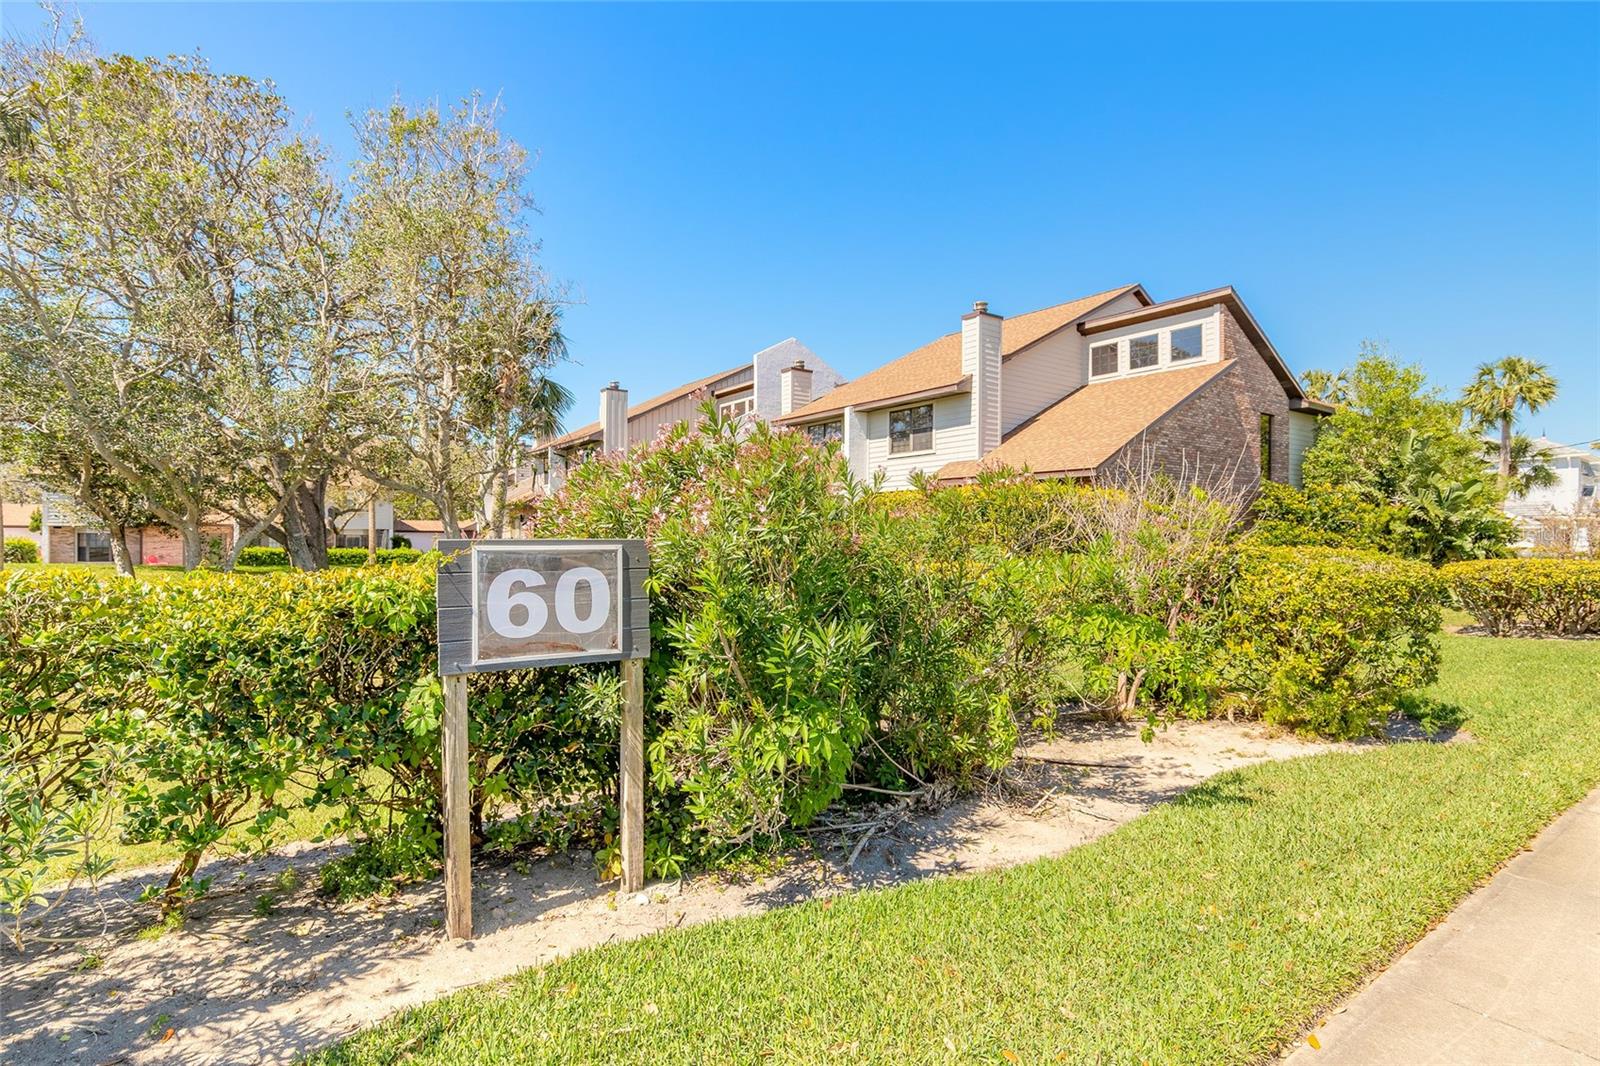
Active
$329,900
2
bds
|
3
ba
|
1,775
sqft
|
built
1984
60 N Halifax Dr, Ormond Beach, FL 32176
$-417
Cash flow
-6.6%
Cash-on-Cash Return
4.6%
Cap rate
0.6%
Rent to Value Ratio
Active
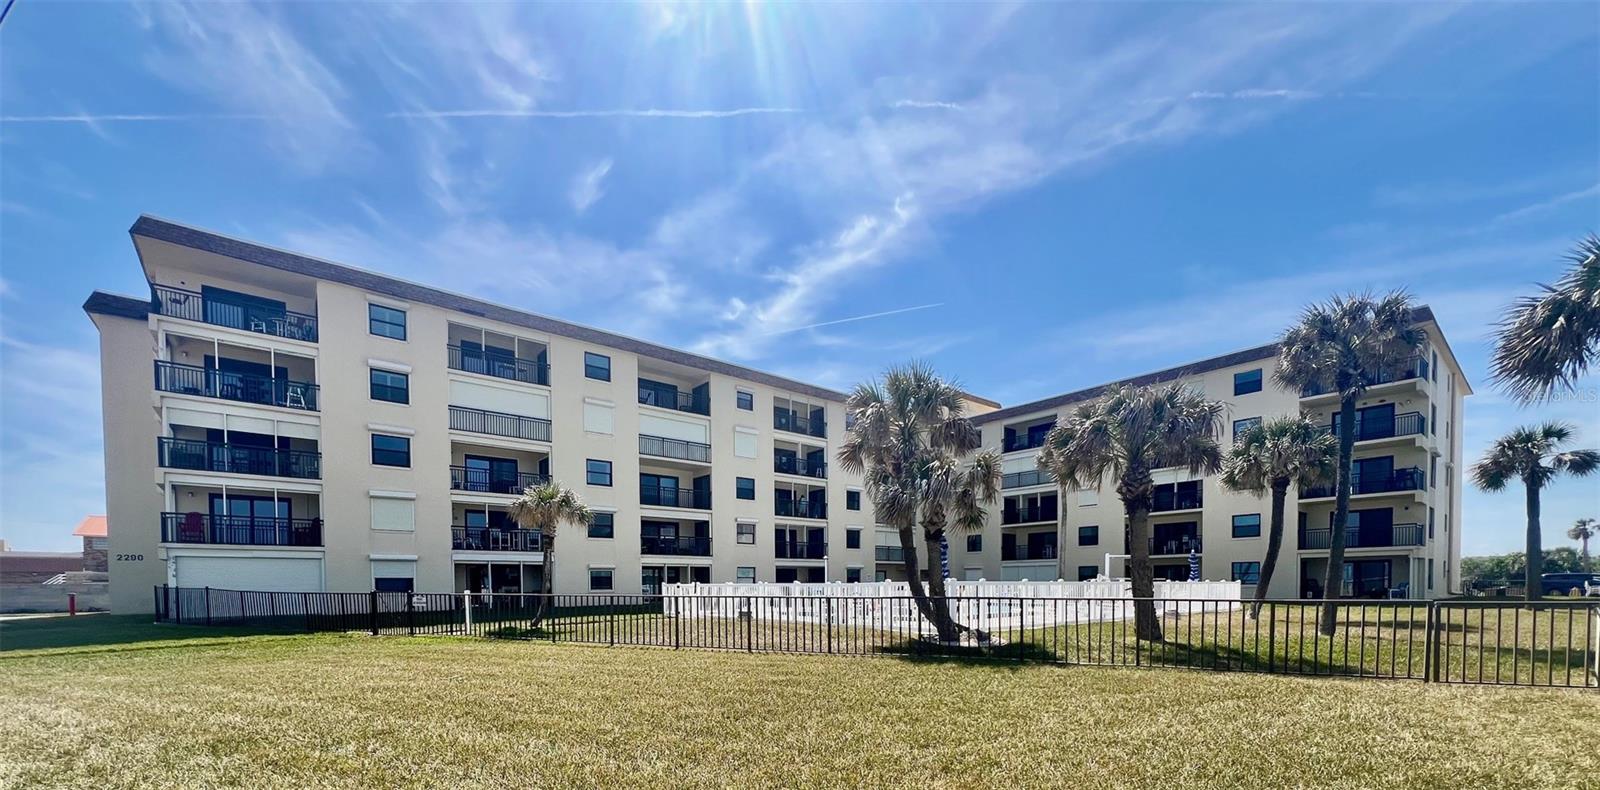
$249,999
2
bds
|
2
ba
|
1,132
sqft
|
built
1984
2290 Ocean Shore Blvd, Ormond Beach, FL 32176
$-145
Cash flow
-3.0%
Cash-on-Cash Return
5.5%
Cap rate
0.9%
Rent to Value Ratio
Active
$1,849,000
4
bds
|
4
ba
|
2,428
sqft
|
built
1969
382 Riverside Dr, Ormond Beach, FL 32176
$-8,044
Cash flow
-22.7%
Cash-on-Cash Return
0.9%
Cap rate
0.2%
Rent to Value Ratio
Active
$613,900
3
bds
|
3
ba
|
2,621
sqft
|
built
2006
1432 Kinnard Cir, Ormond Beach, FL 32174
$-1,121
Cash flow
-9.5%
Cash-on-Cash Return
4.0%
Cap rate
0.6%
Rent to Value Ratio
Active
$799,900
3
bds
|
2
ba
|
1,979
sqft
|
built
2022
358 Stirling Bridge Dr, Ormond Beach, FL 32174
$-2,426
Cash flow
-15.8%
Cash-on-Cash Return
2.5%
Cap rate
0.4%
Rent to Value Ratio
Active
$749,000
5
bds
|
3
ba
|
3,430
sqft
|
built
2010
1204 Draycott St, Ormond Beach, FL 32174
$-2,327
Cash flow
-16.2%
Cash-on-Cash Return
2.4%
Cap rate
0.5%
Rent to Value Ratio
Active
$829,900
3
bds
|
3
ba
|
2,515
sqft
|
built
2006
1425 Ocean Shore Blvd, Ormond Beach, FL 32176
$-3,034
Cash flow
-19.1%
Cash-on-Cash Return
1.8%
Cap rate
0.6%
Rent to Value Ratio
Active
$4,999,900
5
bds
|
4
ba
|
3,553
sqft
|
built
1952
201 Ocean Shore Blvd, Ormond Beach, FL 32176
$-26,056
Cash flow
-27.2%
Cash-on-Cash Return
-0.1%
Cap rate
0.1%
Rent to Value Ratio
Active
$259,000
2
bds
|
2
ba
|
1,396
sqft
|
built
1982
14 Butternut Cir, Ormond Beach, FL 32174
$9
Cash flow
0.2%
Cash-on-Cash Return
6.2%
Cap rate
0.8%
Rent to Value Ratio
Active
$575,000
3
bds
|
3
ba
|
2,370
sqft
|
built
1971
1133 Ocean Shore Blvd, Ormond Beach, FL 32176
$-1,089
Cash flow
-9.9%
Cash-on-Cash Return
3.9%
Cap rate
0.6%
Rent to Value Ratio

Active
$375,000
2
bds
|
2
ba
|
1,065
sqft
|
built
1971
1133 Ocean Shore Blvd, Ormond Beach, FL 32176
$-458
Cash flow
-6.4%
Cash-on-Cash Return
4.7%
Cap rate
0.7%
Rent to Value Ratio
Active
$959,000
3
bds
|
3
ba
|
2,494
sqft
|
built
1996
113 Avalon Dr, Ormond Beach, FL 32176
$-3,529
Cash flow
-19.2%
Cash-on-Cash Return
1.7%
Cap rate
0.3%
Rent to Value Ratio
Active
$259,000
2
bds
|
2
ba
|
925
sqft
|
built
1986
2700 Ocean Shore Blvd, Ormond Beach, FL 32176
$-1,163
Cash flow
-23.4%
Cash-on-Cash Return
0.8%
Cap rate
0.8%
Rent to Value Ratio
Active
$320,000
2
bds
|
2
ba
|
1,542
sqft
|
built
2005
1145 Hansberry Ct, Ormond Beach, FL 32174
$-629
Cash flow
-10.3%
Cash-on-Cash Return
3.8%
Cap rate
0.7%
Rent to Value Ratio
Active
$410,000
2
bds
|
2
ba
|
1,529
sqft
|
built
2023
25 Southampton St, Ormond Beach, FL 32174
$-777
Cash flow
-9.9%
Cash-on-Cash Return
3.9%
Cap rate
0.7%
Rent to Value Ratio
Active
$362,000
2
bds
|
3
ba
|
1,604
sqft
|
built
2010
1320 Hansberry Ln, Ormond Beach, FL 32174
$-957
Cash flow
-13.8%
Cash-on-Cash Return
3.0%
Cap rate
0.7%
Rent to Value Ratio
Active
$769,000
3
bds
|
2
ba
|
1,900
sqft
|
built
1984
3390 Ocean Shore Blvd, Ormond Beach, FL 32176
$-2,415
Cash flow
-16.4%
Cash-on-Cash Return
2.4%
Cap rate
0.5%
Rent to Value Ratio
Active
$450,000
3
bds
|
3
ba
|
1,627
sqft
|
built
1956
72 Rockefeller Dr, Ormond Beach, FL 32176
$-907
Cash flow
-10.5%
Cash-on-Cash Return
3.7%
Cap rate
0.6%
Rent to Value Ratio
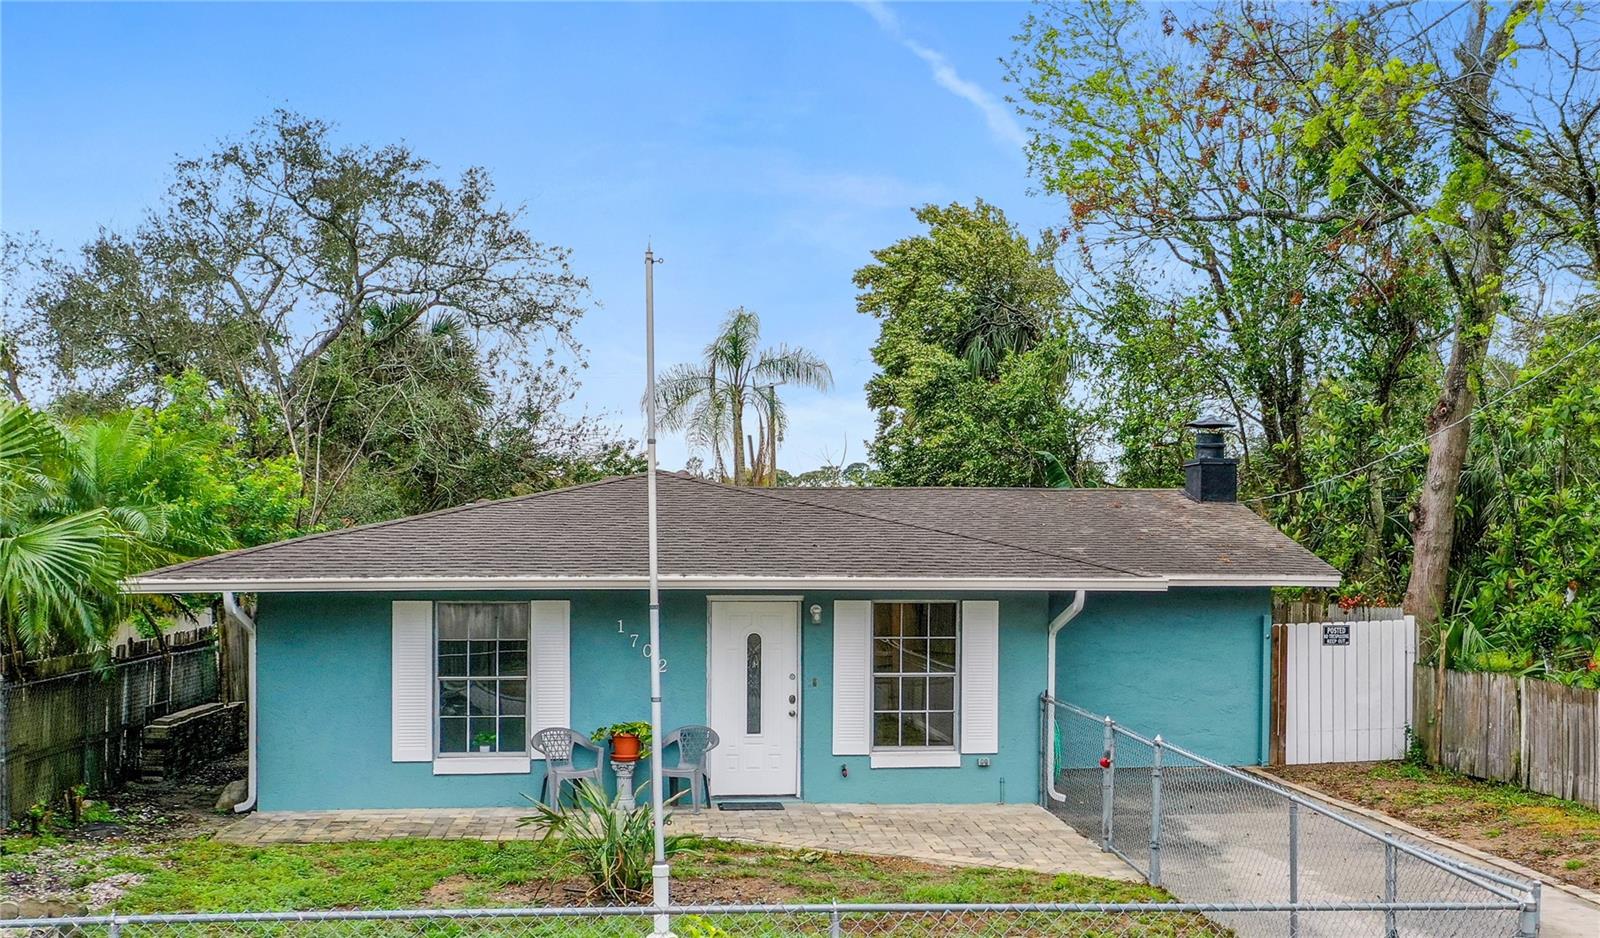
Active
$250,000
2
bds
|
1
ba
|
1,396
sqft
|
built
1978
1702 Carolina Ave, Ormond Beach, FL 32174
$-100
Cash flow
-2.1%
Cash-on-Cash Return
5.7%
Cap rate
0.7%
Rent to Value Ratio
Active
$625,000
3
bds
|
2
ba
|
1,638
sqft
|
built
2002
111 Heron Dunes Dr, Ormond Beach, FL 32176
$-1,384
Cash flow
-11.6%
Cash-on-Cash Return
3.5%
Cap rate
0.5%
Rent to Value Ratio
Active
$529,900
2
bds
|
3
ba
|
1,854
sqft
|
built
1980
901 S Atlantic Ave, Ormond Beach, FL 32176
$-652
Cash flow
-6.4%
Cash-on-Cash Return
4.7%
Cap rate
0.7%
Rent to Value Ratio
Active
$610,000
4
bds
|
3
ba
|
2,735
sqft
|
built
2021
210 Cypress Trail Dr, Ormond Beach, FL 32174
$-1,536
Cash flow
-13.1%
Cash-on-Cash Return
3.1%
Cap rate
0.5%
Rent to Value Ratio