Oxford, FL Investment Properties for Sale
Browse homes for sale and investment properties in Oxford, FL. Refine your search by price, property type, or more.
Best cash flowing properties in Oxford, FL
Active
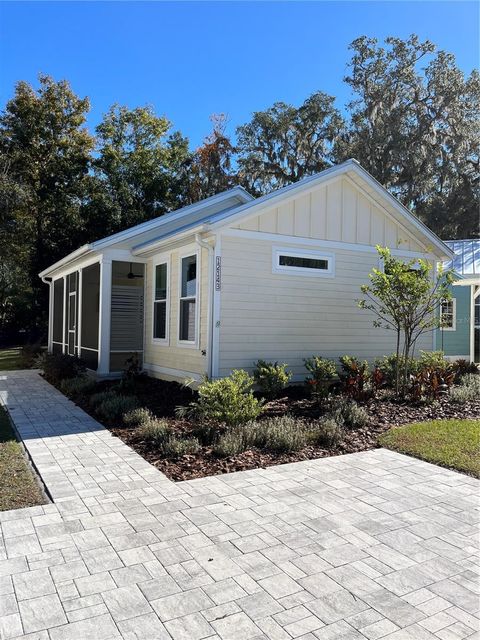
$168,500
2
bds
|
2
ba
|
772
sqft
|
built
2022
12143 Grand Oak Ln, Oxford, FL 34484
$50
Cash flow
1.5%
Cash-on-Cash Return
6.5%
Cap rate
1.0%
Rent to Value Ratio
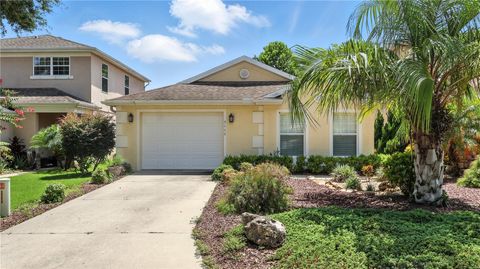
Active
$255,000
3
bds
|
2
ba
|
1,342
sqft
|
built
2009
5115 NE 122nd Blvd, Oxford, FL 34484
$-139
Cash flow
-2.8%
Cash-on-Cash Return
5.5%
Cap rate
0.8%
Rent to Value Ratio
19 out of 21 properties for sale in Oxford, FL
Limited Results Shown
Create a free account, or log in to reveal all property listings and enjoy the complete experience.
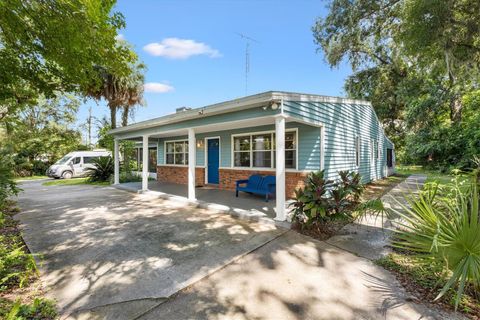
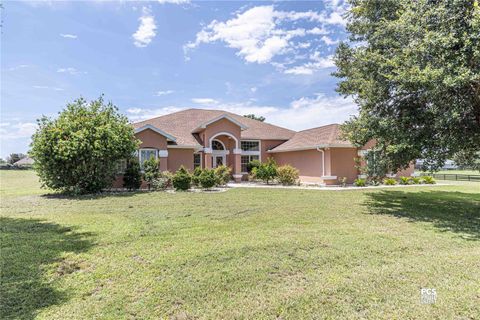
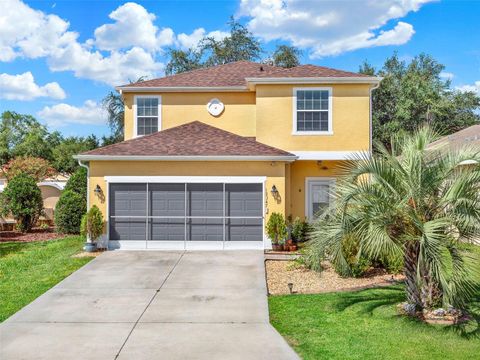
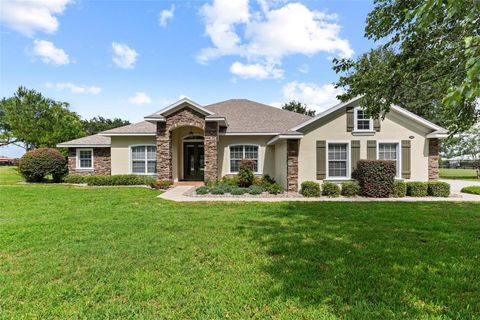
Active
$449,900
3
bds
|
2
ba
|
1,780
sqft
|
built
1982
602 NW 111th Ln, Oxford, FL 34484
$-893
Cash flow
-10.4%
Cash-on-Cash Return
3.8%
Cap rate
0.5%
Rent to Value Ratio
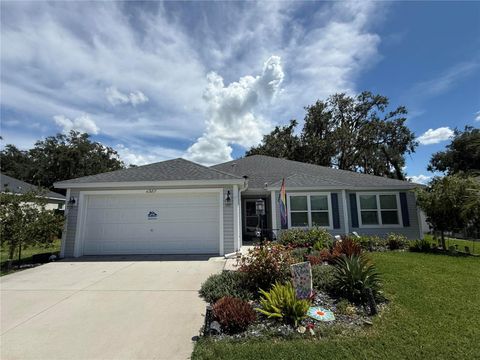
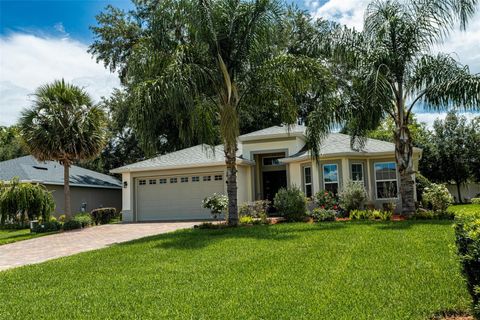
Active
$439,000
4
bds
|
2
ba
|
1,978
sqft
|
built
2020
11387 Zimmerman Path, Oxford, FL 34484
$-911
Cash flow
-10.8%
Cash-on-Cash Return
3.7%
Cap rate
0.6%
Rent to Value Ratio
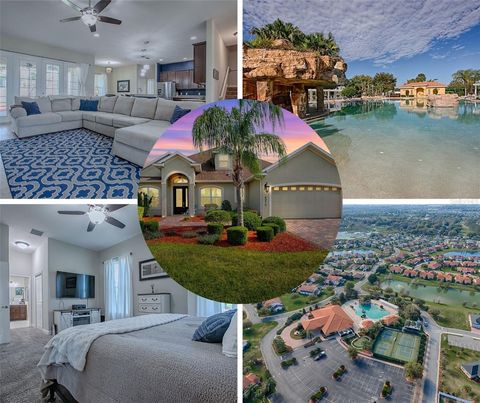
Active
$860,000
4
bds
|
3
ba
|
2,991
sqft
|
built
2011
2679 NE 108th Ln, Oxford, FL 34484
$-2,735
Cash flow
-16.6%
Cash-on-Cash Return
2.3%
Cap rate
0.4%
Rent to Value Ratio
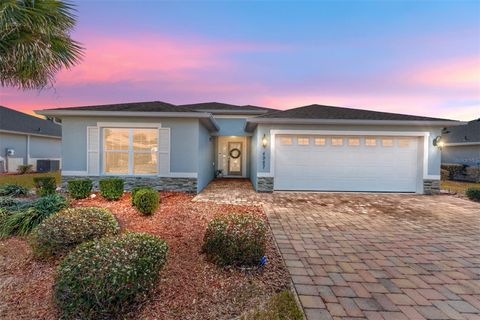
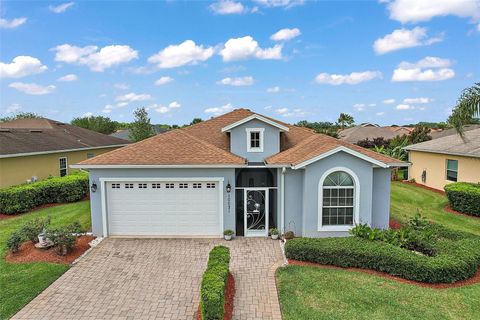
Active
$324,237
3
bds
|
2
ba
|
1,575
sqft
|
built
2017
3305 Dzuro Dr, Oxford, FL 34484
$-474
Cash flow
-7.6%
Cash-on-Cash Return
4.4%
Cap rate
0.7%
Rent to Value Ratio
Active
$200,000
2
bds
|
2
ba
|
1,291
sqft
|
built
2006
5427 Admiral Way, Oxford, FL 34484
$-250
Cash flow
-6.5%
Cash-on-Cash Return
4.6%
Cap rate
0.9%
Rent to Value Ratio
Active
$462,900
4
bds
|
4
ba
|
2,932
sqft
|
built
2015
10021 Ketch Kay Ln, Oxford, FL 34484
$-799
Cash flow
-9.0%
Cash-on-Cash Return
4.1%
Cap rate
0.7%
Rent to Value Ratio
Active
$394,900
4
bds
|
4
ba
|
2,092
sqft
|
built
2012
12347 NE 52nd Loop, Oxford, FL 34484
$-578
Cash flow
-7.6%
Cash-on-Cash Return
4.4%
Cap rate
0.6%
Rent to Value Ratio
Active
$355,000
3
bds
|
2
ba
|
1,616
sqft
|
built
2020
10274 Julia Isles Ave, Oxford, FL 34484
$-784
Cash flow
-11.5%
Cash-on-Cash Return
3.5%
Cap rate
0.6%
Rent to Value Ratio
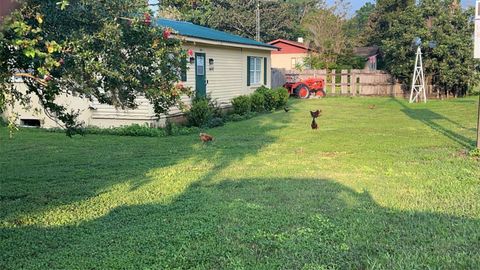
Active
$422,000
3
bds
|
1
ba
|
904
sqft
|
built
1960
3691 E County Road 466, Oxford, FL 34484
$-1,283
Cash flow
-15.9%
Cash-on-Cash Return
2.5%
Cap rate
0.3%
Rent to Value Ratio
Active
$349,900
3
bds
|
2
ba
|
1,916
sqft
|
built
2017
4987 Belted Kingfisher Dr, Oxford, FL 34484
$-397
Cash flow
-5.9%
Cash-on-Cash Return
4.8%
Cap rate
0.7%
Rent to Value Ratio
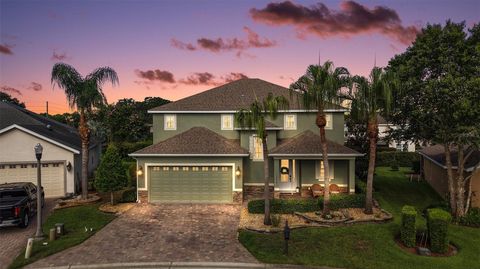
Active
$949,900
5
bds
|
3
ba
|
2,920
sqft
|
built
2004
12913 County Road 104 B, Oxford, FL 34484
$-2,754
Cash flow
-15.1%
Cash-on-Cash Return
2.7%
Cap rate
0.4%
Rent to Value Ratio
Active
$499,700
4
bds
|
2
ba
|
2,696
sqft
|
built
2017
4976 Sandpiper Dr, Oxford, FL 34484
$-1,416
Cash flow
-14.8%
Cash-on-Cash Return
2.7%
Cap rate
0.5%
Rent to Value Ratio
Active
$150,000
1
bds
|
1
ba
|
588
sqft
|
built
2022
12129 Grand Oak Ln, Oxford, FL 34484
$-670
Cash flow
-23.3%
Cash-on-Cash Return
0.8%
Cap rate
1.1%
Rent to Value Ratio
Active
$315,000
3
bds
|
2
ba
|
1,876
sqft
|
built
2013
10021 Lake Miona Way, Oxford, FL 34484
$-350
Cash flow
-5.8%
Cash-on-Cash Return
4.8%
Cap rate
0.8%
Rent to Value Ratio
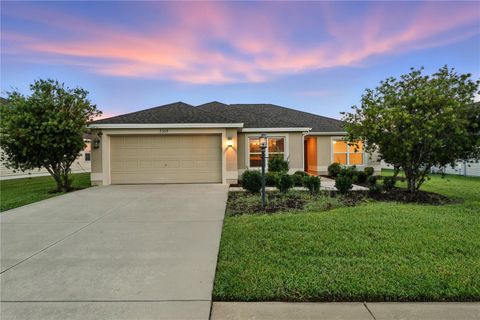
Active
$414,900
4
bds
|
2
ba
|
1,796
sqft
|
built
2021
5008 NE 125th Loop, Oxford, FL 34484
$-449
Cash flow
-5.6%
Cash-on-Cash Return
4.8%
Cap rate
0.7%
Rent to Value Ratio
Active
$289,900
4
bds
|
4
ba
|
1,912
sqft
|
built
2012
12312 NE 48th Loop, Oxford, FL 34484
$-224
Cash flow
-4.0%
Cash-on-Cash Return
5.2%
Cap rate
0.8%
Rent to Value Ratio
Active
$374,900
4
bds
|
2
ba
|
1,974
sqft
|
built
2019
11394 Zimmerman Path, Oxford, FL 34484
$-533
Cash flow
-7.4%
Cash-on-Cash Return
4.4%
Cap rate
0.7%
Rent to Value Ratio