Oxnard, CA Investment Properties for Sale
Browse homes for sale and investment properties in Oxnard, CA. Refine your search by price, property type, or more.
Best cash flowing properties in Oxnard, CA
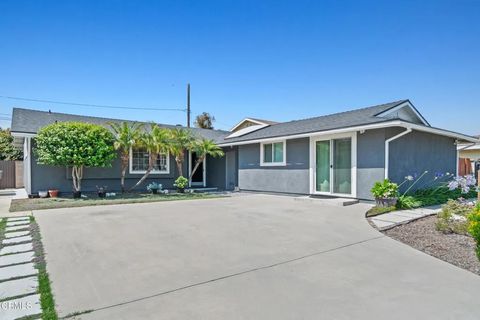
Active
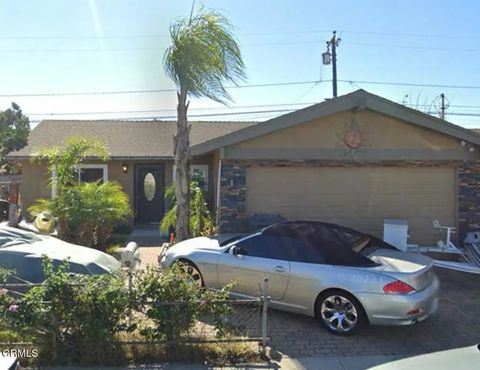
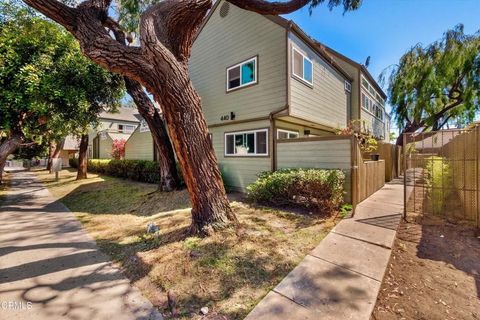
$749,999
4
bds
|
1
ba
|
1,080
sqft
|
built
1964
1440 Morris St, Oxnard, CA 93030
$-1,101
Cash flow
-7.7%
Cash-on-Cash Return
4.3%
Cap rate
0.5%
Rent to Value Ratio
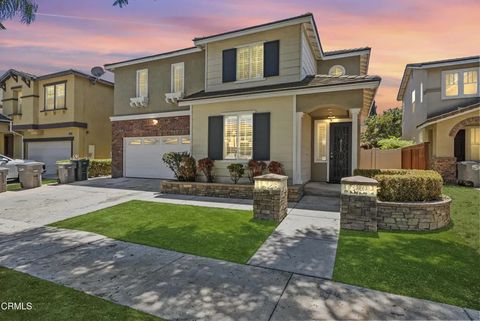
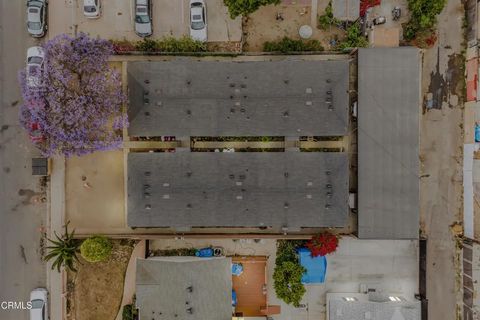
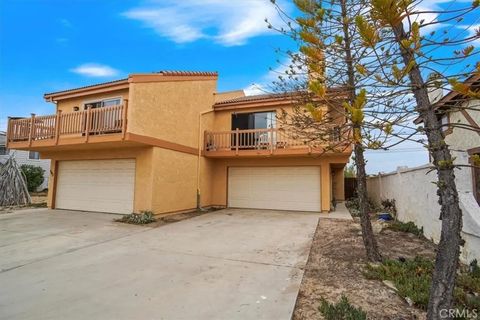
Active
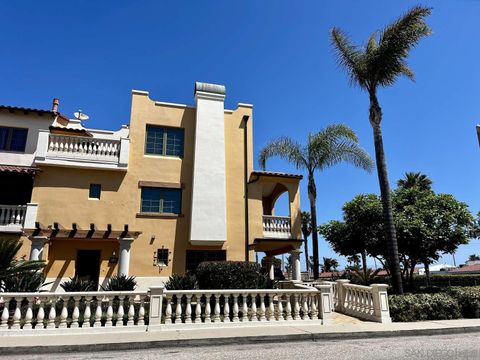
$995,000
5
bds
|
3
ba
|
3,032
sqft
|
built
2003
1424 Vida Dr, Oxnard, CA 93030
$-1,236
Cash flow
-6.5%
Cash-on-Cash Return
4.6%
Cap rate
0.6%
Rent to Value Ratio
19 out of 124 properties for sale in Oxnard, CA
Limited Results Shown
Create a free account, or log in to reveal all property listings and enjoy the complete experience.
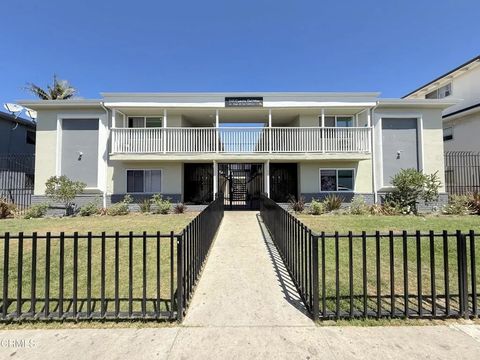
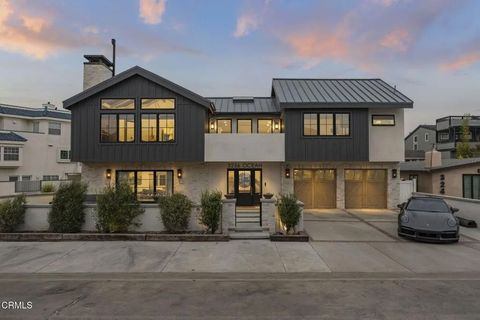
Active
$2,995,000
3
bds
|
2
ba
|
0
sqft
|
built
1962
541 Cuesta Del Mar Dr, Oxnard, CA 93033
$-12,384
Cash flow
-21.6%
Cash-on-Cash Return
1.1%
Cap rate
0.1%
Rent to Value Ratio
Active
$1,999,999
4
bds
|
5
ba
|
2,662
sqft
|
built
1980
4844 Oceanaire St, Oxnard, CA 93035
$-5,697
Cash flow
-14.9%
Cash-on-Cash Return
2.6%
Cap rate
0.3%
Rent to Value Ratio
Active
$4,295,000
2
bds
|
2
ba
|
0
sqft
|
built
1981
3256 Ocean Dr, Oxnard, CA 93035
$-19,027
Cash flow
-23.1%
Cash-on-Cash Return
0.8%
Cap rate
0.1%
Rent to Value Ratio
Active
$2,989,500
3
bds
|
3
ba
|
0
sqft
|
built
1941
3025 Ocean Dr, Oxnard, CA 93035
$-11,644
Cash flow
-20.3%
Cash-on-Cash Return
1.4%
Cap rate
0.2%
Rent to Value Ratio
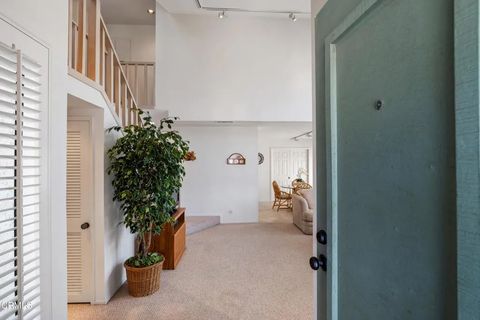
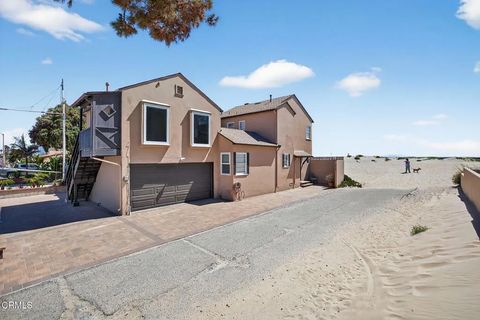
Active
$975,000
3
bds
|
3
ba
|
1,485
sqft
|
built
1976
3310 Sunset Ln, Oxnard, CA 93035
$-2,584
Cash flow
-13.8%
Cash-on-Cash Return
2.9%
Cap rate
0.5%
Rent to Value Ratio
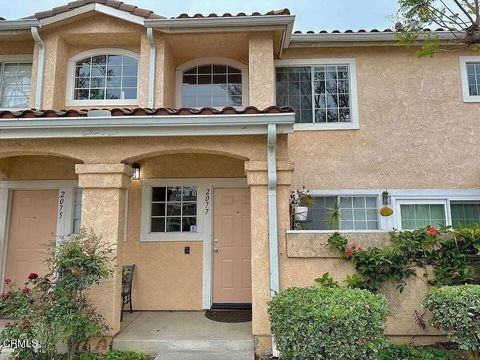
Active
$589,000
2
bds
|
2
ba
|
1,362
sqft
|
built
1990
2077 Blackberry Cir, Oxnard, CA 93036
$-1,579
Cash flow
-14.0%
Cash-on-Cash Return
2.9%
Cap rate
0.5%
Rent to Value Ratio
Active
$1,999,000
4
bds
|
4
ba
|
0
sqft
|
built
1940
136 N Garfield Ave, Oxnard, CA 93030
$-8,176
Cash flow
-21.3%
Cash-on-Cash Return
1.2%
Cap rate
0.1%
Rent to Value Ratio
Active
$1,300,000
6
bds
|
4
ba
|
0
sqft
|
built
1983
941 Dunes St, Oxnard, CA 93035
$-4,159
Cash flow
-16.7%
Cash-on-Cash Return
2.2%
Cap rate
0.3%
Rent to Value Ratio
Active
$1,599,900
5
bds
|
4
ba
|
0
sqft
|
built
1973
4941 Catamaran St, Oxnard, CA 93035
$-5,675
Cash flow
-18.5%
Cash-on-Cash Return
1.8%
Cap rate
0.2%
Rent to Value Ratio
Active
$974,999
4
bds
|
3
ba
|
0
sqft
|
built
1961
1350 Elder St, Oxnard, CA 93036
$-2,446
Cash flow
-13.1%
Cash-on-Cash Return
3.1%
Cap rate
0.4%
Rent to Value Ratio
Active
$3,200,000
3
bds
|
3
ba
|
0
sqft
|
built
1988
430 Linden Dr, Oxnard, CA 93033
$-13,697
Cash flow
-22.3%
Cash-on-Cash Return
0.9%
Cap rate
0.1%
Rent to Value Ratio
Active
$1,430,000
3
bds
|
5
ba
|
2,335
sqft
|
built
2010
5103 W Wooley Rd, Oxnard, CA 93035
$-2,538
Cash flow
-9.3%
Cash-on-Cash Return
3.9%
Cap rate
0.5%
Rent to Value Ratio
Active
$899,000
3
bds
|
2
ba
|
1,384
sqft
|
built
1978
328 Highland Dr, Oxnard, CA 93035
$-2,338
Cash flow
-13.6%
Cash-on-Cash Return
2.9%
Cap rate
0.4%
Rent to Value Ratio
Active
$1,495,000
5
bds
|
4
ba
|
0
sqft
|
built
1946
2461 Balboa St, Oxnard, CA 93036
$-5,628
Cash flow
-19.6%
Cash-on-Cash Return
1.6%
Cap rate
0.2%
Rent to Value Ratio
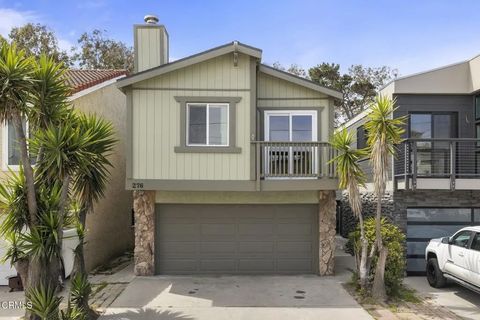
Active
$994,000
3
bds
|
2
ba
|
1,384
sqft
|
built
1978
276 Highland Dr, Oxnard, CA 93035
$-2,542
Cash flow
-13.3%
Cash-on-Cash Return
3.0%
Cap rate
0.4%
Rent to Value Ratio
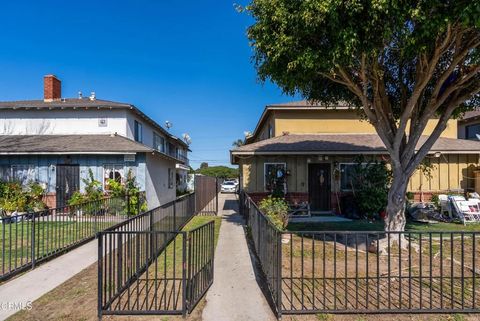
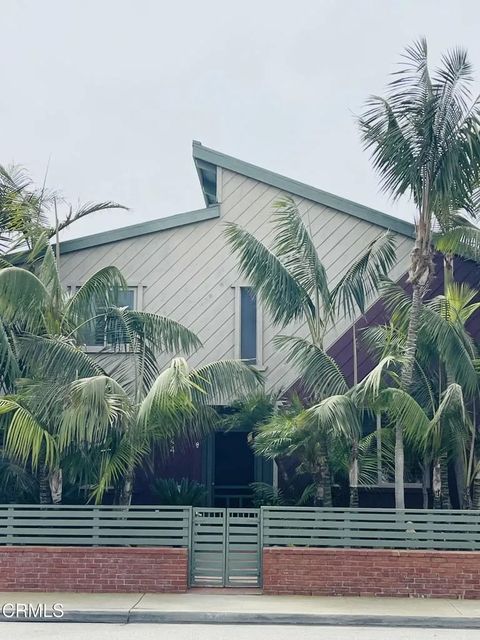
Active
$1,575,000
9
bds
|
7
ba
|
0
sqft
|
built
1964
341 Cuesta Del Mar Dr, Oxnard, CA 93033
$-5,963
Cash flow
-19.8%
Cash-on-Cash Return
1.5%
Cap rate
0.2%
Rent to Value Ratio
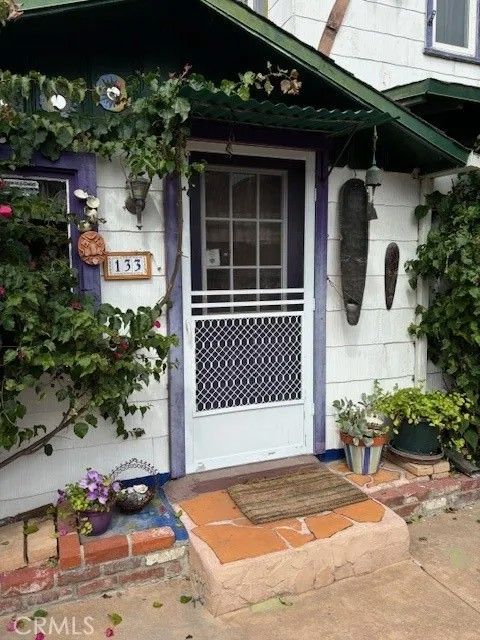
Active
$975,000
2
bds
|
1
ba
|
834
sqft
|
built
1949
133 Santa Paula Ave, Oxnard, CA 93035
$-2,515
Cash flow
-13.5%
Cash-on-Cash Return
3.0%
Cap rate
0.4%
Rent to Value Ratio