Palm City, FL Investment Properties for Sale
Browse homes for sale and investment properties in Palm City, FL. Refine your search by price, property type, or more.
Best cash flowing properties in Palm City, FL
Active
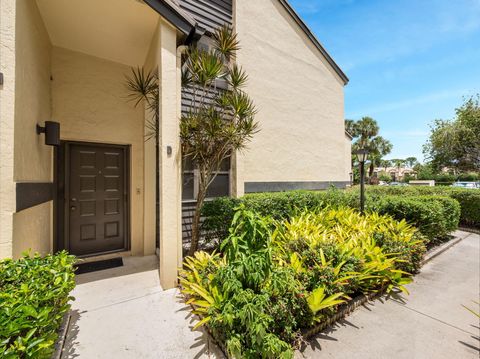
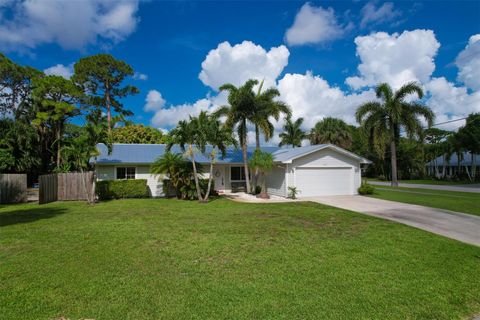
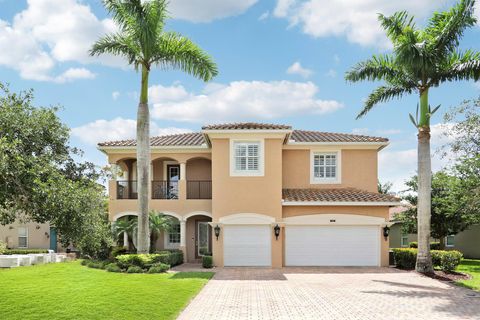
$200,000
2
bds
|
2
ba
|
1,337
sqft
|
built
1986
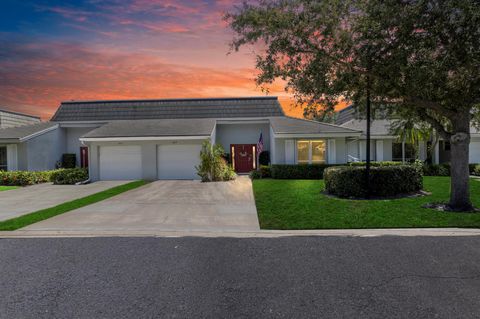
3961 SW Greenwood Way, Palm City, FL 34990
$-248
Cash flow
-6.5%
Cash-on-Cash Return
4.7%
Cap rate
1.1%
Rent to Value Ratio
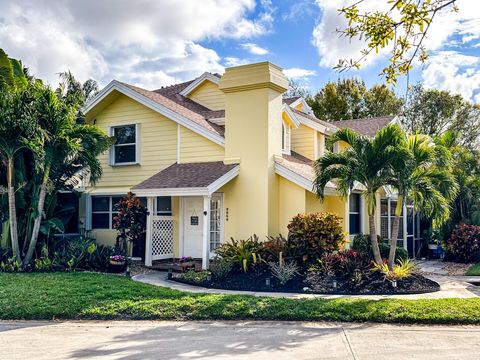
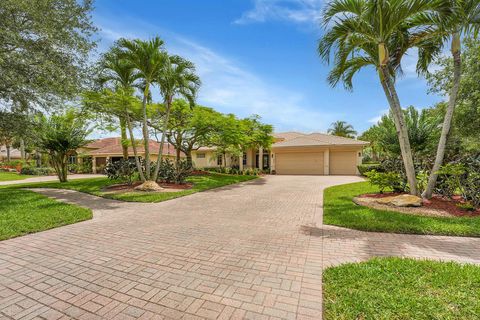
Active
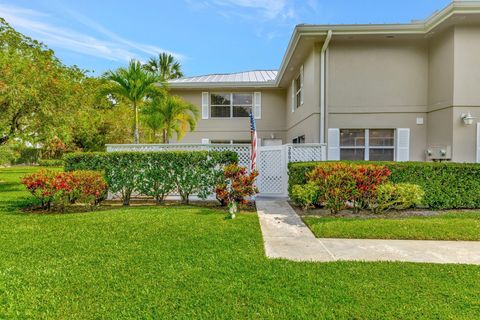
$255,000
2
bds
|
3
ba
|
1,374
sqft
|
built
1989
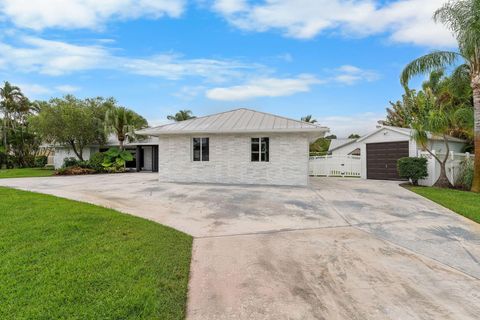
2895 SW Lakemont Pl, Palm City, FL 34990
$-342
Cash flow
-7.0%
Cash-on-Cash Return
4.5%
Cap rate
0.9%
Rent to Value Ratio
184 out of 195 properties for sale in Palm City, FL
Limited Results Shown
Create a free account, or log in to reveal all property listings and enjoy the complete experience.
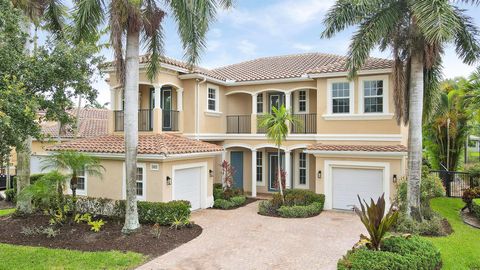
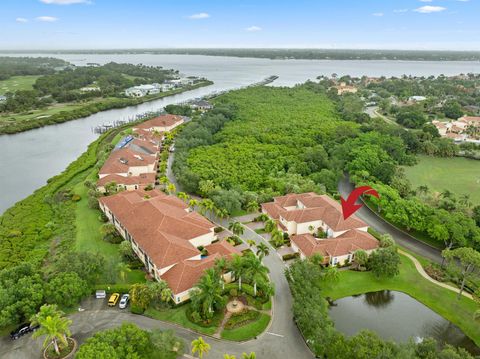
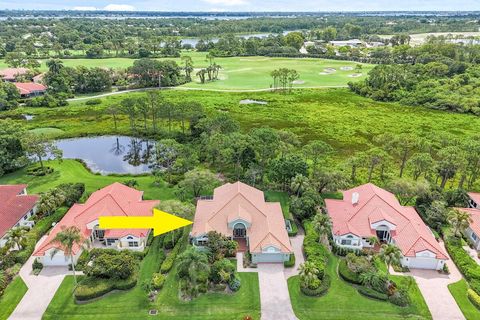
Active
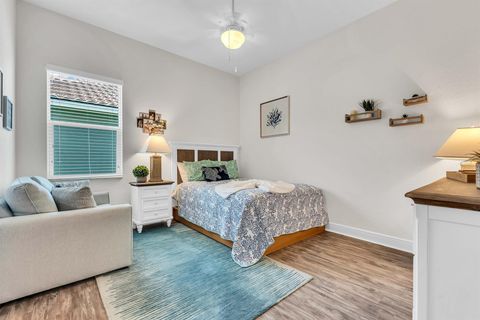
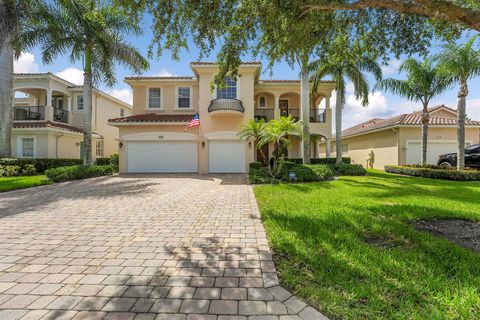
$1,199,000
5
bds
|
5
ba
|
4,343
sqft
|
built
2015
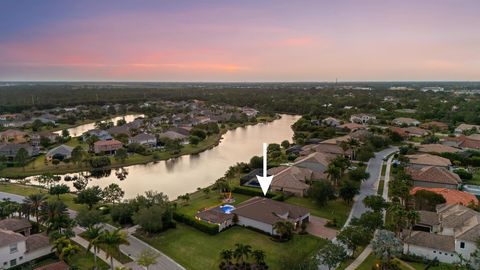
6458 SW Key Deer Ln, Palm City, FL 34990
$-3,406
Cash flow
-14.8%
Cash-on-Cash Return
2.7%
Cap rate
0.5%
Rent to Value Ratio

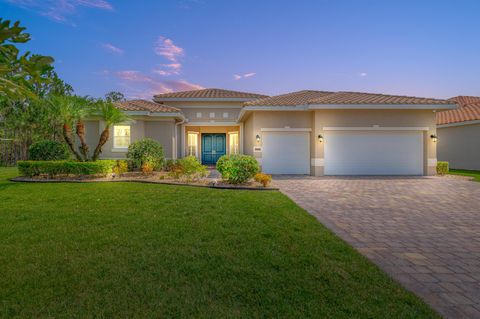
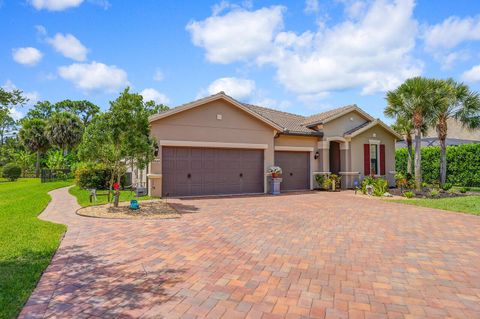
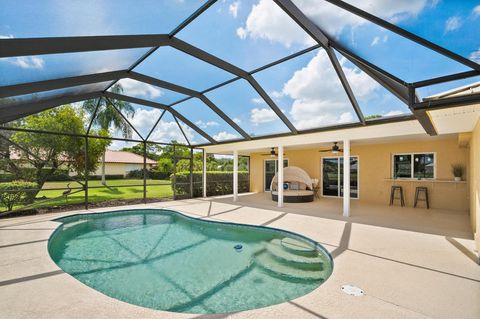
Active
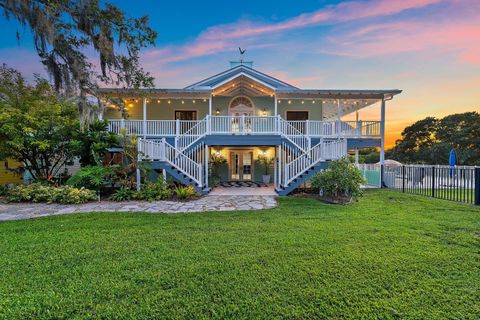
$610,000
3
bds
|
2
ba
|
1,803
sqft
|
built
1995
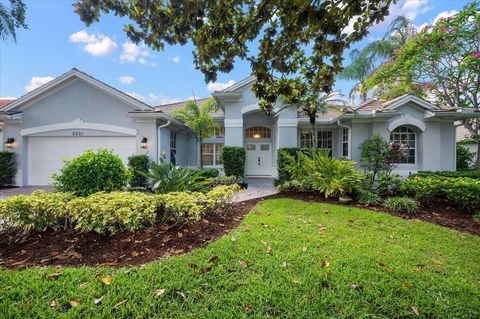
1200 SW Arrowhead Ct, Palm City, FL 34990
$-1,475
Cash flow
-12.6%
Cash-on-Cash Return
3.4%
Cap rate
0.6%
Rent to Value Ratio

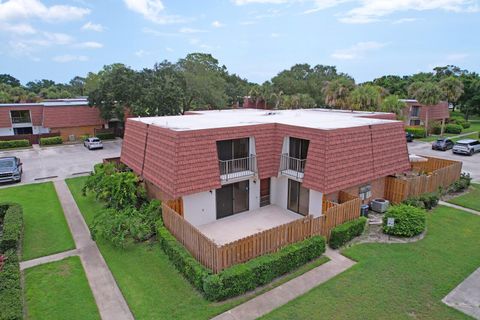
Active
$277,000
2
bds
|
3
ba
|
1,236
sqft
|
built
1984
3601 SW Sunset Trace Cir, Palm City, FL 34990
$-714
Cash flow
-13.4%
Cash-on-Cash Return
3.1%
Cap rate
0.8%
Rent to Value Ratio
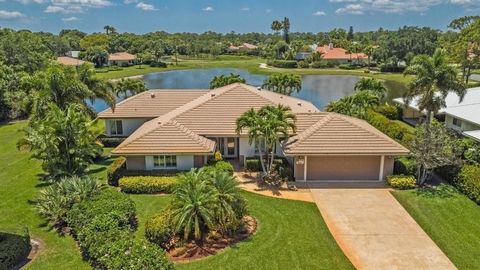
Active
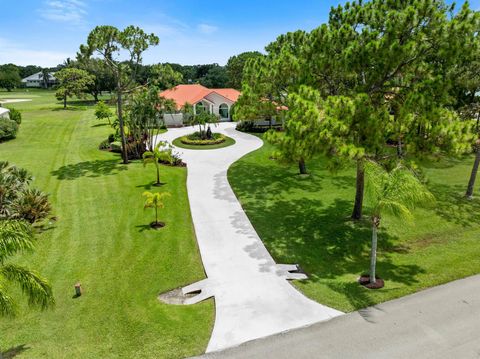
$1,390,000
5
bds
|
5
ba
|
4,483
sqft
|
built
1982
3327 SW Bessey Creek Trl, Palm City, FL 34990
$-2,189
Cash flow
-8.2%
Cash-on-Cash Return
4.3%
Cap rate
0.5%
Rent to Value Ratio

Active
$975,000
4
bds
|
3
ba
|
3,154
sqft
|
built
2004
3780 SW Canoe Creek Ter, Palm City, FL 34990
$-2,570
Cash flow
-13.8%
Cash-on-Cash Return
3.0%
Cap rate
0.5%
Rent to Value Ratio
Active
$695,000
3
bds
|
2
ba
|
2,221
sqft
|
built
1993
1137 SW Lighthouse Dr, Palm City, FL 34990
$-1,591
Cash flow
-11.9%
Cash-on-Cash Return
3.4%
Cap rate
0.6%
Rent to Value Ratio
Active
$1,200,000
5
bds
|
3
ba
|
3,553
sqft
|
built
2007
908 SW Squire Johns Ln, Palm City, FL 34990
$-3,109
Cash flow
-13.5%
Cash-on-Cash Return
3.0%
Cap rate
0.5%
Rent to Value Ratio
Active
$695,000
2
bds
|
2
ba
|
2,369
sqft
|
built
2003
879 SW Pebble Ln, Palm City, FL 34990
$-2,071
Cash flow
-15.5%
Cash-on-Cash Return
2.6%
Cap rate
0.5%
Rent to Value Ratio

Active
$1,295,000
4
bds
|
5
ba
|
3,960
sqft
|
built
1981
1819 SW Crane Creek Ave, Palm City, FL 34990
$-4,372
Cash flow
-17.6%
Cash-on-Cash Return
2.1%
Cap rate
0.4%
Rent to Value Ratio
Active
$1,090,000
3
bds
|
4
ba
|
3,513
sqft
|
built
1988
6460 SW Thistle Ter, Palm City, FL 34990
$-5,766
Cash flow
-27.6%
Cash-on-Cash Return
-0.2%
Cap rate
0.4%
Rent to Value Ratio
Active
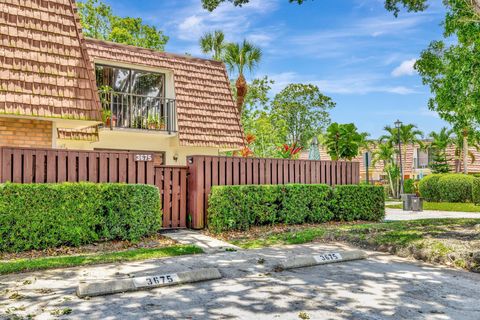
$255,900
2
bds
|
3
ba
|
1,236
sqft
|
built
1984
3675 SW Sunset Trace Cir, Palm City, FL 34990
$-702
Cash flow
-14.3%
Cash-on-Cash Return
2.9%
Cap rate
0.9%
Rent to Value Ratio

Active
$825,000
3
bds
|
3
ba
|
2,623
sqft
|
built
1987
1063 SW Pigeon Plum Way, Palm City, FL 34990
$-2,078
Cash flow
-13.1%
Cash-on-Cash Return
3.2%
Cap rate
0.5%
Rent to Value Ratio
Active
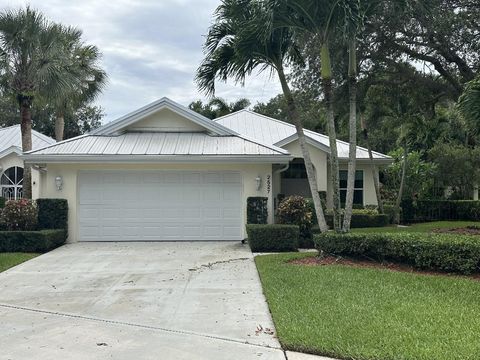
$476,000
3
bds
|
2
ba
|
1,952
sqft
|
built
1990
2527 SW Greenwich Way, Palm City, FL 34990
$-728
Cash flow
-8.0%
Cash-on-Cash Return
4.3%
Cap rate
0.7%
Rent to Value Ratio
Active
$1,200,000
5
bds
|
5
ba
|
4,309
sqft
|
built
2008
5718 SW Bald Eagle Dr, Palm City, FL 34990
$-3,896
Cash flow
-16.9%
Cash-on-Cash Return
2.4%
Cap rate
0.4%
Rent to Value Ratio

Active
$589,900
3
bds
|
2
ba
|
1,638
sqft
|
built
1990
3003 SW Seaboard Ave, Palm City, FL 34990
$-1,052
Cash flow
-9.3%
Cash-on-Cash Return
4.1%
Cap rate
0.6%
Rent to Value Ratio
Active
$945,000
3
bds
|
3
ba
|
2,283
sqft
|
built
1989
4902 SW Bimini Cir N, Palm City, FL 34990
$-2,460
Cash flow
-13.6%
Cash-on-Cash Return
3.1%
Cap rate
0.5%
Rent to Value Ratio
Active
$539,000
3
bds
|
2
ba
|
2,452
sqft
|
built
1988
2619 SW Greenwich Way, Palm City, FL 34990
$-617
Cash flow
-6.0%
Cash-on-Cash Return
4.8%
Cap rate
0.7%
Rent to Value Ratio
Active
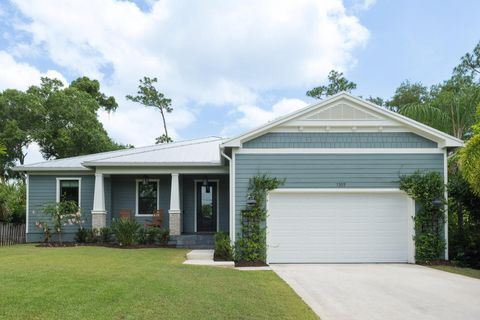
$799,000
4
bds
|
3
ba
|
2,426
sqft
|
built
2022
1305 SW 29th St, Palm City, FL 34990
$-2,291
Cash flow
-15.0%
Cash-on-Cash Return
2.8%
Cap rate
0.5%
Rent to Value Ratio
Active
$299,500
2
bds
|
3
ba
|
1,374
sqft
|
built
1989
2846 SW Lakemont Pl, Palm City, FL 34990
$-752
Cash flow
-13.1%
Cash-on-Cash Return
3.3%
Cap rate
0.8%
Rent to Value Ratio
Active
$1,699,000
6
bds
|
7
ba
|
5,094
sqft
|
built
2023
3153 SW Pond Apple St, Palm City, FL 34990
$-4,786
Cash flow
-14.7%
Cash-on-Cash Return
2.8%
Cap rate
0.5%
Rent to Value Ratio

Active
$425,000
3
bds
|
2
ba
|
1,426
sqft
|
built
1971
911 SW 30th St, Palm City, FL 34990
$-639
Cash flow
-7.8%
Cash-on-Cash Return
4.3%
Cap rate
0.7%
Rent to Value Ratio
Active
$525,000
3
bds
|
2
ba
|
1,534
sqft
|
built
1978
3734 SW Pompano Dr, Palm City, FL 34990
$-885
Cash flow
-8.8%
Cash-on-Cash Return
4.1%
Cap rate
0.6%
Rent to Value Ratio
Active
$304,000
3
bds
|
3
ba
|
1,296
sqft
|
built
1988
3656 SW Sunset Trace Cir, Palm City, FL 34990
$-763
Cash flow
-13.1%
Cash-on-Cash Return
3.1%
Cap rate
0.8%
Rent to Value Ratio

Active
$1,147,000
3
bds
|
3
ba
|
2,512
sqft
|
built
2016
845 SW Habitat Ln, Palm City, FL 34990
$-2,012
Cash flow
-9.2%
Cash-on-Cash Return
4.0%
Cap rate
0.6%
Rent to Value Ratio
Active
$899,000
4
bds
|
4
ba
|
3,346
sqft
|
built
2006
5605 SW Gray Fox Dr, Palm City, FL 34990
$-2,529
Cash flow
-14.7%
Cash-on-Cash Return
2.8%
Cap rate
0.5%
Rent to Value Ratio
Active
$979,000
4
bds
|
3
ba
|
3,436
sqft
|
built
2015
6519 SW Key Deer Ln, Palm City, FL 34990
$-2,525
Cash flow
-13.5%
Cash-on-Cash Return
3.1%
Cap rate
0.5%
Rent to Value Ratio
Active
$1,095,000
5
bds
|
5
ba
|
4,309
sqft
|
built
2008
5621 SW Longspur Ln, Palm City, FL 34990
$-3,620
Cash flow
-17.2%
Cash-on-Cash Return
2.2%
Cap rate
0.5%
Rent to Value Ratio
Active
$989,000
4
bds
|
3
ba
|
3,212
sqft
|
built
2002
4450 SW Long Bay Dr, Palm City, FL 34990
$-1,588
Cash flow
-8.4%
Cash-on-Cash Return
4.2%
Cap rate
0.7%
Rent to Value Ratio
Active
$615,000
3
bds
|
3
ba
|
2,037
sqft
|
built
2003
2381 SW Island Creek Trl, Palm City, FL 34990
$-1,811
Cash flow
-15.4%
Cash-on-Cash Return
2.6%
Cap rate
0.6%
Rent to Value Ratio
Active
$885,900
4
bds
|
3
ba
|
2,277
sqft
|
built
2015
4884 SW Gossamer Cir, Palm City, FL 34990
$-2,108
Cash flow
-12.4%
Cash-on-Cash Return
3.3%
Cap rate
0.5%
Rent to Value Ratio
Active
$315,000
2
bds
|
2
ba
|
1,177
sqft
|
built
1984
2619 SW Westlake Cir, Palm City, FL 34990
$-649
Cash flow
-10.7%
Cash-on-Cash Return
3.8%
Cap rate
0.8%
Rent to Value Ratio
Active
$1,385,000
4
bds
|
3
ba
|
2,602
sqft
|
built
1977
1772 SW Commodore Pl, Palm City, FL 34990
$-4,284
Cash flow
-16.1%
Cash-on-Cash Return
2.4%
Cap rate
0.4%
Rent to Value Ratio
Active
$1,388,000
4
bds
|
4
ba
|
3,096
sqft
|
built
2017
868 SW Habitat Ln, Palm City, FL 34990
$-4,348
Cash flow
-16.3%
Cash-on-Cash Return
2.4%
Cap rate
0.5%
Rent to Value Ratio
Active
$919,900
5
bds
|
3
ba
|
2,338
sqft
|
built
1995
2221 SW Whitemarsh Way, Palm City, FL 34990
$-1,920
Cash flow
-10.9%
Cash-on-Cash Return
3.6%
Cap rate
0.7%
Rent to Value Ratio
Active
$479,000
3
bds
|
3
ba
|
2,505
sqft
|
built
1991
13312 NW Maplewood Rd, Palm City, FL 34990
$-702
Cash flow
-7.6%
Cash-on-Cash Return
4.4%
Cap rate
1.9%
Rent to Value Ratio
Active
$225,000
2
bds
|
3
ba
|
1,236
sqft
|
built
1984
3591 SW Sunset Trace Cir, Palm City, FL 34990
$-648
Cash flow
-15.0%
Cash-on-Cash Return
2.7%
Cap rate
0.9%
Rent to Value Ratio
Active
$649,000
3
bds
|
2
ba
|
1,819
sqft
|
built
1982
4575 SW Bimini Cir S, Palm City, FL 34990
$-1,865
Cash flow
-15.0%
Cash-on-Cash Return
2.8%
Cap rate
0.5%
Rent to Value Ratio
Active
$799,000
3
bds
|
3
ba
|
3,360
sqft
|
built
1982
4538 SW Fenwick Ln, Palm City, FL 34990
$-4,979
Cash flow
-32.5%
Cash-on-Cash Return
-1.3%
Cap rate
0.4%
Rent to Value Ratio