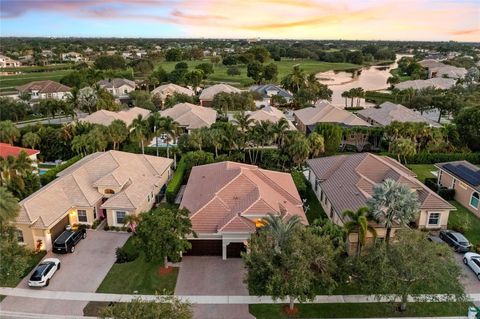
Parkland, FL Investment Properties for Sale
Browse homes for sale and investment properties in Parkland, FL. Refine your search by price, property type, or more.
Best cash flowing properties in Parkland, FL
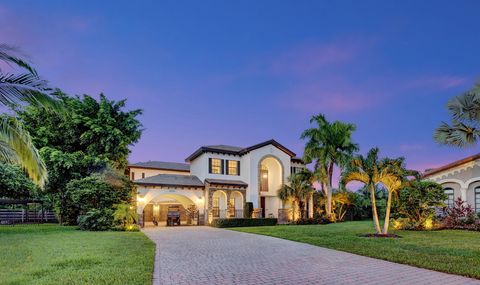
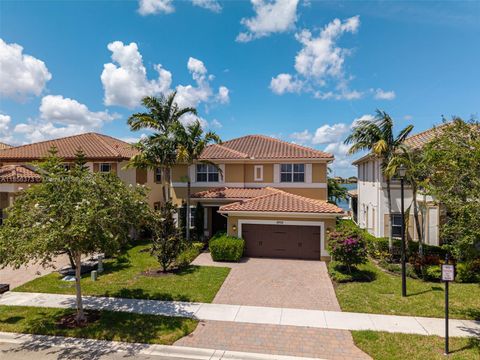
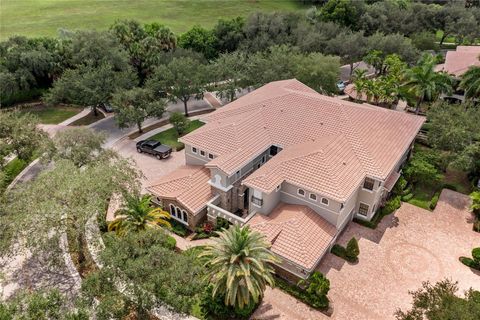
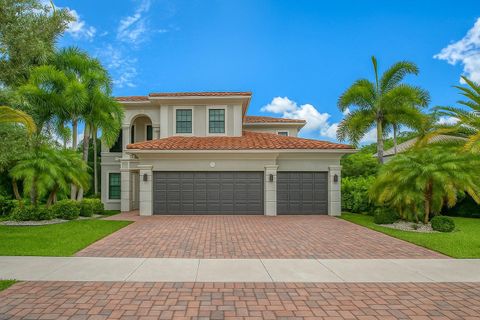
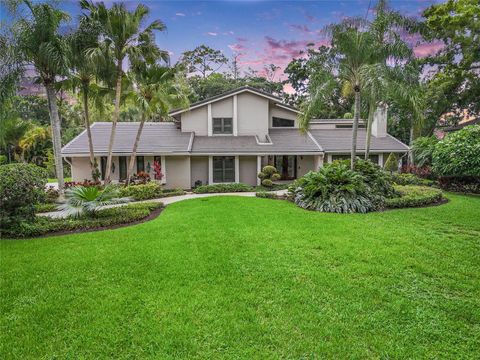
Active
$499,000
3
bds
|
2
ba
|
1,760
sqft
|
built
1991
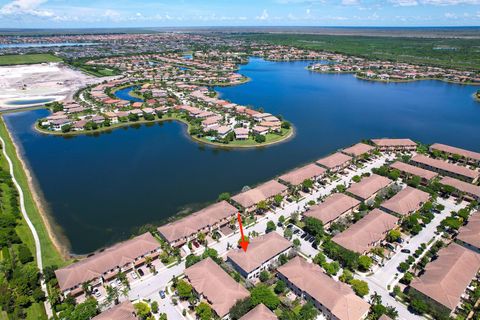
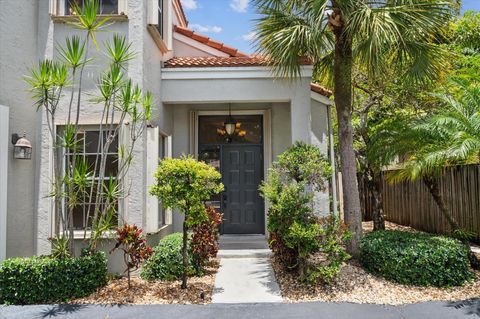
7525 NW 61st Ter, Parkland, FL 33067
$-1,041
Cash flow
-10.9%
Cash-on-Cash Return
3.6%
Cap rate
0.6%
Rent to Value Ratio

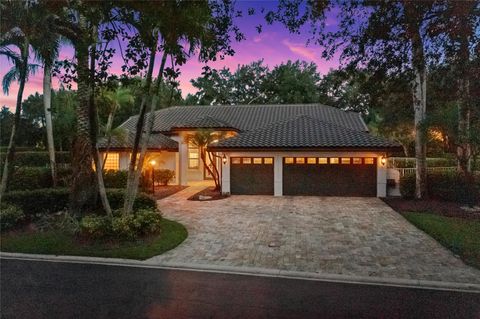
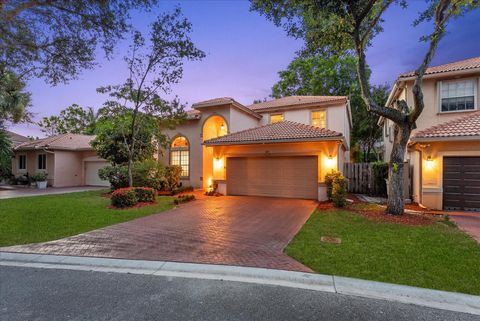
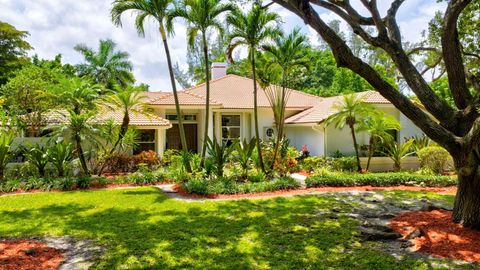
Active
$999,999
5
bds
|
3
ba
|
2,603
sqft
|
built
2000
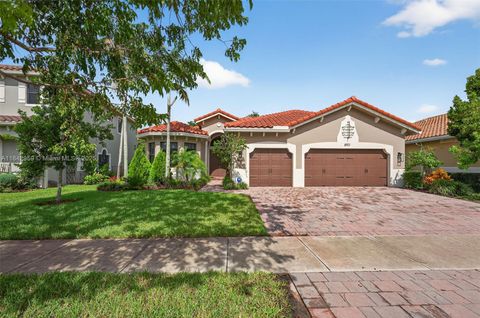
10668 NW 69th St, Parkland, FL 33076
$-1,327
Cash flow
-6.9%
Cash-on-Cash Return
4.6%
Cap rate
0.7%
Rent to Value Ratio
111 out of 121 properties for sale in Parkland, FL
Limited Results Shown
Create a free account, or log in to reveal all property listings and enjoy the complete experience.
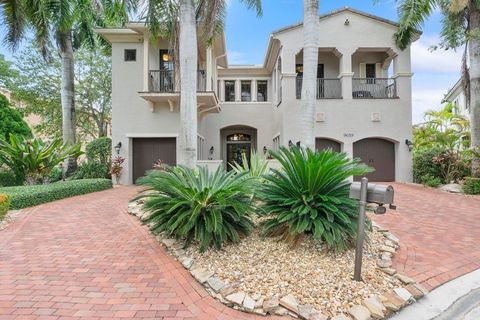
Active
$724,999
3
bds
|
2
ba
|
2,056
sqft
|
built
2002
12430 NW 78th Mnr, Parkland, FL 33076
$-1,463
Cash flow
-10.5%
Cash-on-Cash Return
3.7%
Cap rate
0.7%
Rent to Value Ratio
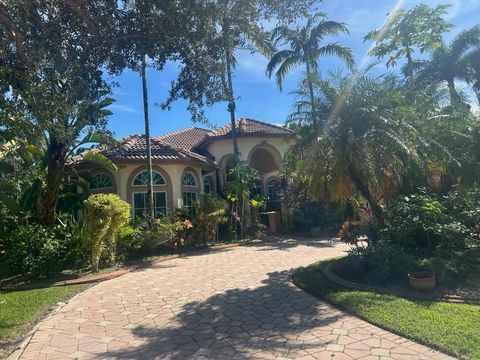
Active
$799,999
3
bds
|
3
ba
|
2,234
sqft
|
built
2002
7284 NW 116th Way, Parkland, FL 33076
$-1,433
Cash flow
-9.3%
Cash-on-Cash Return
4.0%
Cap rate
0.7%
Rent to Value Ratio
Active
$950,000
4
bds
|
4
ba
|
2,716
sqft
|
built
2015
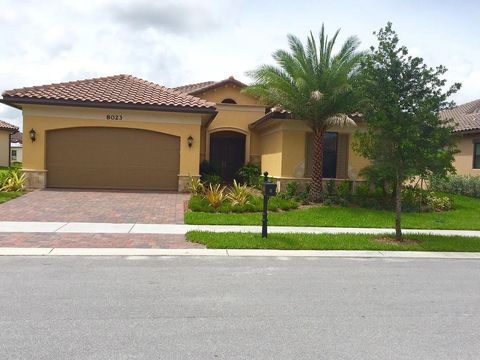
8023 NW 112th Ter, Parkland, FL 33076
$-1,667
Cash flow
-9.2%
Cash-on-Cash Return
4.0%
Cap rate
0.8%
Rent to Value Ratio
Active
$1,950,000
6
bds
|
5
ba
|
4,441
sqft
|
built
2006
10241 Majestic Trl, Parkland, FL 33076
$-7,320
Cash flow
-19.6%
Cash-on-Cash Return
1.6%
Cap rate
0.4%
Rent to Value Ratio
Active
$1,199,900
6
bds
|
4
ba
|
3,048
sqft
|
built
1994
6530 NW 95th Ln, Parkland, FL 33076
$-3,662
Cash flow
-15.9%
Cash-on-Cash Return
2.5%
Cap rate
0.5%
Rent to Value Ratio
Active
$1,849,900
5
bds
|
6
ba
|
4,150
sqft
|
built
2007
9659 Clemmons St, Parkland, FL 33076
$-6,719
Cash flow
-19.0%
Cash-on-Cash Return
1.8%
Cap rate
0.4%
Rent to Value Ratio
Active
$1,400,000
5
bds
|
3
ba
|
3,501
sqft
|
built
2001
9350 NW 62nd Ct, Parkland, FL 33067
$-3,098
Cash flow
-11.5%
Cash-on-Cash Return
3.5%
Cap rate
0.6%
Rent to Value Ratio
Active
$1,310,000
4
bds
|
4
ba
|
2,982
sqft
|
built
2016
9709 Blue Isle Bay, Parkland, FL 33076
$-3,743
Cash flow
-14.9%
Cash-on-Cash Return
2.7%
Cap rate
0.6%
Rent to Value Ratio

Active
$1,289,999
5
bds
|
3
ba
|
3,836
sqft
|
built
2006
12334 NW 80th Pl, Parkland, FL 33076
$-2,627
Cash flow
-10.6%
Cash-on-Cash Return
3.7%
Cap rate
0.6%
Rent to Value Ratio
Active
$1,850,000
5
bds
|
5
ba
|
4,591
sqft
|
built
1996
7411 N Cypresshead Dr, Parkland, FL 33067
$-7,303
Cash flow
-20.6%
Cash-on-Cash Return
1.4%
Cap rate
0.3%
Rent to Value Ratio
Active
$1,450,000
5
bds
|
4
ba
|
3,384
sqft
|
built
2021
10795 Oceano Way, Parkland, FL 33076
$-4,010
Cash flow
-14.4%
Cash-on-Cash Return
2.8%
Cap rate
0.6%
Rent to Value Ratio
Active
$1,198,888
5
bds
|
4
ba
|
3,281
sqft
|
built
2016
9725 Blue Isle Bay, Parkland, FL 33076
$-3,800
Cash flow
-16.5%
Cash-on-Cash Return
2.3%
Cap rate
0.5%
Rent to Value Ratio
Active
$749,000
4
bds
|
2
ba
|
2,288
sqft
|
built
2005
7656 Old Thyme Ct, Parkland, FL 33076
$-4,181
Cash flow
-29.1%
Cash-on-Cash Return
-0.6%
Cap rate
0.5%
Rent to Value Ratio
Active
$750,000
5
bds
|
3
ba
|
2,647
sqft
|
built
1998
6249 NW 78th Mnr, Parkland, FL 33067
$-1,443
Cash flow
-10.0%
Cash-on-Cash Return
3.8%
Cap rate
0.6%
Rent to Value Ratio
Active
$1,399,000
5
bds
|
4
ba
|
4,159
sqft
|
built
2021
10995 Passage Way, Parkland, FL 33076
$-4,535
Cash flow
-16.9%
Cash-on-Cash Return
2.3%
Cap rate
0.5%
Rent to Value Ratio
Active
$939,000
5
bds
|
3
ba
|
2,632
sqft
|
built
1991
5815 NW 96th Dr, Parkland, FL 33076
$-2,551
Cash flow
-14.2%
Cash-on-Cash Return
2.9%
Cap rate
0.5%
Rent to Value Ratio
Active
$2,099,000
5
bds
|
5
ba
|
4,005
sqft
|
built
2015
8139 Bradford Way, Parkland, FL 33076
$-6,871
Cash flow
-17.1%
Cash-on-Cash Return
2.2%
Cap rate
0.5%
Rent to Value Ratio
Active
$1,596,000
5
bds
|
6
ba
|
4,255
sqft
|
built
2022
12535 N Parkland Bay Trl, Parkland, FL 33076
$-4,725
Cash flow
-15.4%
Cash-on-Cash Return
2.6%
Cap rate
0.6%
Rent to Value Ratio
Active
$699,900
4
bds
|
2
ba
|
2,176
sqft
|
built
2000
11015 NW 64th Dr, Parkland, FL 33076
$-1,447
Cash flow
-10.8%
Cash-on-Cash Return
3.7%
Cap rate
0.6%
Rent to Value Ratio
Active
$6,800,000
8
bds
|
7
ba
|
8,318
sqft
|
built
1972
7600 NW 82nd Ter, Parkland, FL 33067
$-30,223
Cash flow
-23.2%
Cash-on-Cash Return
0.8%
Cap rate
0.2%
Rent to Value Ratio
Active
$899,500
4
bds
|
3
ba
|
2,498
sqft
|
built
2003
11936 NW 78th Pl, Parkland, FL 33076
$-1,806
Cash flow
-10.5%
Cash-on-Cash Return
3.7%
Cap rate
0.6%
Rent to Value Ratio
Active
$1,550,000
6
bds
|
6
ba
|
5,230
sqft
|
built
1975
5800 Pinetree Rd, Parkland, FL 33067
$-5,525
Cash flow
-18.6%
Cash-on-Cash Return
1.9%
Cap rate
0.3%
Rent to Value Ratio
Active
$1,275,000
5
bds
|
3
ba
|
3,251
sqft
|
built
1998
6783 NW 105th Ln, Parkland, FL 33076
$-3,372
Cash flow
-13.8%
Cash-on-Cash Return
3.0%
Cap rate
0.5%
Rent to Value Ratio
Active
$1,380,000
4
bds
|
5
ba
|
3,350
sqft
|
built
2003
7181 NW 71st Ter, Parkland, FL 33067
$-4,008
Cash flow
-15.2%
Cash-on-Cash Return
2.7%
Cap rate
0.4%
Rent to Value Ratio
Active
$650,000
4
bds
|
4
ba
|
2,056
sqft
|
built
2014
8416 Lakeview Trl, Parkland, FL 33076
$-1,730
Cash flow
-13.9%
Cash-on-Cash Return
3.0%
Cap rate
0.7%
Rent to Value Ratio

Active
$975,000
5
bds
|
3
ba
|
2,718
sqft
|
built
2001
11425 NW 75th Mnr, Parkland, FL 33076
$-2,626
Cash flow
-14.1%
Cash-on-Cash Return
2.9%
Cap rate
0.5%
Rent to Value Ratio
Active
$829,900
5
bds
|
3
ba
|
2,681
sqft
|
built
1990
6365 NW 77th Pl, Parkland, FL 33067
$-2,052
Cash flow
-12.9%
Cash-on-Cash Return
3.2%
Cap rate
0.6%
Rent to Value Ratio
Active
$1,450,000
5
bds
|
5
ba
|
3,672
sqft
|
built
1988
7401 W Cypresshead Dr, Parkland, FL 33067
$-3,382
Cash flow
-12.2%
Cash-on-Cash Return
3.3%
Cap rate
0.6%
Rent to Value Ratio

Active
$1,249,000
3
bds
|
2
ba
|
2,454
sqft
|
built
2013
7640 Red Bay Ln, Parkland, FL 33076
$-2,691
Cash flow
-11.2%
Cash-on-Cash Return
3.6%
Cap rate
0.7%
Rent to Value Ratio

Active
$1,150,000
5
bds
|
4
ba
|
3,061
sqft
|
built
1999
6748 NW 110th Way, Parkland, FL 33076
$-2,880
Cash flow
-13.1%
Cash-on-Cash Return
3.1%
Cap rate
0.6%
Rent to Value Ratio

Active
$1,400,000
5
bds
|
4
ba
|
3,572
sqft
|
built
2010
7283 NW 113th Ave, Parkland, FL 33076
$-3,815
Cash flow
-14.2%
Cash-on-Cash Return
2.9%
Cap rate
0.5%
Rent to Value Ratio
Active
$929,900
4
bds
|
3
ba
|
2,972
sqft
|
built
2014
8971 Edgewater Bnd, Parkland, FL 33076
$-2,032
Cash flow
-11.4%
Cash-on-Cash Return
3.5%
Cap rate
0.8%
Rent to Value Ratio
Active
$1,299,999
5
bds
|
4
ba
|
3,608
sqft
|
built
1986
5531 NW 80th Ter, Parkland, FL 33067
$-3,799
Cash flow
-15.2%
Cash-on-Cash Return
2.6%
Cap rate
0.4%
Rent to Value Ratio

Active
$1,850,000
5
bds
|
5
ba
|
4,141
sqft
|
built
2016
8766 Miralago Way, Parkland, FL 33076
$-7,405
Cash flow
-20.9%
Cash-on-Cash Return
1.3%
Cap rate
0.4%
Rent to Value Ratio

Active
$1,345,000
4
bds
|
4
ba
|
3,056
sqft
|
built
2018
10593 N Lago Vista Cir, Parkland, FL 33076
$-3,094
Cash flow
-12.0%
Cash-on-Cash Return
3.4%
Cap rate
0.7%
Rent to Value Ratio
Active
$1,628,000
5
bds
|
4
ba
|
3,377
sqft
|
built
1990
8111 Blue Ridge Ln, Parkland, FL 33067
$-5,056
Cash flow
-16.2%
Cash-on-Cash Return
2.4%
Cap rate
0.5%
Rent to Value Ratio

Active
$649,900
3
bds
|
3
ba
|
1,875
sqft
|
built
2014
8405 Lakeview Trl, Parkland, FL 33076
$-2,032
Cash flow
-16.3%
Cash-on-Cash Return
2.4%
Cap rate
0.6%
Rent to Value Ratio
Active
$750,000
3
bds
|
2
ba
|
1,468
sqft
|
built
1991
7560 NW 61st Ter, Parkland, FL 33067
$-2,322
Cash flow
-16.2%
Cash-on-Cash Return
2.4%
Cap rate
0.5%
Rent to Value Ratio