Parkland, FL Investment Properties for Sale
Browse homes for sale and investment properties in Parkland, FL. Refine your search by price, property type, or more.
Best cash flowing properties in Parkland, FL
Active
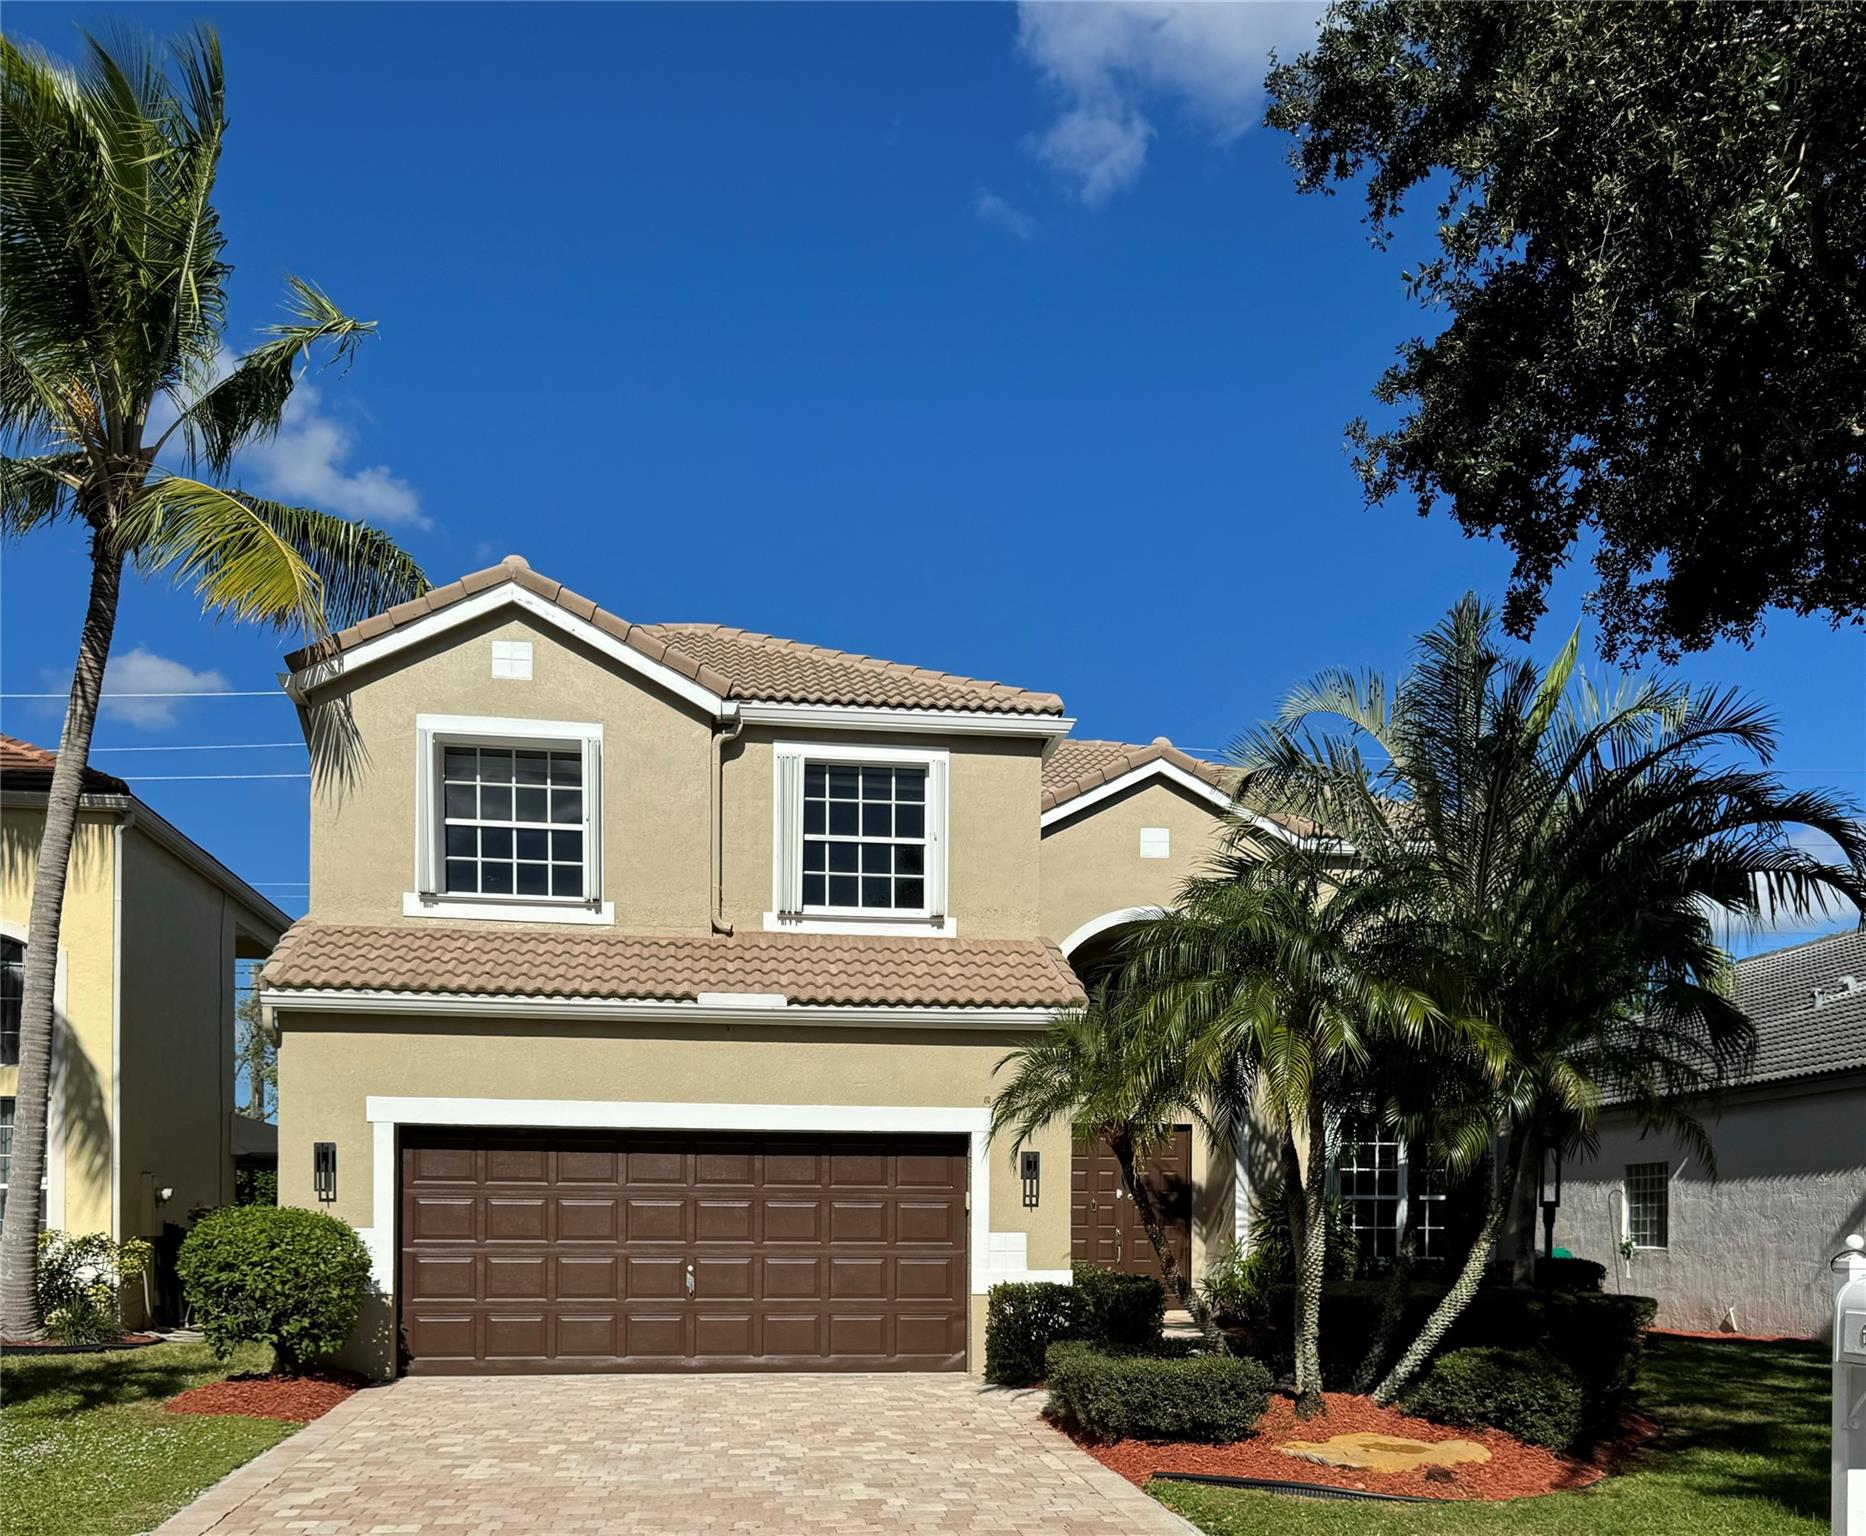
$810,000
4
bds
|
3
ba
|
2,319
sqft
|
built
1996
6733 NW 81st Ct, Parkland, FL 33067
$-437
Cash flow
-2.8%
Cash-on-Cash Return
5.5%
Cap rate
0.8%
Rent to Value Ratio
Active
$650,000
4
bds
|
3
ba
|
2,198
sqft
|
built
1992
7680 NW 62nd Way, Parkland, FL 33067
$-1,477
Cash flow
-11.9%
Cash-on-Cash Return
3.4%
Cap rate
0.7%
Rent to Value Ratio
147 out of 155 properties for sale in Parkland, FL
Limited Results Shown
Create a free account, or log in to reveal all property listings and enjoy the complete experience.
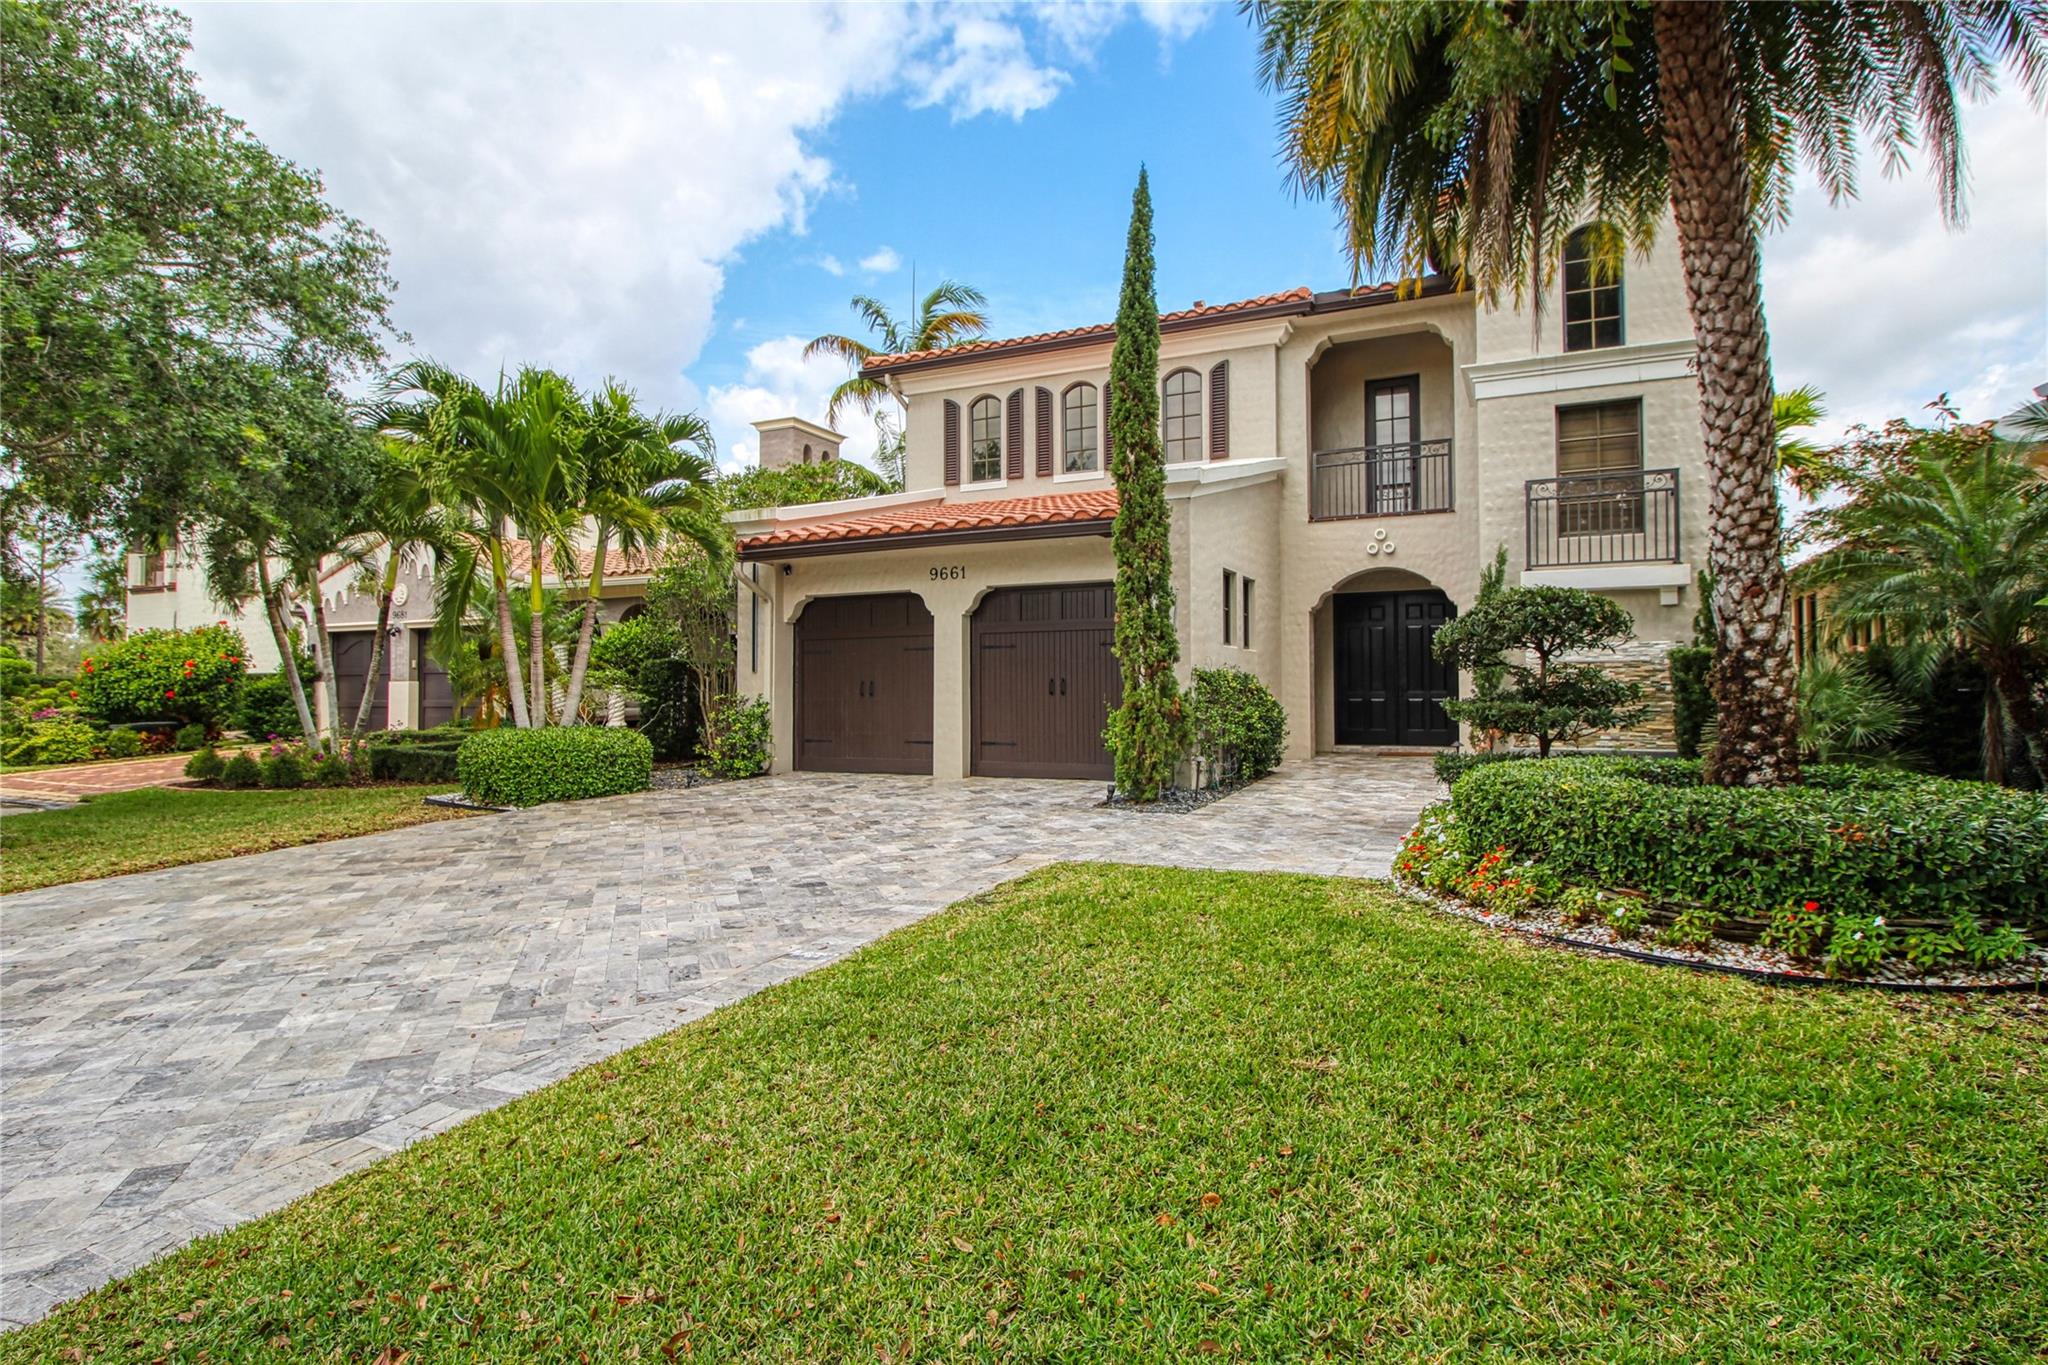
Active
$1,599,000
4
bds
|
3
ba
|
3,508
sqft
|
built
2007
9661 Ginger Ct, Parkland, FL 33076
$-4,752
Cash flow
-15.5%
Cash-on-Cash Return
2.6%
Cap rate
0.5%
Rent to Value Ratio
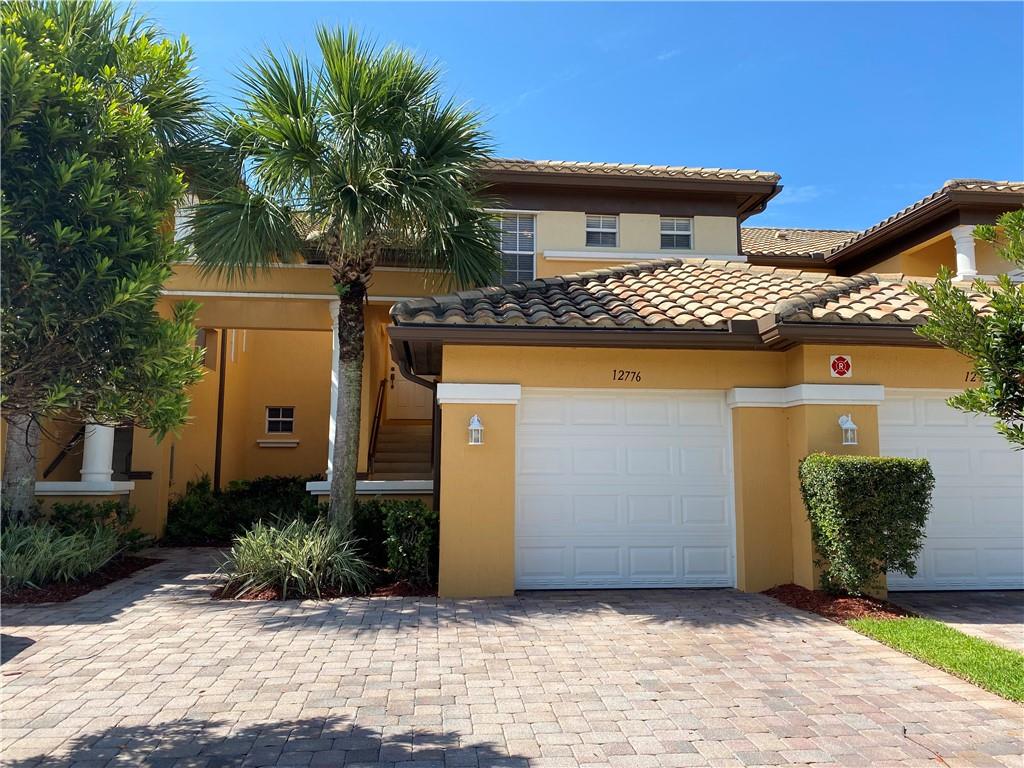
Active
$520,000
3
bds
|
2
ba
|
1,524
sqft
|
built
2007
12776 NW 83rd Ct, Parkland, FL 33076
$-1,492
Cash flow
-15.0%
Cash-on-Cash Return
2.7%
Cap rate
0.8%
Rent to Value Ratio
Active
$749,500
4
bds
|
2
ba
|
2,288
sqft
|
built
2004
7574 Old Thyme Ct, Parkland, FL 33076
$-1,478
Cash flow
-10.3%
Cash-on-Cash Return
3.8%
Cap rate
0.8%
Rent to Value Ratio
Active
$1,595,000
5
bds
|
5
ba
|
4,086
sqft
|
built
1992
6255 NW 97th Ave, Parkland, FL 33076
$-3,238
Cash flow
-10.6%
Cash-on-Cash Return
3.7%
Cap rate
0.6%
Rent to Value Ratio

Active
$1,449,000
4
bds
|
3
ba
|
3,161
sqft
|
built
2008
8162 Canopy Ter, Parkland, FL 33076
$-4,699
Cash flow
-16.9%
Cash-on-Cash Return
2.3%
Cap rate
0.5%
Rent to Value Ratio
Active
$5,995,000
7
bds
|
11
ba
|
7,874
sqft
|
built
2022
6352 NW 65th Way, Parkland, FL 33067
$-29,681
Cash flow
-25.8%
Cash-on-Cash Return
0.2%
Cap rate
0.2%
Rent to Value Ratio
Active
$2,000,000
7
bds
|
7
ba
|
6,188
sqft
|
built
1979
6770 NW 84th Ave, Parkland, FL 33067
$-8,754
Cash flow
-22.8%
Cash-on-Cash Return
0.9%
Cap rate
0.4%
Rent to Value Ratio
Active
$1,375,000
3
bds
|
4
ba
|
2,968
sqft
|
built
2006
7380 Wisteria Ave, Parkland, FL 33076
$-5,037
Cash flow
-19.1%
Cash-on-Cash Return
1.8%
Cap rate
0.4%
Rent to Value Ratio
Active
$1,590,000
6
bds
|
6
ba
|
4,383
sqft
|
built
2014
8045 NW 115th Way, Parkland, FL 33076
$-5,291
Cash flow
-17.4%
Cash-on-Cash Return
2.2%
Cap rate
0.5%
Rent to Value Ratio
Active
$2,549,999
6
bds
|
5
ba
|
5,263
sqft
|
built
2006
6915 Long Leaf Dr, Parkland, FL 33076
$-9,238
Cash flow
-18.9%
Cash-on-Cash Return
1.8%
Cap rate
0.4%
Rent to Value Ratio
Active
$650,000
4
bds
|
3
ba
|
2,198
sqft
|
built
1992
7680 NW 62nd Way, Parkland, FL 33067
$-1,477
Cash flow
-11.9%
Cash-on-Cash Return
3.4%
Cap rate
0.7%
Rent to Value Ratio
Active
$1,650,000
5
bds
|
6
ba
|
4,383
sqft
|
built
2019
10915 Moore Dr, Parkland, FL 33076
$-2,688
Cash flow
-8.5%
Cash-on-Cash Return
4.2%
Cap rate
0.6%
Rent to Value Ratio
Active
$2,249,999
5
bds
|
6
ba
|
5,060
sqft
|
built
1989
7115 Cutter Ct, Parkland, FL 33067
$-6,506
Cash flow
-15.1%
Cash-on-Cash Return
2.7%
Cap rate
0.4%
Rent to Value Ratio
Active
$2,500,000
6
bds
|
6
ba
|
5,956
sqft
|
built
2006
12008 NW 69th Ct, Parkland, FL 33076
$-8,820
Cash flow
-18.4%
Cash-on-Cash Return
1.9%
Cap rate
0.4%
Rent to Value Ratio
Active
$998,000
4
bds
|
3
ba
|
3,213
sqft
|
built
2004
8122 NW 109th Ln, Parkland, FL 33076
$-2,409
Cash flow
-12.6%
Cash-on-Cash Return
3.3%
Cap rate
0.6%
Rent to Value Ratio
Active
$2,899,999
6
bds
|
8
ba
|
8,354
sqft
|
built
1991
7700 S Woodridge Dr, Parkland, FL 33067
$-10,236
Cash flow
-18.4%
Cash-on-Cash Return
1.9%
Cap rate
0.3%
Rent to Value Ratio
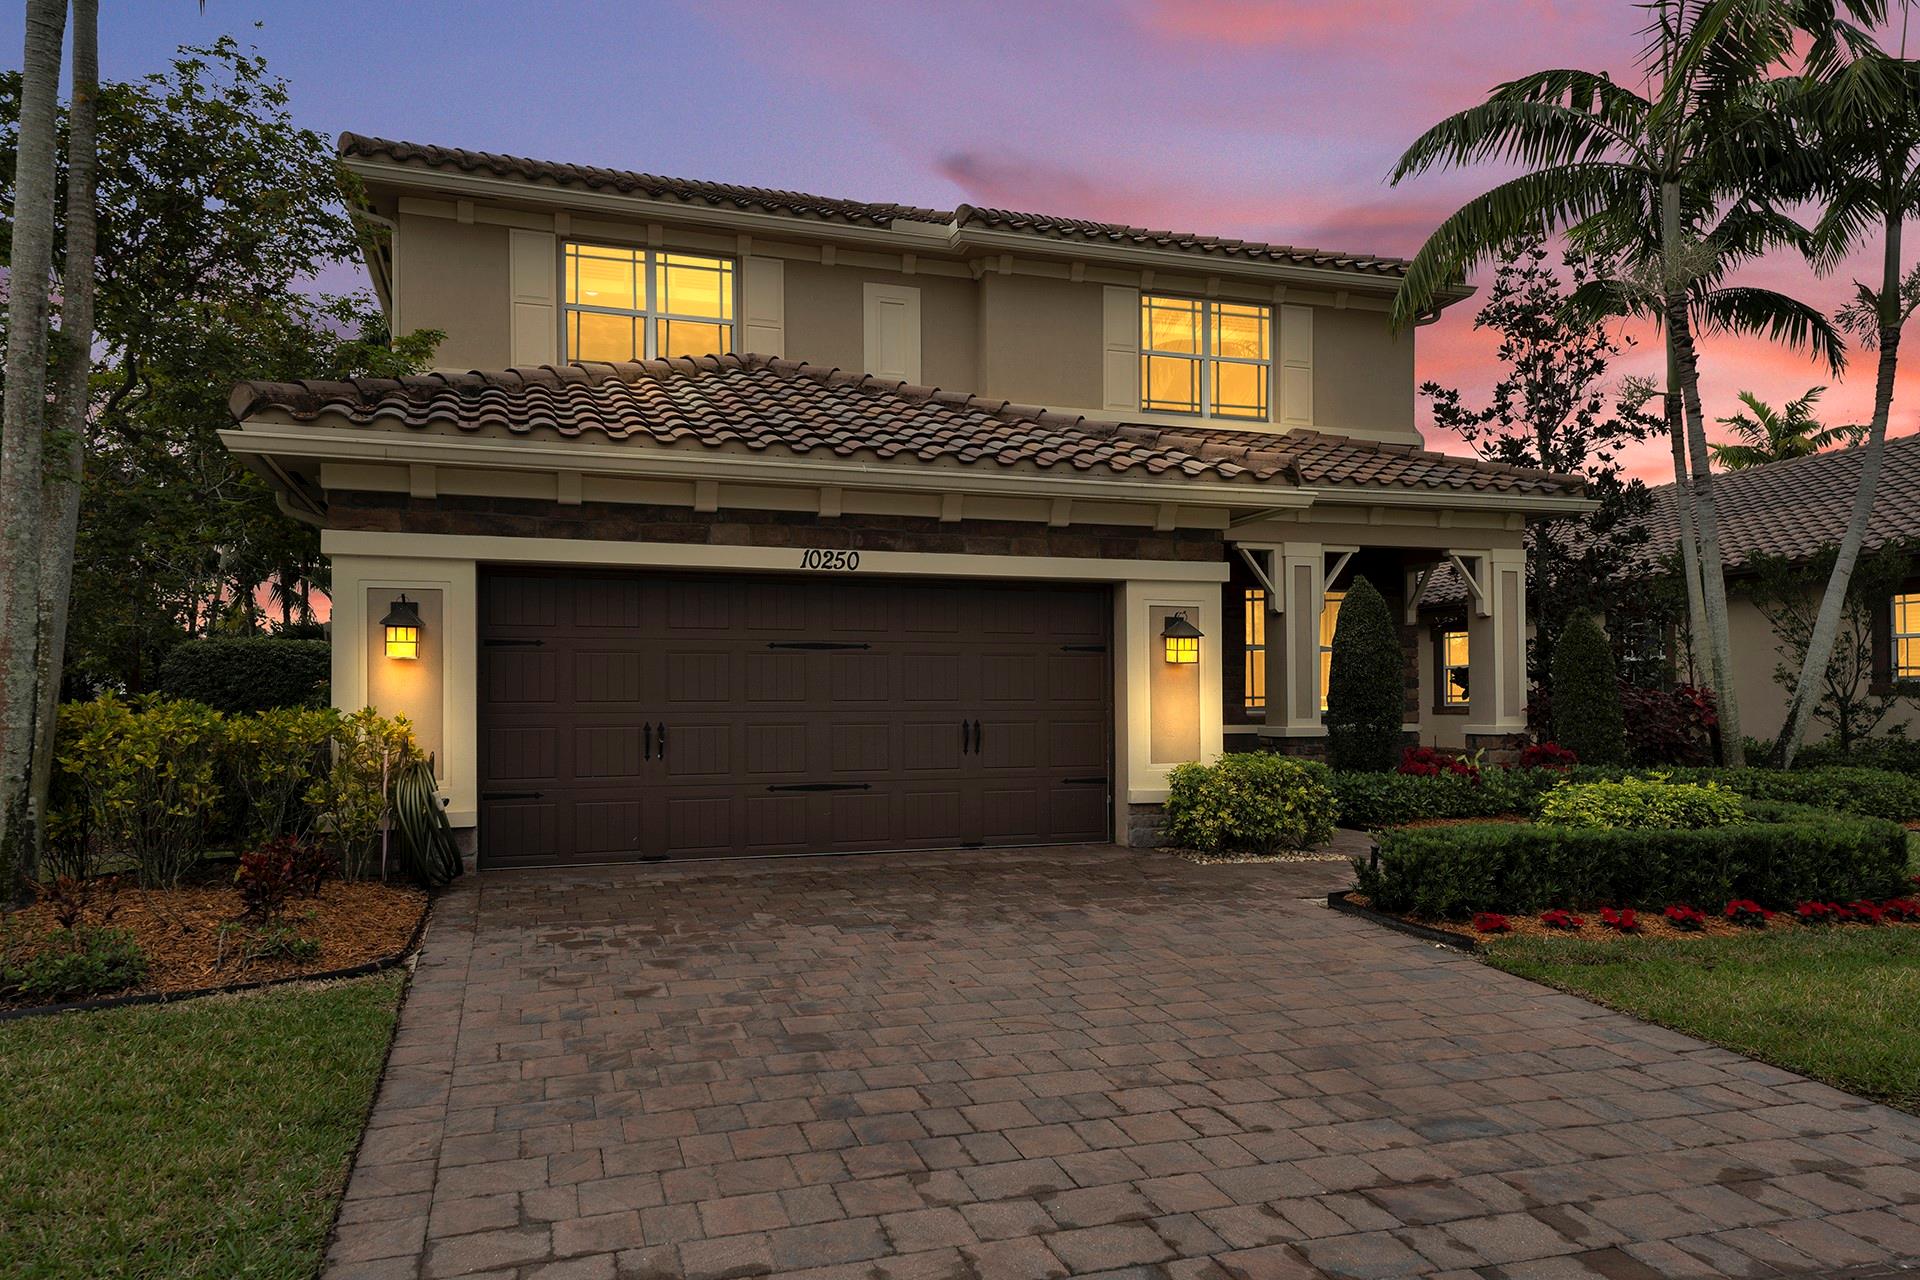
Active
$999,999
4
bds
|
4
ba
|
2,982
sqft
|
built
2014
10250 Peninsula Pl, Parkland, FL 33076
$-2,138
Cash flow
-11.2%
Cash-on-Cash Return
3.6%
Cap rate
0.7%
Rent to Value Ratio
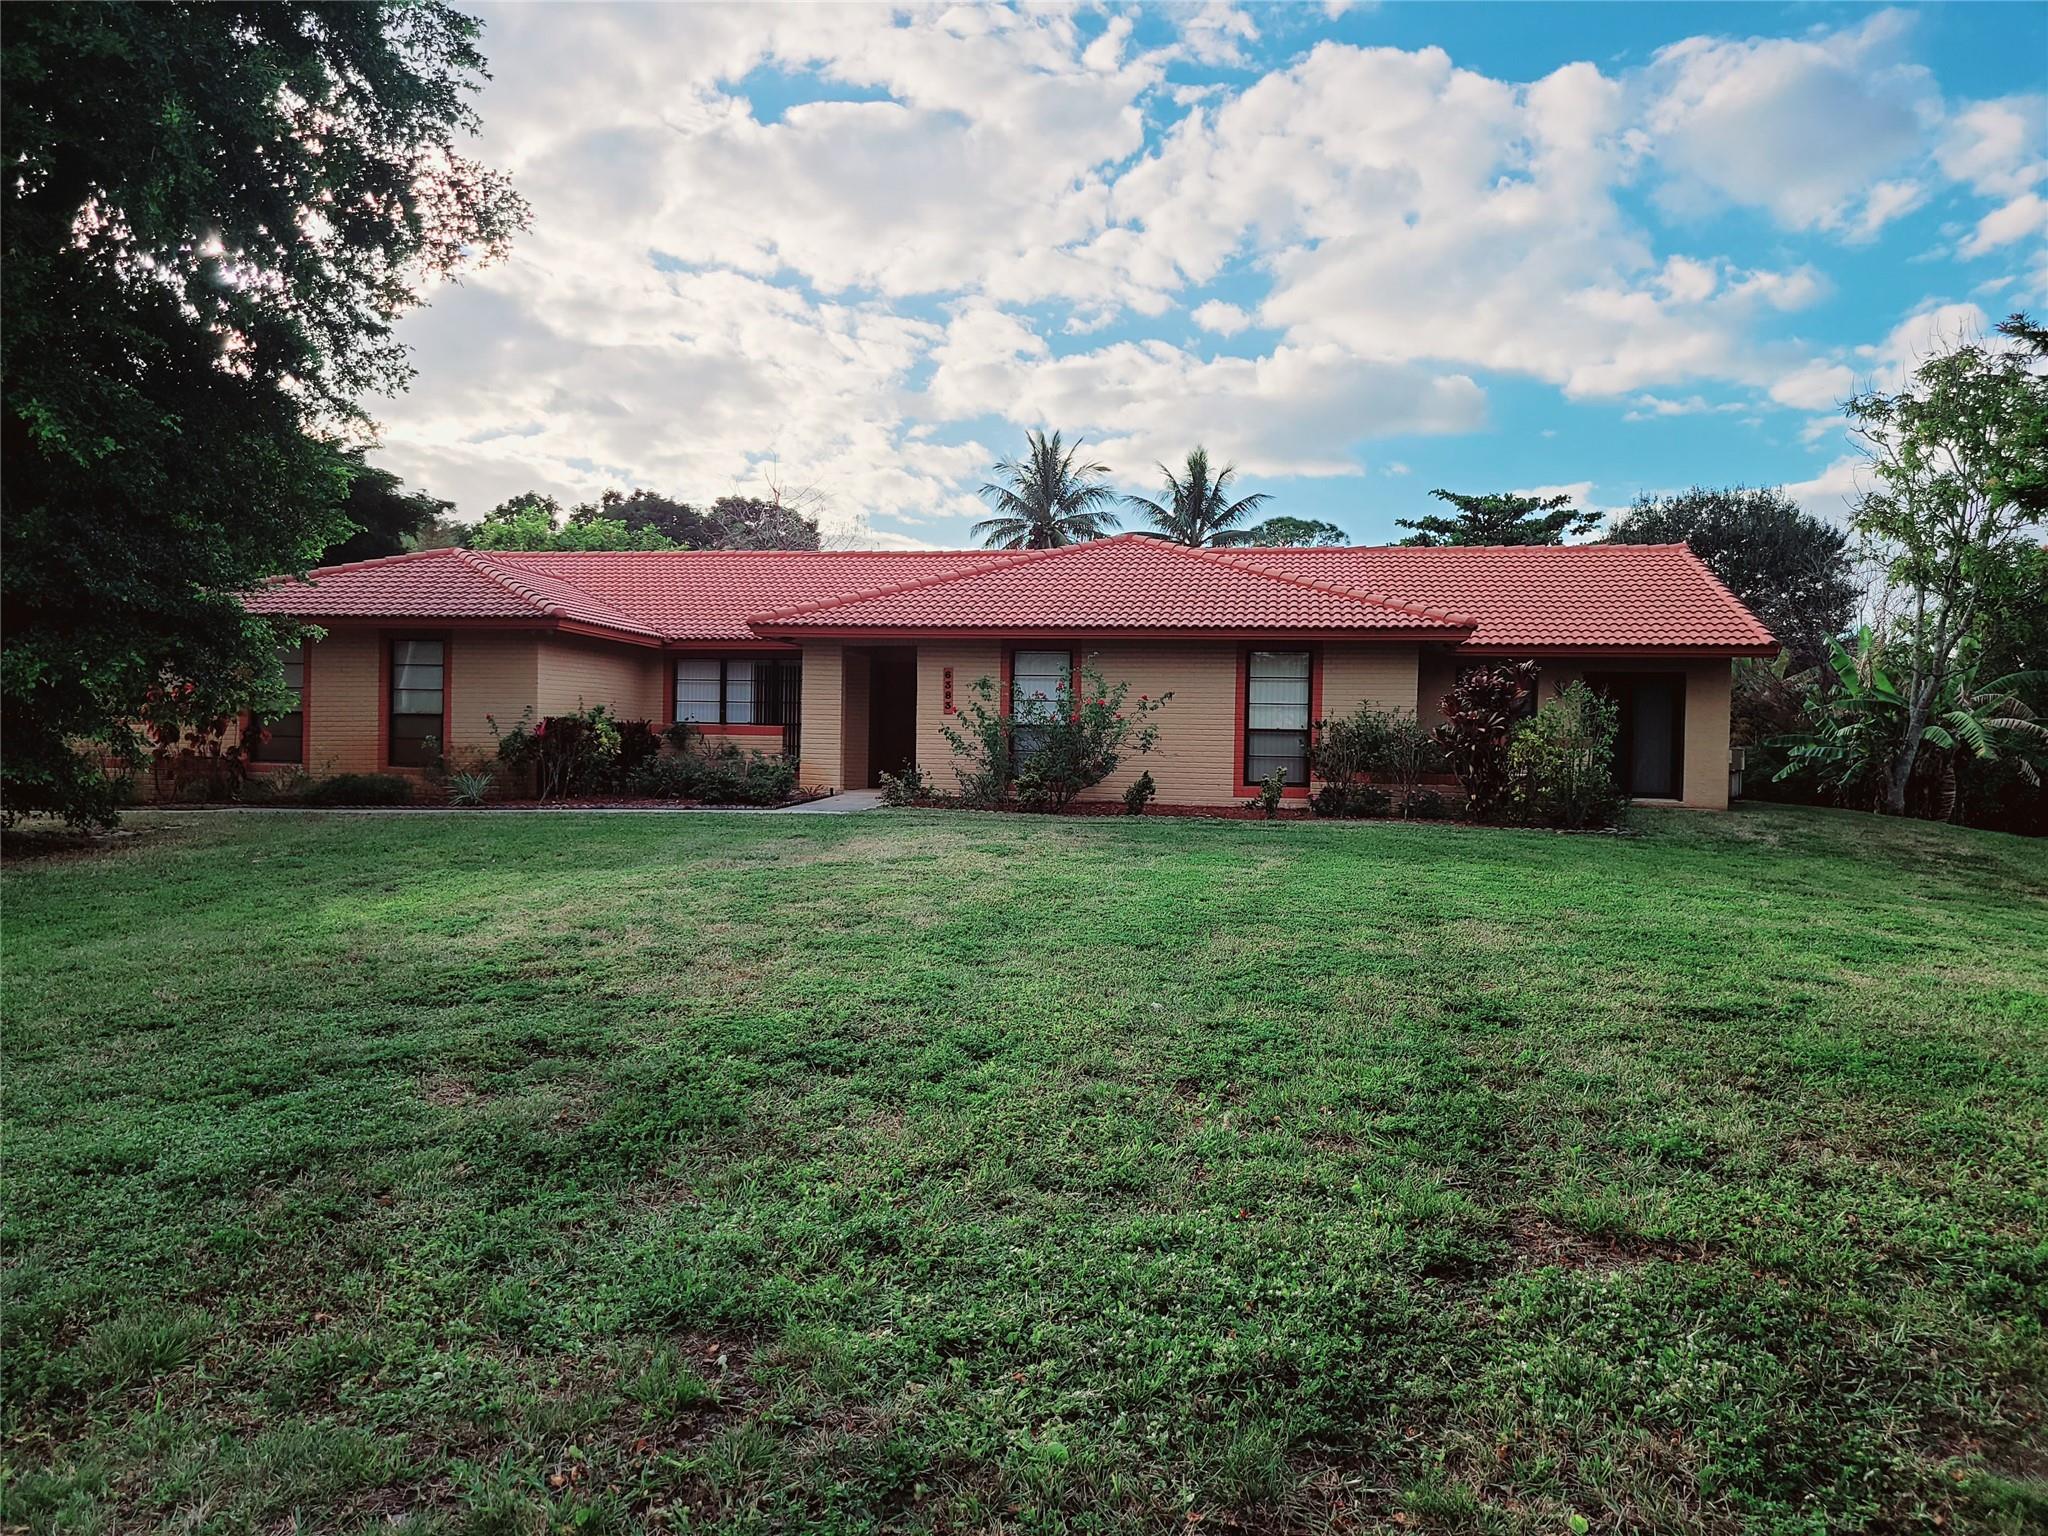
Active
$1,220,000
4
bds
|
4
ba
|
3,154
sqft
|
built
1985
6383 NW 62nd Ter, Parkland, FL 33067
$-2,788
Cash flow
-11.9%
Cash-on-Cash Return
3.4%
Cap rate
0.5%
Rent to Value Ratio
Active
$1,494,000
5
bds
|
3
ba
|
3,337
sqft
|
built
2014
8720 Watercrest Cir W, Parkland, FL 33076
$-2,817
Cash flow
-9.8%
Cash-on-Cash Return
3.9%
Cap rate
0.7%
Rent to Value Ratio
Active
$1,299,000
4
bds
|
3
ba
|
2,782
sqft
|
built
2002
7080 NW 70th Ter, Parkland, FL 33067
$-1,618
Cash flow
-6.5%
Cash-on-Cash Return
4.7%
Cap rate
0.7%
Rent to Value Ratio
Active
$810,000
4
bds
|
3
ba
|
2,319
sqft
|
built
1996
6733 NW 81st Ct, Parkland, FL 33067
$-437
Cash flow
-2.8%
Cash-on-Cash Return
5.5%
Cap rate
0.8%
Rent to Value Ratio
Active
$769,000
3
bds
|
2
ba
|
1,663
sqft
|
built
2004
7583 Old Thyme Ct, Parkland, FL 33076
$-1,527
Cash flow
-10.4%
Cash-on-Cash Return
3.8%
Cap rate
0.6%
Rent to Value Ratio
Active
$1,169,000
4
bds
|
5
ba
|
3,440
sqft
|
built
2017
9160 Meridian Dr E, Parkland, FL 33076
$-2,444
Cash flow
-10.9%
Cash-on-Cash Return
3.6%
Cap rate
0.7%
Rent to Value Ratio
Active
$1,399,000
5
bds
|
3
ba
|
3,495
sqft
|
built
2000
5811 NW 80th Ter, Parkland, FL 33067
$-3,100
Cash flow
-11.6%
Cash-on-Cash Return
3.5%
Cap rate
0.5%
Rent to Value Ratio
Active
$1,850,000
5
bds
|
5
ba
|
3,720
sqft
|
built
2018
8700 Waterview Ter, Parkland, FL 33076
$-3,880
Cash flow
-10.9%
Cash-on-Cash Return
3.6%
Cap rate
0.6%
Rent to Value Ratio
Active
$3,250,000
6
bds
|
5
ba
|
5,000
sqft
|
built
2014
10035 Bay Leaf Ct, Parkland, FL 33076
$-12,600
Cash flow
-20.2%
Cash-on-Cash Return
1.5%
Cap rate
0.3%
Rent to Value Ratio
Active
$1,319,990
5
bds
|
4
ba
|
4,176
sqft
|
built
2016
9880 S Miralago Way, Parkland, FL 33076
$-2,646
Cash flow
-10.5%
Cash-on-Cash Return
3.7%
Cap rate
0.7%
Rent to Value Ratio