Pembroke Pines, FL Investment Properties for Sale
Browse homes for sale and investment properties in Pembroke Pines, FL. Refine your search by price, property type, or more.
Best cash flowing properties in Pembroke Pines, FL
Active
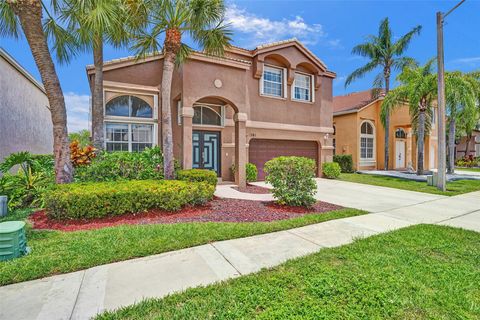
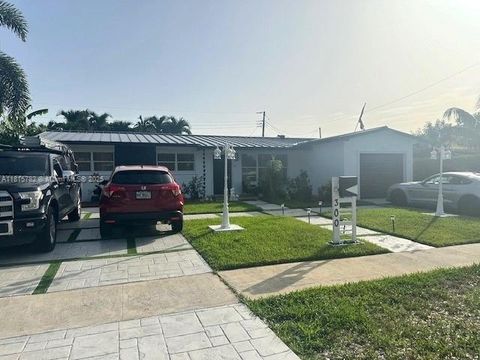
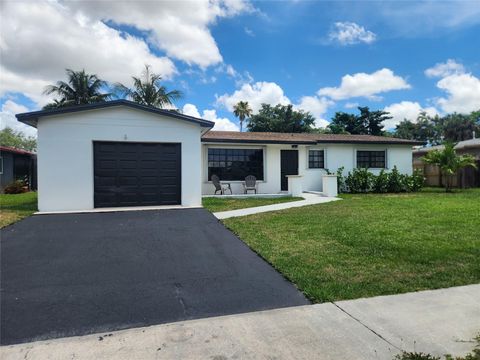
$699,000
3
bds
|
2
ba
|
1,747
sqft
|
built
1966
7051 SW 2nd Ct, Pembroke Pines, FL 33023
$-200
Cash flow
-1.5%
Cash-on-Cash Return
5.8%
Cap rate
0.7%
Rent to Value Ratio
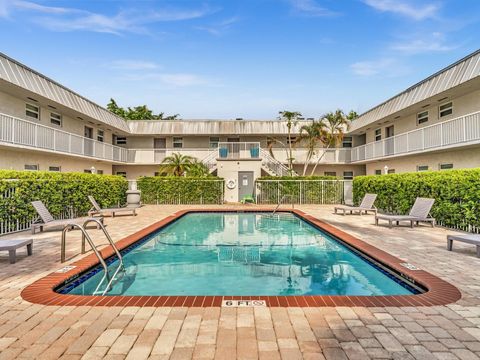
Active
$200,000
1
bds
|
1
ba
|
752
sqft
|
built
1973
2050 N Douglas Rd, Pembroke Pines, FL 33028
$-325
Cash flow
-8.5%
Cash-on-Cash Return
4.2%
Cap rate
0.9%
Rent to Value Ratio
508 out of 561 properties for sale in Pembroke Pines, FL
Limited Results Shown
Create a free account, or log in to reveal all property listings and enjoy the complete experience.
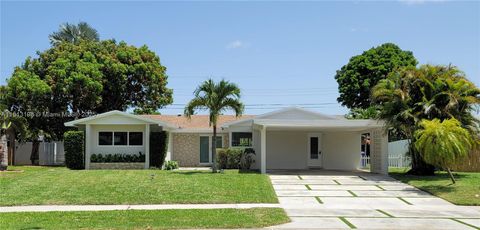
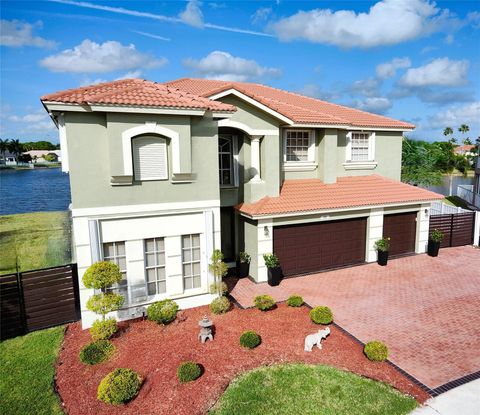
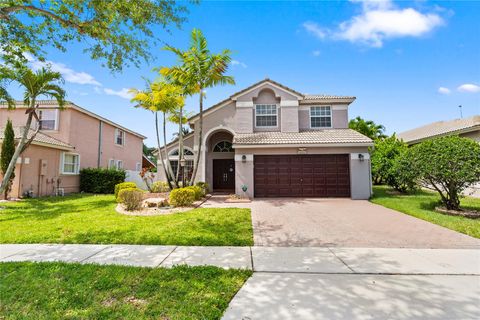
Active
$895,000
4
bds
|
3
ba
|
2,368
sqft
|
built
1994
1123 NW 195th Ave, Pembroke Pines, FL 33029
$-2,062
Cash flow
-12.0%
Cash-on-Cash Return
3.4%
Cap rate
0.6%
Rent to Value Ratio

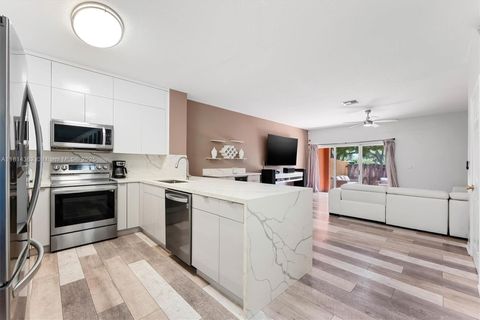
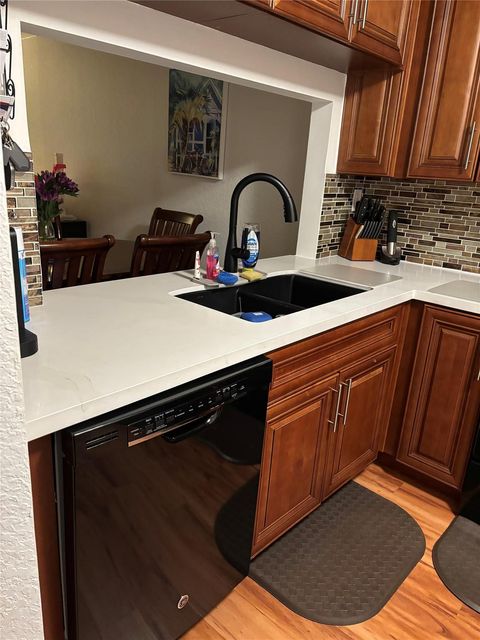
Active
$750,000
4
bds
|
3
ba
|
2,238
sqft
|
built
1997
15683 NW 12th Rd, Pembroke Pines, FL 33028
$-1,684
Cash flow
-11.7%
Cash-on-Cash Return
3.5%
Cap rate
0.5%
Rent to Value Ratio

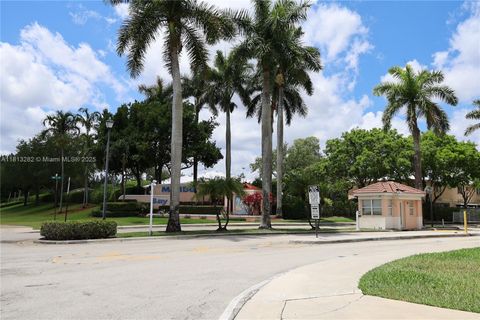
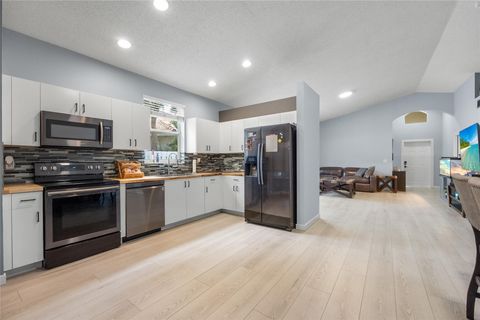
Active
$680,000
4
bds
|
3
ba
|
2,017
sqft
|
built
1995
975 NW 165th Ave, Pembroke Pines, FL 33028
$-978
Cash flow
-7.5%
Cash-on-Cash Return
4.4%
Cap rate
0.7%
Rent to Value Ratio

Active
$750,000
4
bds
|
3
ba
|
1,893
sqft
|
built
1978
11000 NW 15th St, Pembroke Pines, FL 33026
$-1,112
Cash flow
-7.7%
Cash-on-Cash Return
4.4%
Cap rate
0.7%
Rent to Value Ratio

Active
$995,000
3
bds
|
4
ba
|
2,809
sqft
|
built
1998
1463 SW 156th Way, Pembroke Pines, FL 33027
$-2,445
Cash flow
-12.8%
Cash-on-Cash Return
3.2%
Cap rate
0.5%
Rent to Value Ratio

Active
$760,000
3
bds
|
2
ba
|
1,616
sqft
|
built
2002
14420 NW 16th St, Pembroke Pines, FL 33028
$-2,145
Cash flow
-14.7%
Cash-on-Cash Return
2.8%
Cap rate
0.5%
Rent to Value Ratio

Active
$689,000
4
bds
|
3
ba
|
2,213
sqft
|
built
1993
495 SW 183rd Way, Pembroke Pines, FL 33029
$-1,895
Cash flow
-14.3%
Cash-on-Cash Return
2.8%
Cap rate
0.6%
Rent to Value Ratio

Active
$1,050,000
4
bds
|
2
ba
|
2,525
sqft
|
built
1992
720 Cypress Pointe Dr W, Pembroke Pines, FL 33027
$-3,161
Cash flow
-15.7%
Cash-on-Cash Return
2.5%
Cap rate
0.4%
Rent to Value Ratio
Active
$200,000
1
bds
|
1
ba
|
752
sqft
|
built
1973
2050 N Douglas Rd, Pembroke Pines, FL 33028
$-325
Cash flow
-8.5%
Cash-on-Cash Return
4.2%
Cap rate
0.9%
Rent to Value Ratio
Active
$759,000
4
bds
|
2
ba
|
1,966
sqft
|
built
1978
11210 NW 23rd St, Pembroke Pines, FL 33026
$-1,747
Cash flow
-12.0%
Cash-on-Cash Return
3.4%
Cap rate
0.5%
Rent to Value Ratio
Active
$815,000
4
bds
|
3
ba
|
2,740
sqft
|
built
1998
1581 NW 159th Ave, Pembroke Pines, FL 33028
$-1,707
Cash flow
-10.9%
Cash-on-Cash Return
3.6%
Cap rate
0.6%
Rent to Value Ratio
Active
$795,000
4
bds
|
3
ba
|
2,110
sqft
|
built
1963
6640 SW 7th St, Pembroke Pines, FL 33023
$-2,689
Cash flow
-17.6%
Cash-on-Cash Return
2.1%
Cap rate
0.4%
Rent to Value Ratio
Active
$497,000
3
bds
|
3
ba
|
1,584
sqft
|
built
2001
1114 NW 100th Ave, Pembroke Pines, FL 33024
$-1,360
Cash flow
-14.3%
Cash-on-Cash Return
2.9%
Cap rate
0.6%
Rent to Value Ratio

Active
$429,900
3
bds
|
2
ba
|
1,218
sqft
|
built
1976
1609 Fairway Rd, Pembroke Pines, FL 33026
$-746
Cash flow
-9.1%
Cash-on-Cash Return
4.1%
Cap rate
0.7%
Rent to Value Ratio

Active
$780,000
4
bds
|
3
ba
|
2,740
sqft
|
built
1998
1503 NW 159th Ln, Pembroke Pines, FL 33028
$-1,894
Cash flow
-12.7%
Cash-on-Cash Return
3.2%
Cap rate
0.6%
Rent to Value Ratio
Active
$480,000
3
bds
|
3
ba
|
1,361
sqft
|
built
1998
20816 NW 2nd St, Pembroke Pines, FL 33029
$-1,384
Cash flow
-15.0%
Cash-on-Cash Return
2.7%
Cap rate
0.6%
Rent to Value Ratio

Active
$269,900
2
bds
|
2
ba
|
854
sqft
|
built
1987
1791 NW 96th Ter, Pembroke Pines, FL 33024
$-480
Cash flow
-9.3%
Cash-on-Cash Return
4.0%
Cap rate
0.9%
Rent to Value Ratio

Active
$649,990
5
bds
|
2
ba
|
0
sqft
|
built
1992
18866 NW 1st St, Pembroke Pines, FL 33029
$-1,317
Cash flow
-10.6%
Cash-on-Cash Return
3.7%
Cap rate
0.5%
Rent to Value Ratio

Active
$749,900
3
bds
|
2
ba
|
1,991
sqft
|
built
1998
16306 SW 11th St, Pembroke Pines, FL 33027
$-1,867
Cash flow
-13.0%
Cash-on-Cash Return
3.2%
Cap rate
0.5%
Rent to Value Ratio

Active
$279,999
2
bds
|
2
ba
|
854
sqft
|
built
1987
1881 NW 96th Ter, Pembroke Pines, FL 33024
$-713
Cash flow
-13.3%
Cash-on-Cash Return
3.1%
Cap rate
0.8%
Rent to Value Ratio

Active
$475,000
3
bds
|
3
ba
|
1,584
sqft
|
built
2001
1104 NW 100th Ave, Pembroke Pines, FL 33024
$-1,111
Cash flow
-12.2%
Cash-on-Cash Return
3.3%
Cap rate
0.7%
Rent to Value Ratio
Active
$899,950
4
bds
|
2
ba
|
1,624
sqft
|
built
1966
300 NW 77th Way, Pembroke Pines, FL 33024
$-2,485
Cash flow
-14.4%
Cash-on-Cash Return
2.8%
Cap rate
0.5%
Rent to Value Ratio

Active
$429,900
2
bds
|
3
ba
|
1,260
sqft
|
built
1985
10428 NW 3rd St, Pembroke Pines, FL 33026
$-1,058
Cash flow
-12.8%
Cash-on-Cash Return
3.2%
Cap rate
0.6%
Rent to Value Ratio
Active
$1,345,000
4
bds
|
4
ba
|
3,007
sqft
|
built
1997
380 SW 167th Ave, Pembroke Pines, FL 33027
$-4,992
Cash flow
-19.4%
Cash-on-Cash Return
1.7%
Cap rate
0.3%
Rent to Value Ratio

Active
$490,000
3
bds
|
3
ba
|
1,584
sqft
|
built
2001
1001 NW 100th Ave, Pembroke Pines, FL 33024
$-1,096
Cash flow
-11.7%
Cash-on-Cash Return
3.5%
Cap rate
0.7%
Rent to Value Ratio
Active
$289,900
2
bds
|
2
ba
|
806
sqft
|
built
1986
1172 NW 106th Ter, Pembroke Pines, FL 33026
$-462
Cash flow
-8.3%
Cash-on-Cash Return
4.2%
Cap rate
0.8%
Rent to Value Ratio

Active
$649,900
3
bds
|
3
ba
|
2,098
sqft
|
built
2016
1403 SW 113th Ave, Pembroke Pines, FL 33025
$-1,872
Cash flow
-15.0%
Cash-on-Cash Return
2.7%
Cap rate
0.6%
Rent to Value Ratio

Active
$490,000
3
bds
|
3
ba
|
1,379
sqft
|
built
2009
1083 SW 143rd Ave, Pembroke Pines, FL 33027
$-1,488
Cash flow
-15.8%
Cash-on-Cash Return
2.5%
Cap rate
0.6%
Rent to Value Ratio
Active
$699,000
3
bds
|
2
ba
|
1,747
sqft
|
built
1966
7051 SW 2nd Ct, Pembroke Pines, FL 33023
$-200
Cash flow
-1.5%
Cash-on-Cash Return
5.8%
Cap rate
0.7%
Rent to Value Ratio

Active
$489,900
3
bds
|
2
ba
|
1,299
sqft
|
built
1976
1489 Fairway Rd, Pembroke Pines, FL 33026
$-1,238
Cash flow
-13.2%
Cash-on-Cash Return
3.1%
Cap rate
0.6%
Rent to Value Ratio
Active
$519,999
2
bds
|
2
ba
|
1,264
sqft
|
built
2001
801 NW 130th Ave, Pembroke Pines, FL 33028
$-1,069
Cash flow
-10.7%
Cash-on-Cash Return
3.7%
Cap rate
0.6%
Rent to Value Ratio
Active
$649,000
3
bds
|
2
ba
|
1,578
sqft
|
built
1968
8301 NW 17th Ct, Pembroke Pines, FL 33024
$-1,018
Cash flow
-8.2%
Cash-on-Cash Return
4.3%
Cap rate
0.5%
Rent to Value Ratio

Active
$499,000
3
bds
|
2
ba
|
1,386
sqft
|
built
1987
8600 SW 12th St, Pembroke Pines, FL 33025
$-1,135
Cash flow
-11.9%
Cash-on-Cash Return
3.4%
Cap rate
0.6%
Rent to Value Ratio

Active
$230,000
1
bds
|
1
ba
|
628
sqft
|
built
1987
2151 NW 96th Ter, Pembroke Pines, FL 33024
$-639
Cash flow
-14.5%
Cash-on-Cash Return
2.8%
Cap rate
0.8%
Rent to Value Ratio

Active
$949,900
3
bds
|
3
ba
|
2,104
sqft
|
built
2011
3990 NW 85th Ave, Pembroke Pines, FL 33024
$-2,155
Cash flow
-11.8%
Cash-on-Cash Return
3.4%
Cap rate
0.6%
Rent to Value Ratio
Active
$790,000
4
bds
|
3
ba
|
2,339
sqft
|
built
2001
14260 NW 18th Pl, Pembroke Pines, FL 33028
$-2,674
Cash flow
-17.7%
Cash-on-Cash Return
2.1%
Cap rate
0.5%
Rent to Value Ratio

Active
$445,000
2
bds
|
2
ba
|
1,196
sqft
|
built
1977
10760 Hickory Ave, Pembroke Pines, FL 33026
$-936
Cash flow
-11.0%
Cash-on-Cash Return
3.6%
Cap rate
0.6%
Rent to Value Ratio

Active
$365,000
2
bds
|
2
ba
|
1,017
sqft
|
built
1985
11604 NW 11th St, Pembroke Pines, FL 33026
$-1,109
Cash flow
-15.9%
Cash-on-Cash Return
2.5%
Cap rate
0.6%
Rent to Value Ratio

Active
$379,900
4
bds
|
3
ba
|
1,616
sqft
|
built
1979
1551 NW 92nd Ave, Pembroke Pines, FL 33024
$-1,057
Cash flow
-14.5%
Cash-on-Cash Return
2.8%
Cap rate
0.7%
Rent to Value Ratio
Active
$450,000
3
bds
|
3
ba
|
1,361
sqft
|
built
1998
20866 NW 3rd Ln, Pembroke Pines, FL 33029
$-1,000
Cash flow
-11.6%
Cash-on-Cash Return
3.5%
Cap rate
0.6%
Rent to Value Ratio