Pembroke Pines, FL Investment Properties for Sale
Browse homes for sale and investment properties in Pembroke Pines, FL. Refine your search by price, property type, or more.
Best cash flowing properties in Pembroke Pines, FL
Active
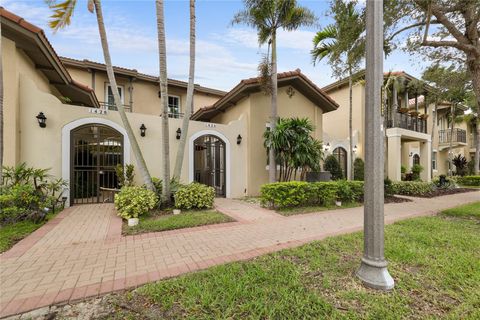
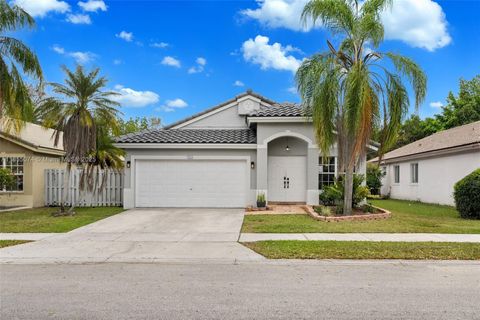
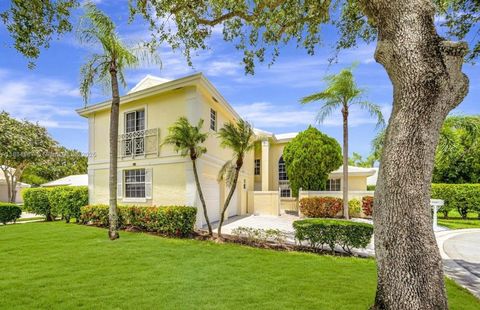
$599,999
4
bds
|
3
ba
|
1,817
sqft
|
built
2013
1424 SW 147th Ave, Pembroke Pines, FL 33027
$0
Cash flow
n/a
Cash-on-Cash Return
n/a
Cap rate
n/a
Rent to Value Ratio
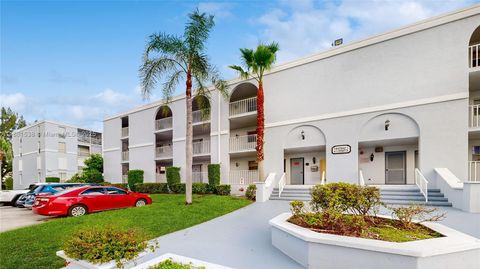
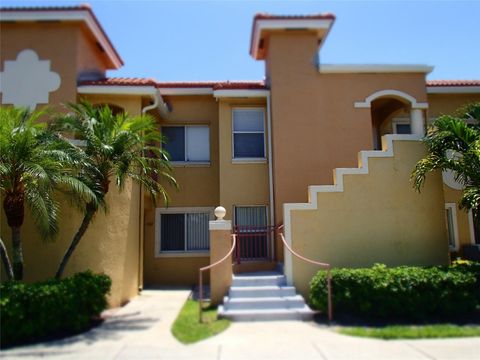
Active
$235,000
2
bds
|
2
ba
|
1,399
sqft
|
built
1992
1501 SW 131st Way, Pembroke Pines, FL 33027
$-308
Cash flow
-6.8%
Cash-on-Cash Return
4.6%
Cap rate
1.1%
Rent to Value Ratio
286 out of 499 properties for sale in Pembroke Pines, FL
Limited Results Shown
Create a free account, or log in to reveal all property listings and enjoy the complete experience.
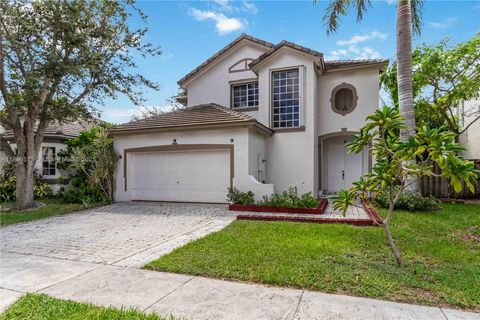
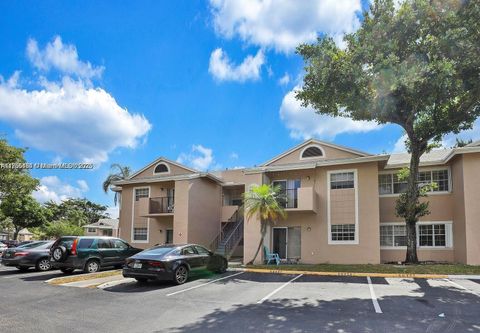
Active
$630,000
3
bds
|
3
ba
|
1,952
sqft
|
built
1998
1958 NW 100th Ave, Pembroke Pines, FL 33024
$-1,356
Cash flow
-11.2%
Cash-on-Cash Return
3.6%
Cap rate
0.6%
Rent to Value Ratio
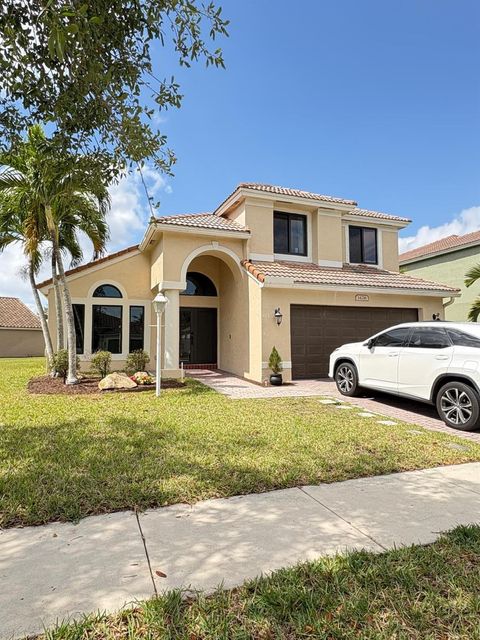
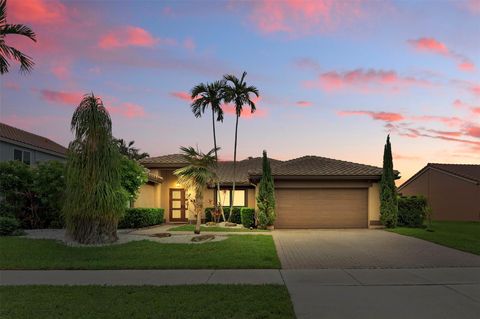
Active
$878,500
4
bds
|
3
ba
|
2,355
sqft
|
built
2000
14216 NW 21st St, Pembroke Pines, FL 33028
$-6,606
Cash flow
-39.2%
Cash-on-Cash Return
-2.9%
Cap rate
0.6%
Rent to Value Ratio
Active
$235,000
2
bds
|
2
ba
|
1,100
sqft
|
built
1974
661 N University Dr, Pembroke Pines, FL 33024
$-381
Cash flow
-8.5%
Cash-on-Cash Return
4.2%
Cap rate
0.9%
Rent to Value Ratio
Active
$785,000
4
bds
|
3
ba
|
2,392
sqft
|
built
1996
18840 NW 23rd Pl, Pembroke Pines, FL 33029
$-1,619
Cash flow
-10.8%
Cash-on-Cash Return
3.7%
Cap rate
0.6%
Rent to Value Ratio
Active
$700,000
4
bds
|
3
ba
|
2,452
sqft
|
built
1973
621 NW 97th Ter, Pembroke Pines, FL 33024
$-1,733
Cash flow
-12.9%
Cash-on-Cash Return
3.2%
Cap rate
0.6%
Rent to Value Ratio
Active
$269,900
2
bds
|
2
ba
|
854
sqft
|
built
1987
1791 NW 96th Ter, Pembroke Pines, FL 33024
$-484
Cash flow
-9.4%
Cash-on-Cash Return
4.0%
Cap rate
0.9%
Rent to Value Ratio

Active
$714,900
4
bds
|
3
ba
|
2,512
sqft
|
built
2001
1858 NW 74th Way, Pembroke Pines, FL 33024
$-2,658
Cash flow
-19.4%
Cash-on-Cash Return
1.7%
Cap rate
0.4%
Rent to Value Ratio
Active
$268,900
2
bds
|
2
ba
|
970
sqft
|
built
2001
7820 NW 7th St, Pembroke Pines, FL 33024
$-563
Cash flow
-10.9%
Cash-on-Cash Return
3.6%
Cap rate
0.9%
Rent to Value Ratio

Active
$269,000
2
bds
|
2
ba
|
854
sqft
|
built
1989
2301 NW 96th Ter, Pembroke Pines, FL 33024
$-622
Cash flow
-12.1%
Cash-on-Cash Return
3.4%
Cap rate
0.9%
Rent to Value Ratio
Active
$899,000
4
bds
|
3
ba
|
2,419
sqft
|
built
1991
1930 NW 180th Way, Pembroke Pines, FL 33029
$-2,018
Cash flow
-11.7%
Cash-on-Cash Return
3.5%
Cap rate
0.6%
Rent to Value Ratio

Active
$530,000
3
bds
|
2
ba
|
1,360
sqft
|
built
1971
1201 NW 79th Way, Pembroke Pines, FL 33024
$-1,145
Cash flow
-11.3%
Cash-on-Cash Return
3.6%
Cap rate
0.5%
Rent to Value Ratio

Active
$679,000
4
bds
|
3
ba
|
2,087
sqft
|
built
1998
15343 NW 14th Rd, Pembroke Pines, FL 33028
$-1,506
Cash flow
-11.6%
Cash-on-Cash Return
3.5%
Cap rate
0.5%
Rent to Value Ratio
Active
$249,900
2
bds
|
2
ba
|
854
sqft
|
built
1989
2361 NW 96th Ter, Pembroke Pines, FL 33024
$-588
Cash flow
-12.3%
Cash-on-Cash Return
3.3%
Cap rate
0.9%
Rent to Value Ratio
Active
$875,000
4
bds
|
3
ba
|
2,368
sqft
|
built
1994
1123 NW 195th Ave, Pembroke Pines, FL 33029
$-1,959
Cash flow
-11.7%
Cash-on-Cash Return
3.5%
Cap rate
0.7%
Rent to Value Ratio
Active
$610,000
4
bds
|
2
ba
|
1,663
sqft
|
built
1997
251 SW 203rd Ave, Pembroke Pines, FL 33029
$-1,654
Cash flow
-14.1%
Cash-on-Cash Return
2.9%
Cap rate
0.5%
Rent to Value Ratio

Active
$1,100,000
5
bds
|
4
ba
|
3,007
sqft
|
built
2002
7264 NW 19th Ct, Pembroke Pines, FL 33024
$-1,204
Cash flow
-5.7%
Cash-on-Cash Return
4.8%
Cap rate
0.7%
Rent to Value Ratio
Active
$775,000
3
bds
|
3
ba
|
2,365
sqft
|
built
1993
19441 NW 3rd St, Pembroke Pines, FL 33029
$-1,807
Cash flow
-12.2%
Cash-on-Cash Return
3.3%
Cap rate
0.5%
Rent to Value Ratio

Active
$649,990
3
bds
|
2
ba
|
1,461
sqft
|
built
1986
10000 SW 9th Ct, Pembroke Pines, FL 33025
$-1,946
Cash flow
-15.6%
Cash-on-Cash Return
2.6%
Cap rate
0.6%
Rent to Value Ratio
Active
$925,000
5
bds
|
3
ba
|
2,814
sqft
|
built
1994
212 SW 179th Ave, Pembroke Pines, FL 33029
$-1,543
Cash flow
-8.7%
Cash-on-Cash Return
4.1%
Cap rate
0.7%
Rent to Value Ratio

Active
$469,718
3
bds
|
3
ba
|
1,686
sqft
|
built
1977
1111 Windward Dr, Pembroke Pines, FL 33026
$-622
Cash flow
-6.9%
Cash-on-Cash Return
4.6%
Cap rate
0.7%
Rent to Value Ratio

Active
$519,000
3
bds
|
2
ba
|
1,796
sqft
|
built
1978
9700 NW 10th St, Pembroke Pines, FL 33024
$-769
Cash flow
-7.7%
Cash-on-Cash Return
4.4%
Cap rate
0.7%
Rent to Value Ratio

Active
$649,999
4
bds
|
3
ba
|
2,078
sqft
|
built
1998
1474 NW 153rd Ln, Pembroke Pines, FL 33028
$-1,072
Cash flow
-8.6%
Cash-on-Cash Return
4.2%
Cap rate
0.7%
Rent to Value Ratio
Active
$588,000
3
bds
|
2
ba
|
2,118
sqft
|
built
1992
18845 NW 1st St, Pembroke Pines, FL 33029
$-1,541
Cash flow
-13.7%
Cash-on-Cash Return
3.0%
Cap rate
0.6%
Rent to Value Ratio

Active
$839,900
4
bds
|
3
ba
|
2,104
sqft
|
built
1993
19000 NW 10th St, Pembroke Pines, FL 33029
$-892
Cash flow
-5.5%
Cash-on-Cash Return
4.9%
Cap rate
0.7%
Rent to Value Ratio

Active
$669,000
3
bds
|
2
ba
|
1,606
sqft
|
built
1977
1770 NW 106th Ave, Pembroke Pines, FL 33026
$-1,287
Cash flow
-10.0%
Cash-on-Cash Return
3.8%
Cap rate
0.6%
Rent to Value Ratio
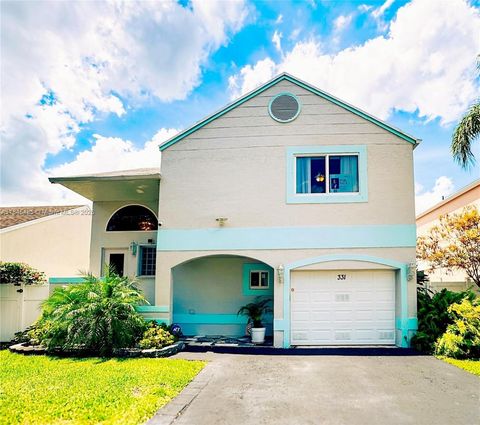
Active
$565,000
4
bds
|
3
ba
|
1,496
sqft
|
built
1988
331 NW 101st Ter, Pembroke Pines, FL 33026
$-1,146
Cash flow
-10.6%
Cash-on-Cash Return
3.7%
Cap rate
0.5%
Rent to Value Ratio
Active
$899,900
5
bds
|
3
ba
|
3,156
sqft
|
built
1999
16831 SW 6th St, Pembroke Pines, FL 33027
$-2,274
Cash flow
-13.2%
Cash-on-Cash Return
3.1%
Cap rate
0.5%
Rent to Value Ratio

Active
$985,000
5
bds
|
3
ba
|
2,794
sqft
|
built
1999
19077 NW 23rd Ct, Pembroke Pines, FL 33029
$-2,816
Cash flow
-14.9%
Cash-on-Cash Return
2.7%
Cap rate
0.5%
Rent to Value Ratio
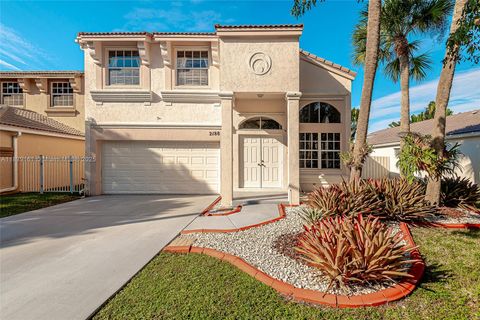
Active
$699,000
3
bds
|
3
ba
|
2,087
sqft
|
built
1999
2188 NW 158th Ave, Pembroke Pines, FL 33028
$-1,624
Cash flow
-12.1%
Cash-on-Cash Return
3.4%
Cap rate
0.6%
Rent to Value Ratio

Active
$899,000
bds
|
0
ba
|
2,631
sqft
|
built
1970
7031 Pembroke Rd, Pembroke Pines, FL 33023
$-4,215
Cash flow
-24.5%
Cash-on-Cash Return
0.5%
Cap rate
0.2%
Rent to Value Ratio
Active
$722,500
3
bds
|
2
ba
|
1,624
sqft
|
built
1990
15218 Wilshire Cir S, Pembroke Pines, FL 33027
$-1,697
Cash flow
-12.3%
Cash-on-Cash Return
3.3%
Cap rate
0.5%
Rent to Value Ratio

Active
$510,000
3
bds
|
2
ba
|
1,209
sqft
|
built
1968
8501 NW 11th Ct, Pembroke Pines, FL 33024
$-607
Cash flow
-6.2%
Cash-on-Cash Return
4.7%
Cap rate
0.7%
Rent to Value Ratio
Active
$710,000
3
bds
|
3
ba
|
2,056
sqft
|
built
1991
15281 Wilshire Ct, Pembroke Pines, FL 33027
$-1,683
Cash flow
-12.4%
Cash-on-Cash Return
3.3%
Cap rate
0.6%
Rent to Value Ratio

Active
$427,500
2
bds
|
3
ba
|
1,482
sqft
|
built
1979
11291 NW 16th Ct, Pembroke Pines, FL 33026
$-1,039
Cash flow
-12.7%
Cash-on-Cash Return
3.2%
Cap rate
0.7%
Rent to Value Ratio
Active
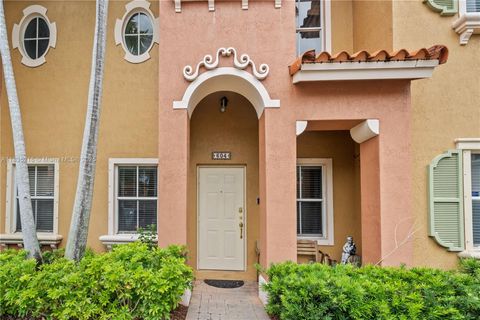
$369,000
2
bds
|
3
ba
|
1,170
sqft
|
built
2003
604 SW 107th Ave, Pembroke Pines, FL 33025
$-894
Cash flow
-12.6%
Cash-on-Cash Return
3.2%
Cap rate
0.7%
Rent to Value Ratio
Active
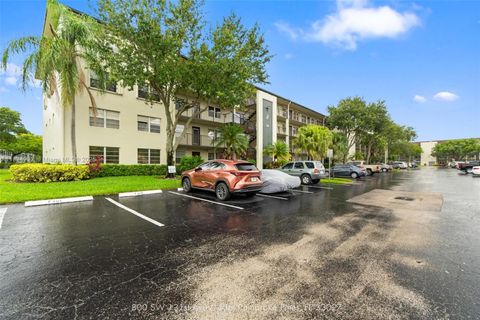
$165,000
2
bds
|
2
ba
|
953
sqft
|
built
1985
800 SW 131st Ave, Pembroke Pines, FL 33027
$-344
Cash flow
-10.9%
Cash-on-Cash Return
3.6%
Cap rate
1.1%
Rent to Value Ratio
Active
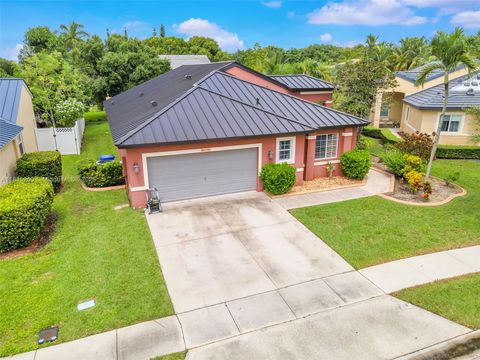
$738,900
4
bds
|
3
ba
|
2,098
sqft
|
built
1995
326 SW 162nd Ave, Pembroke Pines, FL 33027
$-1,164
Cash flow
-8.2%
Cash-on-Cash Return
4.3%
Cap rate
0.6%
Rent to Value Ratio
Active
$495,000
3
bds
|
3
ba
|
1,588
sqft
|
built
1985
1239 NW 122nd Ter, Pembroke Pines, FL 33026
$-1,136
Cash flow
-12.0%
Cash-on-Cash Return
3.4%
Cap rate
0.6%
Rent to Value Ratio