Pembroke Pines, FL Investment Properties for Sale
Browse homes for sale and investment properties in Pembroke Pines, FL. Refine your search by price, property type, or more.
Best cash flowing properties in Pembroke Pines, FL
Active
$460,000
2
bds
|
2
ba
|
1,060
sqft
|
built
1981
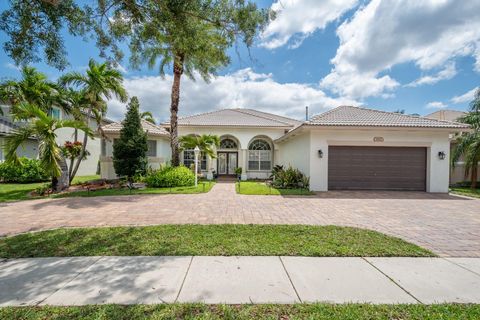
1530 NW 96th Ave, Pembroke Pines, FL 33024
$0
Cash flow
n/a
Cash-on-Cash Return
n/a
Cap rate
n/a
Rent to Value Ratio

Active
$155,000
1
bds
|
1
ba
|
684
sqft
|
built
1980
7910 Taft St, Pembroke Pines, FL 33024
$-260
Cash flow
-8.8%
Cash-on-Cash Return
4.1%
Cap rate
1.0%
Rent to Value Ratio
509 out of 561 properties for sale in Pembroke Pines, FL
Limited Results Shown
Create a free account, or log in to reveal all property listings and enjoy the complete experience.
Active
$399,000
2
bds
|
3
ba
|
1,660
sqft
|
built
2015
948 SW 147th Ave, Pembroke Pines, FL 33027
$-763
Cash flow
-10.0%
Cash-on-Cash Return
3.9%
Cap rate
0.7%
Rent to Value Ratio

Active
$355,000
2
bds
|
2
ba
|
1,048
sqft
|
built
2015
964 SW 147th Ave, Pembroke Pines, FL 33027
$-656
Cash flow
-9.6%
Cash-on-Cash Return
3.9%
Cap rate
0.7%
Rent to Value Ratio

Active
$437,000
2
bds
|
3
ba
|
1,232
sqft
|
built
1987
11263 SW 9th Ct, Pembroke Pines, FL 33025
$-1,053
Cash flow
-12.6%
Cash-on-Cash Return
3.3%
Cap rate
0.7%
Rent to Value Ratio

Active
$995,000
5
bds
|
5
ba
|
3,561
sqft
|
built
1998
1951 NW 167th Ter, Pembroke Pines, FL 33028
$-2,284
Cash flow
-12.0%
Cash-on-Cash Return
3.4%
Cap rate
0.6%
Rent to Value Ratio
Active
$338,900
2
bds
|
2
ba
|
1,115
sqft
|
built
1990
502 SW 158th Ter, Pembroke Pines, FL 33027
$-1,122
Cash flow
-17.3%
Cash-on-Cash Return
2.2%
Cap rate
0.7%
Rent to Value Ratio

Active
$495,000
2
bds
|
2
ba
|
1,196
sqft
|
built
1977
11140 Redwood Ave, Pembroke Pines, FL 33026
$-717
Cash flow
-7.6%
Cash-on-Cash Return
4.4%
Cap rate
0.6%
Rent to Value Ratio
Active
$690,000
3
bds
|
3
ba
|
1,836
sqft
|
built
1995
365 NW 154th Ave, Pembroke Pines, FL 33028
$-1,207
Cash flow
-9.1%
Cash-on-Cash Return
4.0%
Cap rate
0.6%
Rent to Value Ratio
Active
$420,000
2
bds
|
3
ba
|
1,226
sqft
|
built
1995
2412 NW 97th Way, Pembroke Pines, FL 33024
$-727
Cash flow
-9.0%
Cash-on-Cash Return
4.1%
Cap rate
0.7%
Rent to Value Ratio
Active
$755,000
4
bds
|
3
ba
|
2,240
sqft
|
built
1996
16604 SW 1st St, Pembroke Pines, FL 33027
$-1,547
Cash flow
-10.7%
Cash-on-Cash Return
3.7%
Cap rate
0.6%
Rent to Value Ratio
Active
$774,000
4
bds
|
3
ba
|
2,541
sqft
|
built
1977
1821 NW 113th Ave, Pembroke Pines, FL 33026
$-1,856
Cash flow
-12.5%
Cash-on-Cash Return
3.3%
Cap rate
0.5%
Rent to Value Ratio

Active
$849,800
4
bds
|
3
ba
|
2,420
sqft
|
built
1994
19313 NW 11th St, Pembroke Pines, FL 33029
$-1,080
Cash flow
-6.6%
Cash-on-Cash Return
4.6%
Cap rate
0.7%
Rent to Value Ratio
Active
$680,000
3
bds
|
3
ba
|
2,087
sqft
|
built
2002
1735 NW 77th Ave, Pembroke Pines, FL 33024
$-1,877
Cash flow
-14.4%
Cash-on-Cash Return
2.8%
Cap rate
0.5%
Rent to Value Ratio
Active
$1,249,000
5
bds
|
3
ba
|
2,829
sqft
|
built
2001
1865 NW 140th Ter, Pembroke Pines, FL 33028
$-3,469
Cash flow
-14.5%
Cash-on-Cash Return
2.8%
Cap rate
0.4%
Rent to Value Ratio
Active
$428,000
2
bds
|
3
ba
|
1,232
sqft
|
built
1988
11236 SW 11th St, Pembroke Pines, FL 33025
$-912
Cash flow
-11.1%
Cash-on-Cash Return
3.6%
Cap rate
0.7%
Rent to Value Ratio
Active
$287,990
2
bds
|
2
ba
|
1,065
sqft
|
built
2002
11185 SW 6th St, Pembroke Pines, FL 33025
$-899
Cash flow
-16.3%
Cash-on-Cash Return
2.4%
Cap rate
0.8%
Rent to Value Ratio

Active
$238,000
1
bds
|
1
ba
|
742
sqft
|
built
2000
620 SW 111th Ave, Pembroke Pines, FL 33025
$-698
Cash flow
-15.3%
Cash-on-Cash Return
2.6%
Cap rate
0.8%
Rent to Value Ratio
Active
$715,000
4
bds
|
3
ba
|
2,255
sqft
|
built
1995
17686 SW 10th St, Pembroke Pines, FL 33029
$-1,400
Cash flow
-10.2%
Cash-on-Cash Return
3.8%
Cap rate
0.6%
Rent to Value Ratio
Active
$649,000
3
bds
|
2
ba
|
1,957
sqft
|
built
1990
17522 NW 12th St, Pembroke Pines, FL 33029
$-1,381
Cash flow
-11.1%
Cash-on-Cash Return
3.6%
Cap rate
0.7%
Rent to Value Ratio
Active
$634,900
4
bds
|
3
ba
|
2,011
sqft
|
built
1986
930 SW 99th Ave, Pembroke Pines, FL 33025
$-1,473
Cash flow
-12.1%
Cash-on-Cash Return
3.4%
Cap rate
0.6%
Rent to Value Ratio
Active
$610,000
3
bds
|
2
ba
|
1,412
sqft
|
built
1993
17654 SW 6th St, Pembroke Pines, FL 33029
$-1,225
Cash flow
-10.5%
Cash-on-Cash Return
3.7%
Cap rate
0.6%
Rent to Value Ratio

Active
$160,000
2
bds
|
2
ba
|
980
sqft
|
built
1978
1300 Saint Charles Pl, Pembroke Pines, FL 33026
$-307
Cash flow
-10.0%
Cash-on-Cash Return
3.8%
Cap rate
1.3%
Rent to Value Ratio

Active
$819,900
4
bds
|
3
ba
|
2,596
sqft
|
built
1994
19386 NW 13th St, Pembroke Pines, FL 33029
$-1,419
Cash flow
-9.0%
Cash-on-Cash Return
4.1%
Cap rate
0.6%
Rent to Value Ratio
Active
$775,000
4
bds
|
2
ba
|
1,979
sqft
|
built
1961
6550 SW 8th St, Pembroke Pines, FL 33023
$-2,422
Cash flow
-16.3%
Cash-on-Cash Return
2.4%
Cap rate
0.5%
Rent to Value Ratio
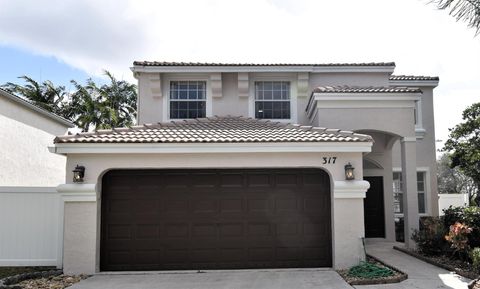
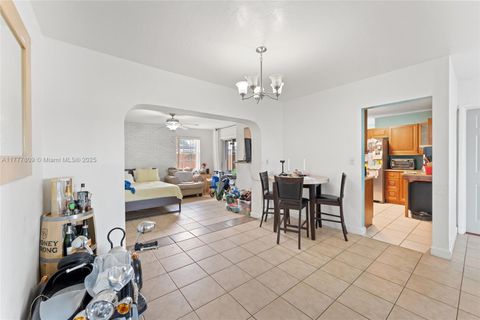
Active
$755,000
4
bds
|
3
ba
|
2,532
sqft
|
built
1999
317 NW 159th Ave, Pembroke Pines, FL 33028
$-1,760
Cash flow
-12.2%
Cash-on-Cash Return
3.3%
Cap rate
0.5%
Rent to Value Ratio

Active
$1,549,795
5
bds
|
5
ba
|
4,046
sqft
|
built
2002
561 Enclave Cir E, Pembroke Pines, FL 33027
$-3,503
Cash flow
-11.8%
Cash-on-Cash Return
3.4%
Cap rate
0.6%
Rent to Value Ratio

Active
$354,000
2
bds
|
2
ba
|
1,158
sqft
|
built
1991
401 SW 158th Ter, Pembroke Pines, FL 33027
$-1,262
Cash flow
-18.6%
Cash-on-Cash Return
1.9%
Cap rate
0.7%
Rent to Value Ratio

Active
$895,000
4
bds
|
3
ba
|
2,314
sqft
|
built
1993
18305 NW 12th St, Pembroke Pines, FL 33029
$-1,577
Cash flow
-9.2%
Cash-on-Cash Return
4.0%
Cap rate
0.6%
Rent to Value Ratio

Active
$660,000
4
bds
|
2
ba
|
1,510
sqft
|
built
1995
17663 SW 5th St, Pembroke Pines, FL 33029
$-1,424
Cash flow
-11.3%
Cash-on-Cash Return
3.6%
Cap rate
0.7%
Rent to Value Ratio
Active
$570,000
3
bds
|
2
ba
|
1,620
sqft
|
built
1960
6930 SW 5th St, Pembroke Pines, FL 33023
$-1,409
Cash flow
-12.9%
Cash-on-Cash Return
3.2%
Cap rate
0.6%
Rent to Value Ratio
Active
$160,000
1
bds
|
2
ba
|
800
sqft
|
built
1974
8900 Washington Blvd, Pembroke Pines, FL 33025
$-462
Cash flow
-15.1%
Cash-on-Cash Return
2.7%
Cap rate
1.3%
Rent to Value Ratio
Active
$155,000
1
bds
|
1
ba
|
684
sqft
|
built
1980
7910 Taft St, Pembroke Pines, FL 33024
$-260
Cash flow
-8.8%
Cash-on-Cash Return
4.1%
Cap rate
1.0%
Rent to Value Ratio

Active
$575,000
3
bds
|
2
ba
|
1,482
sqft
|
built
1994
1601 SW 158th Ave, Pembroke Pines, FL 33027
$-1,637
Cash flow
-14.9%
Cash-on-Cash Return
2.7%
Cap rate
0.6%
Rent to Value Ratio

Active
$639,999
5
bds
|
3
ba
|
2,333
sqft
|
built
1996
10521 SW 13th Ct, Pembroke Pines, FL 33025
$-1,270
Cash flow
-10.4%
Cash-on-Cash Return
3.8%
Cap rate
0.6%
Rent to Value Ratio

Active
$425,900
2
bds
|
2
ba
|
1,060
sqft
|
built
1981
1611 NW 96th Ter, Pembroke Pines, FL 33024
$-1,121
Cash flow
-13.7%
Cash-on-Cash Return
3.0%
Cap rate
0.6%
Rent to Value Ratio
Active
$765,000
3
bds
|
2
ba
|
1,624
sqft
|
built
1990
15218 Wilshire Cir S, Pembroke Pines, FL 33027
$-1,905
Cash flow
-13.0%
Cash-on-Cash Return
3.2%
Cap rate
0.5%
Rent to Value Ratio

Active
$215,000
2
bds
|
2
ba
|
985
sqft
|
built
1989
8734 SW 3rd St, Pembroke Pines, FL 33025
$-400
Cash flow
-9.7%
Cash-on-Cash Return
3.9%
Cap rate
1.1%
Rent to Value Ratio
Active
$924,890
5
bds
|
3
ba
|
3,236
sqft
|
built
1993
18423 NW 9th St, Pembroke Pines, FL 33029
$-2,103
Cash flow
-11.9%
Cash-on-Cash Return
3.4%
Cap rate
0.6%
Rent to Value Ratio
Active
$460,000
2
bds
|
2
ba
|
1,060
sqft
|
built
1981
1530 NW 96th Ave, Pembroke Pines, FL 33024
$0
Cash flow
n/a
Cash-on-Cash Return
n/a
Cap rate
n/a
Rent to Value Ratio
Active
$1,549,000
6
bds
|
5
ba
|
4,766
sqft
|
built
1997
15601 SW 14th St, Pembroke Pines, FL 33027
$-5,255
Cash flow
-17.7%
Cash-on-Cash Return
2.1%
Cap rate
0.5%
Rent to Value Ratio

Active
$1,599,000
4
bds
|
3
ba
|
3,292
sqft
|
built
1992
20160 NW 9th Dr, Pembroke Pines, FL 33029
$-3,155
Cash flow
-10.3%
Cash-on-Cash Return
3.8%
Cap rate
0.6%
Rent to Value Ratio