Pembroke Pines, FL Investment Properties for Sale
Browse homes for sale and investment properties in Pembroke Pines, FL. Refine your search by price, property type, or more.
Best cash flowing properties in Pembroke Pines, FL

Active
$115,000
1
bds
|
2
ba
|
811
sqft
|
built
1984
150 SW 134th Way, Pembroke Pines, FL 33027
$-175
Cash flow
-7.9%
Cash-on-Cash Return
4.3%
Cap rate
1.4%
Rent to Value Ratio

Active
$160,000
2
bds
|
2
ba
|
980
sqft
|
built
1978
1300 Saint Charles Pl, Pembroke Pines, FL 33026
$-307
Cash flow
-10.0%
Cash-on-Cash Return
3.8%
Cap rate
1.3%
Rent to Value Ratio
66 out of 105 properties for sale in Pembroke Pines, FL
Limited Results Shown
Create a free account, or log in to reveal all property listings and enjoy the complete experience.
Active
$235,000
2
bds
|
2
ba
|
1,100
sqft
|
built
1974
661 N University Dr, Pembroke Pines, FL 33024
$-381
Cash flow
-8.5%
Cash-on-Cash Return
4.2%
Cap rate
0.9%
Rent to Value Ratio
Active
$269,900
2
bds
|
2
ba
|
854
sqft
|
built
1987
1791 NW 96th Ter, Pembroke Pines, FL 33024
$-484
Cash flow
-9.4%
Cash-on-Cash Return
4.0%
Cap rate
0.9%
Rent to Value Ratio
Active
$268,900
2
bds
|
2
ba
|
970
sqft
|
built
2001
7820 NW 7th St, Pembroke Pines, FL 33024
$-563
Cash flow
-10.9%
Cash-on-Cash Return
3.6%
Cap rate
0.9%
Rent to Value Ratio

Active
$269,000
2
bds
|
2
ba
|
854
sqft
|
built
1989
2301 NW 96th Ter, Pembroke Pines, FL 33024
$-622
Cash flow
-12.1%
Cash-on-Cash Return
3.4%
Cap rate
0.9%
Rent to Value Ratio
Active
$249,900
2
bds
|
2
ba
|
854
sqft
|
built
1989
2361 NW 96th Ter, Pembroke Pines, FL 33024
$-588
Cash flow
-12.3%
Cash-on-Cash Return
3.3%
Cap rate
0.9%
Rent to Value Ratio
Active
$235,000
2
bds
|
2
ba
|
1,399
sqft
|
built
1992
1501 SW 131st Way, Pembroke Pines, FL 33027
$-308
Cash flow
-6.8%
Cash-on-Cash Return
4.6%
Cap rate
1.1%
Rent to Value Ratio
Active
$165,000
2
bds
|
2
ba
|
953
sqft
|
built
1985
800 SW 131st Ave, Pembroke Pines, FL 33027
$-344
Cash flow
-10.9%
Cash-on-Cash Return
3.6%
Cap rate
1.1%
Rent to Value Ratio
Active
$365,000
3
bds
|
3
ba
|
1,391
sqft
|
built
2003
10653 SW 8th St, Pembroke Pines, FL 33025
$-900
Cash flow
-12.9%
Cash-on-Cash Return
3.2%
Cap rate
0.7%
Rent to Value Ratio
Active
$255,000
2
bds
|
2
ba
|
854
sqft
|
built
1989
2331 NW 96th Ter, Pembroke Pines, FL 33024
$-345
Cash flow
-7.1%
Cash-on-Cash Return
4.5%
Cap rate
0.9%
Rent to Value Ratio
Active
$275,000
2
bds
|
2
ba
|
1,065
sqft
|
built
2007
11185 SW 6th St, Pembroke Pines, FL 33025
$-830
Cash flow
-15.7%
Cash-on-Cash Return
2.5%
Cap rate
0.8%
Rent to Value Ratio
Active
$333,000
2
bds
|
2
ba
|
1,250
sqft
|
built
1992
301 SW 158th Ter, Pembroke Pines, FL 33027
$-851
Cash flow
-13.3%
Cash-on-Cash Return
3.1%
Cap rate
0.8%
Rent to Value Ratio
Active
$260,000
2
bds
|
2
ba
|
1,037
sqft
|
built
1989
1250 SW 113th Ter, Pembroke Pines, FL 33025
$-670
Cash flow
-13.4%
Cash-on-Cash Return
3.1%
Cap rate
0.9%
Rent to Value Ratio
Active
$285,000
2
bds
|
2
ba
|
900
sqft
|
built
1971
14901 SW 4th St, Pembroke Pines, FL 33027
$-497
Cash flow
-9.1%
Cash-on-Cash Return
4.1%
Cap rate
0.8%
Rent to Value Ratio

Active
$349,900
2
bds
|
2
ba
|
1,040
sqft
|
built
2013
14745 SW 9th St, Pembroke Pines, FL 33027
$-1,330
Cash flow
-19.8%
Cash-on-Cash Return
1.6%
Cap rate
0.7%
Rent to Value Ratio
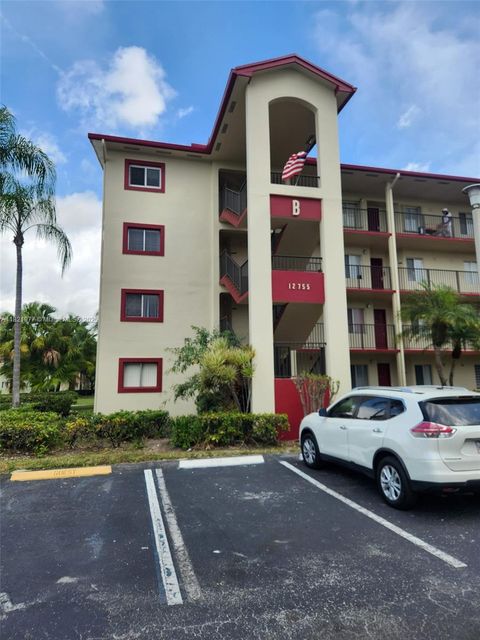
Active
$250,000
2
bds
|
2
ba
|
1,300
sqft
|
built
1993
12755 SW 16th Ct, Pembroke Pines, FL 33027
$-515
Cash flow
-10.7%
Cash-on-Cash Return
3.7%
Cap rate
1.0%
Rent to Value Ratio
Active
$264,000
2
bds
|
1
ba
|
881
sqft
|
built
1990
251 Palm Cir W, Pembroke Pines, FL 33025
$-409
Cash flow
-8.1%
Cash-on-Cash Return
4.3%
Cap rate
0.9%
Rent to Value Ratio
Active
$290,000
2
bds
|
2
ba
|
806
sqft
|
built
1985
10624 NW 10th St, Pembroke Pines, FL 33026
$-655
Cash flow
-11.8%
Cash-on-Cash Return
3.4%
Cap rate
0.8%
Rent to Value Ratio
Active
$185,000
1
bds
|
2
ba
|
702
sqft
|
built
1985
1401 SW 134th Way, Pembroke Pines, FL 33027
$-379
Cash flow
-10.7%
Cash-on-Cash Return
3.7%
Cap rate
1.1%
Rent to Value Ratio
Active
$359,900
2
bds
|
3
ba
|
1,214
sqft
|
built
1981
9880 NW 15th St, Pembroke Pines, FL 33024
$-1,042
Cash flow
-15.1%
Cash-on-Cash Return
2.7%
Cap rate
0.7%
Rent to Value Ratio
Active
$200,000
1
bds
|
1
ba
|
752
sqft
|
built
1973
2050 N Douglas Rd, Pembroke Pines, FL 33028
$-325
Cash flow
-8.5%
Cash-on-Cash Return
4.2%
Cap rate
0.9%
Rent to Value Ratio

Active
$279,999
2
bds
|
2
ba
|
854
sqft
|
built
1987
1881 NW 96th Ter, Pembroke Pines, FL 33024
$-713
Cash flow
-13.3%
Cash-on-Cash Return
3.1%
Cap rate
0.8%
Rent to Value Ratio

Active
$228,000
1
bds
|
1
ba
|
628
sqft
|
built
1987
2151 NW 96th Ter, Pembroke Pines, FL 33024
$-629
Cash flow
-14.4%
Cash-on-Cash Return
2.8%
Cap rate
0.8%
Rent to Value Ratio
Active
$315,000
2
bds
|
2
ba
|
1,205
sqft
|
built
1984
11318 Taft St, Pembroke Pines, FL 33026
$-969
Cash flow
-16.0%
Cash-on-Cash Return
2.5%
Cap rate
0.7%
Rent to Value Ratio

Active
$119,900
1
bds
|
2
ba
|
900
sqft
|
built
1973
9823 S Hollybrook Lake Dr, Pembroke Pines, FL 33025
$-363
Cash flow
-15.8%
Cash-on-Cash Return
2.5%
Cap rate
1.4%
Rent to Value Ratio

Active
$265,000
1
bds
|
1
ba
|
843
sqft
|
built
1989
11201 SW 13th St, Pembroke Pines, FL 33025
$-780
Cash flow
-15.4%
Cash-on-Cash Return
2.6%
Cap rate
0.8%
Rent to Value Ratio
Active
$379,900
3
bds
|
3
ba
|
1,472
sqft
|
built
1979
1541 NW 92nd Ave, Pembroke Pines, FL 33024
$-1,022
Cash flow
-14.0%
Cash-on-Cash Return
2.9%
Cap rate
0.8%
Rent to Value Ratio

Active
$245,000
1
bds
|
1
ba
|
610
sqft
|
built
1991
805 NW 108th Ter, Pembroke Pines, FL 33026
$-841
Cash flow
-17.9%
Cash-on-Cash Return
2.0%
Cap rate
0.7%
Rent to Value Ratio
Active
$379,000
3
bds
|
3
ba
|
1,472
sqft
|
built
1980
1150 NW 99th Ave, Pembroke Pines, FL 33024
$-687
Cash flow
-9.5%
Cash-on-Cash Return
4.0%
Cap rate
0.8%
Rent to Value Ratio

Active
$255,000
2
bds
|
2
ba
|
806
sqft
|
built
1986
1124 NW 106th Ter, Pembroke Pines, FL 33026
$-596
Cash flow
-12.2%
Cash-on-Cash Return
3.3%
Cap rate
0.9%
Rent to Value Ratio
Active
$285,000
1
bds
|
1
ba
|
713
sqft
|
built
1998
151 SW 117th Ave, Pembroke Pines, FL 33025
$-736
Cash flow
-13.5%
Cash-on-Cash Return
3.0%
Cap rate
0.7%
Rent to Value Ratio
Active
$327,500
2
bds
|
2
ba
|
978
sqft
|
built
1988
530 SW 113th Way, Pembroke Pines, FL 33025
$-874
Cash flow
-13.9%
Cash-on-Cash Return
2.9%
Cap rate
0.7%
Rent to Value Ratio
Active
$275,000
2
bds
|
2
ba
|
806
sqft
|
built
1985
940 NW 106th Ter, Pembroke Pines, FL 33026
$-699
Cash flow
-13.3%
Cash-on-Cash Return
3.1%
Cap rate
0.8%
Rent to Value Ratio
Active
$315,000
3
bds
|
2
ba
|
1,093
sqft
|
built
1987
2151 NW 96th Ter, Pembroke Pines, FL 33024
$-881
Cash flow
-14.6%
Cash-on-Cash Return
2.8%
Cap rate
0.8%
Rent to Value Ratio

Active
$269,500
2
bds
|
1
ba
|
881
sqft
|
built
1990
200 Palm Cir W, Pembroke Pines, FL 33025
$-517
Cash flow
-10.0%
Cash-on-Cash Return
3.8%
Cap rate
0.8%
Rent to Value Ratio

Active
$159,000
1
bds
|
2
ba
|
773
sqft
|
built
1980
901 Colony Point Cir, Pembroke Pines, FL 33026
$-391
Cash flow
-12.8%
Cash-on-Cash Return
3.2%
Cap rate
1.0%
Rent to Value Ratio

Active
$320,000
3
bds
|
2
ba
|
1,100
sqft
|
built
1984
1100 N Hiatus Rd, Pembroke Pines, FL 33026
$-970
Cash flow
-15.8%
Cash-on-Cash Return
2.5%
Cap rate
0.8%
Rent to Value Ratio

Active
$350,000
2
bds
|
2
ba
|
1,130
sqft
|
built
1998
11631 SW 2nd St, Pembroke Pines, FL 33025
$-1,089
Cash flow
-16.2%
Cash-on-Cash Return
2.4%
Cap rate
0.7%
Rent to Value Ratio

Active
$199,000
2
bds
|
2
ba
|
985
sqft
|
built
1989
8734 SW 3rd St, Pembroke Pines, FL 33025
$-318
Cash flow
-8.3%
Cash-on-Cash Return
4.2%
Cap rate
1.2%
Rent to Value Ratio