Pembroke Pines, FL Investment Properties for Sale
Browse homes for sale and investment properties in Pembroke Pines, FL. Refine your search by price, property type, or more.
Best cash flowing properties in Pembroke Pines, FL
Active
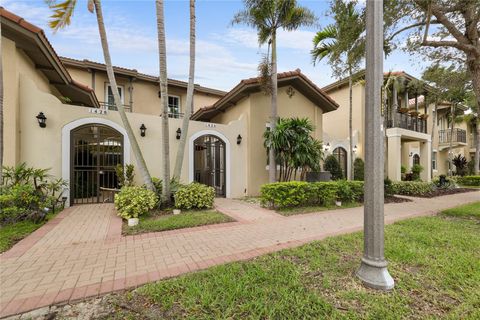
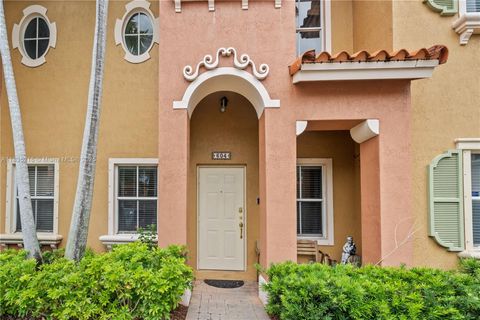
$599,999
4
bds
|
3
ba
|
1,817
sqft
|
built
2013
1424 SW 147th Ave, Pembroke Pines, FL 33027
$0
Cash flow
n/a
Cash-on-Cash Return
n/a
Cap rate
n/a
Rent to Value Ratio

Active
$449,999
2
bds
|
3
ba
|
1,338
sqft
|
built
1998
12006 SW 2nd St, Pembroke Pines, FL 33025
$-421
Cash flow
-4.9%
Cash-on-Cash Return
5.0%
Cap rate
0.7%
Rent to Value Ratio
51 out of 119 properties for sale in Pembroke Pines, FL
Limited Results Shown
Create a free account, or log in to reveal all property listings and enjoy the complete experience.

Active
$469,718
3
bds
|
3
ba
|
1,686
sqft
|
built
1977
1111 Windward Dr, Pembroke Pines, FL 33026
$-622
Cash flow
-6.9%
Cash-on-Cash Return
4.6%
Cap rate
0.7%
Rent to Value Ratio

Active
$427,500
2
bds
|
3
ba
|
1,482
sqft
|
built
1979
11291 NW 16th Ct, Pembroke Pines, FL 33026
$-1,039
Cash flow
-12.7%
Cash-on-Cash Return
3.2%
Cap rate
0.7%
Rent to Value Ratio
Active
$369,000
2
bds
|
3
ba
|
1,170
sqft
|
built
2003
604 SW 107th Ave, Pembroke Pines, FL 33025
$-894
Cash flow
-12.6%
Cash-on-Cash Return
3.2%
Cap rate
0.7%
Rent to Value Ratio
Active
$495,000
3
bds
|
3
ba
|
1,588
sqft
|
built
1985
1239 NW 122nd Ter, Pembroke Pines, FL 33026
$-1,136
Cash flow
-12.0%
Cash-on-Cash Return
3.4%
Cap rate
0.6%
Rent to Value Ratio
Active
$550,000
3
bds
|
2
ba
|
1,356
sqft
|
built
1993
17253 NW 6th Ct, Pembroke Pines, FL 33029
$-1,563
Cash flow
-14.8%
Cash-on-Cash Return
2.7%
Cap rate
0.6%
Rent to Value Ratio
Active
$275,000
2
bds
|
3
ba
|
1,214
sqft
|
built
1980
1270 NW 99th Ave, Pembroke Pines, FL 33024
$-756
Cash flow
-14.3%
Cash-on-Cash Return
2.8%
Cap rate
0.9%
Rent to Value Ratio
Active
$460,000
4
bds
|
3
ba
|
1,524
sqft
|
built
1987
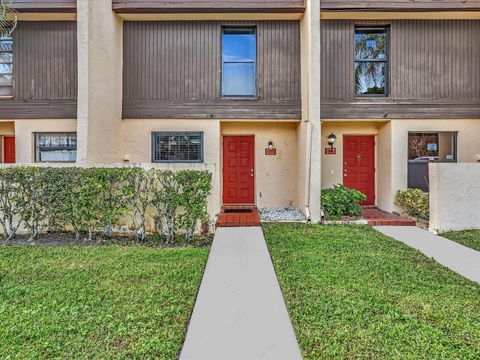
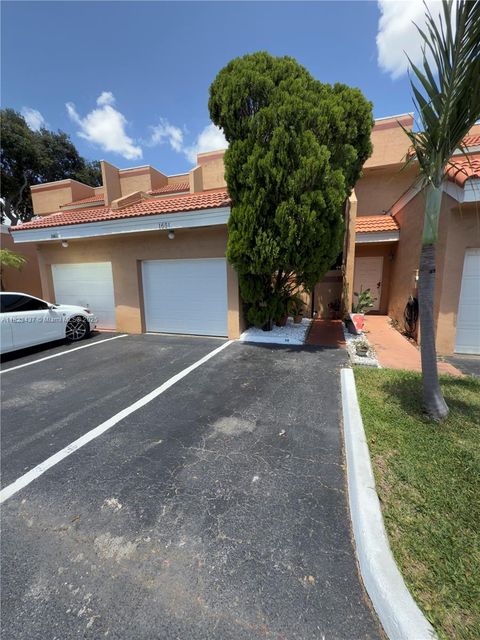
1651 SW 120th Ave, Pembroke Pines, FL 33025
$-665
Cash flow
-7.5%
Cash-on-Cash Return
4.4%
Cap rate
0.7%
Rent to Value Ratio
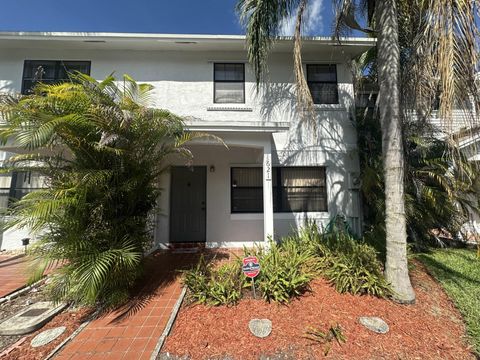
Active
$365,000
2
bds
|
3
ba
|
1,224
sqft
|
built
1987
621 NW 105th Way, Pembroke Pines, FL 33026
$-1,144
Cash flow
-16.4%
Cash-on-Cash Return
2.4%
Cap rate
0.7%
Rent to Value Ratio

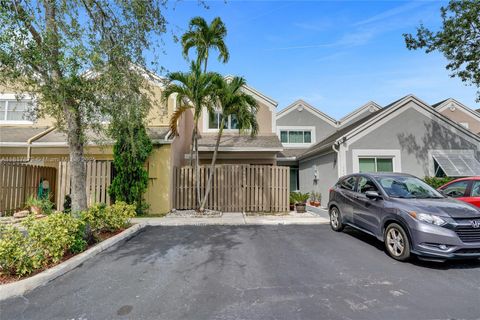
Active
$458,500
3
bds
|
3
ba
|
1,686
sqft
|
built
1978
11040 S Lakeview Dr, Pembroke Pines, FL 33026
$-1,705
Cash flow
-19.4%
Cash-on-Cash Return
1.7%
Cap rate
0.7%
Rent to Value Ratio
Active
$426,000
2
bds
|
3
ba
|
1,348
sqft
|
built
1987
1449 NW 122nd Ter, Pembroke Pines, FL 33026
$-1,004
Cash flow
-12.3%
Cash-on-Cash Return
3.3%
Cap rate
0.7%
Rent to Value Ratio
Active
$499,000
3
bds
|
3
ba
|
1,802
sqft
|
built
1986
1325 NW 123rd Ter, Pembroke Pines, FL 33026
$-846
Cash flow
-8.8%
Cash-on-Cash Return
4.1%
Cap rate
0.7%
Rent to Value Ratio

Active
$474,000
3
bds
|
3
ba
|
1,738
sqft
|
built
2001
1968 NW 79th Way, Pembroke Pines, FL 33024
$-1,289
Cash flow
-14.2%
Cash-on-Cash Return
2.9%
Cap rate
0.7%
Rent to Value Ratio

Active
$450,000
2
bds
|
3
ba
|
1,570
sqft
|
built
1992
10875 NW 8th St, Pembroke Pines, FL 33026
$-1,135
Cash flow
-13.2%
Cash-on-Cash Return
3.1%
Cap rate
0.6%
Rent to Value Ratio

Active
$464,989
3
bds
|
2
ba
|
1,361
sqft
|
built
1998
20865 NW 3rd Ln, Pembroke Pines, FL 33029
$-950
Cash flow
-10.7%
Cash-on-Cash Return
3.7%
Cap rate
0.6%
Rent to Value Ratio
Active
$480,000
3
bds
|
3
ba
|
1,584
sqft
|
built
2001
1114 NW 100th Ave, Pembroke Pines, FL 33024
$-1,273
Cash flow
-13.8%
Cash-on-Cash Return
3.0%
Cap rate
0.6%
Rent to Value Ratio
Active
$470,000
3
bds
|
3
ba
|
1,361
sqft
|
built
1998
20816 NW 2nd St, Pembroke Pines, FL 33029
$-1,333
Cash flow
-14.8%
Cash-on-Cash Return
2.7%
Cap rate
0.6%
Rent to Value Ratio
Active
$404,999
2
bds
|
3
ba
|
1,260
sqft
|
built
1985
10428 NW 3rd St, Pembroke Pines, FL 33026
$-931
Cash flow
-12.0%
Cash-on-Cash Return
3.4%
Cap rate
0.6%
Rent to Value Ratio

Active
$490,000
3
bds
|
3
ba
|
1,379
sqft
|
built
2009
1083 SW 143rd Ave, Pembroke Pines, FL 33027
$-1,488
Cash flow
-15.8%
Cash-on-Cash Return
2.5%
Cap rate
0.6%
Rent to Value Ratio
Active
$519,999
2
bds
|
2
ba
|
1,264
sqft
|
built
2001
801 NW 130th Ave, Pembroke Pines, FL 33028
$-1,069
Cash flow
-10.7%
Cash-on-Cash Return
3.7%
Cap rate
0.6%
Rent to Value Ratio

Active
$435,000
2
bds
|
2
ba
|
1,196
sqft
|
built
1977
10760 Hickory Ave, Pembroke Pines, FL 33026
$-884
Cash flow
-10.6%
Cash-on-Cash Return
3.7%
Cap rate
0.6%
Rent to Value Ratio

Active
$365,000
2
bds
|
2
ba
|
1,017
sqft
|
built
1985
11604 NW 11th St, Pembroke Pines, FL 33026
$-1,109
Cash flow
-15.9%
Cash-on-Cash Return
2.5%
Cap rate
0.6%
Rent to Value Ratio
Active
$440,000
3
bds
|
3
ba
|
1,361
sqft
|
built
1998
20866 NW 3rd Ln, Pembroke Pines, FL 33029
$-949
Cash flow
-11.3%
Cash-on-Cash Return
3.6%
Cap rate
0.7%
Rent to Value Ratio

Active
$379,900
4
bds
|
3
ba
|
1,616
sqft
|
built
1979
1551 NW 92nd Ave, Pembroke Pines, FL 33024
$-1,057
Cash flow
-14.5%
Cash-on-Cash Return
2.8%
Cap rate
0.7%
Rent to Value Ratio

Active
$565,000
3
bds
|
3
ba
|
1,719
sqft
|
built
1997
1437 NW 154th Ln, Pembroke Pines, FL 33028
$-1,373
Cash flow
-12.7%
Cash-on-Cash Return
3.2%
Cap rate
0.6%
Rent to Value Ratio

Active
$439,900
2
bds
|
3
ba
|
1,420
sqft
|
built
2006
531 SW 147th Ave, Pembroke Pines, FL 33027
$-1,068
Cash flow
-12.7%
Cash-on-Cash Return
3.2%
Cap rate
0.7%
Rent to Value Ratio

Active
$454,999
3
bds
|
3
ba
|
1,635
sqft
|
built
1991
10854 NW 8th St, Pembroke Pines, FL 33026
$-755
Cash flow
-8.7%
Cash-on-Cash Return
4.2%
Cap rate
0.7%
Rent to Value Ratio
Active
$319,000
3
bds
|
3
ba
|
1,472
sqft
|
built
1979
9220 NW 14th St, Pembroke Pines, FL 33024
$-1,039
Cash flow
-17.0%
Cash-on-Cash Return
2.2%
Cap rate
0.9%
Rent to Value Ratio

Active
$679,000
4
bds
|
4
ba
|
2,816
sqft
|
built
2017
12448 NW 17th Mnr, Pembroke Pines, FL 33028
$-2,079
Cash flow
-16.0%
Cash-on-Cash Return
2.5%
Cap rate
0.6%
Rent to Value Ratio

Active
$460,000
3
bds
|
3
ba
|
1,268
sqft
|
built
1987
11733 NW 11th St, Pembroke Pines, FL 33026
$-1,103
Cash flow
-12.5%
Cash-on-Cash Return
3.3%
Cap rate
0.6%
Rent to Value Ratio
Active
$413,000
2
bds
|
3
ba
|
1,226
sqft
|
built
1995
2405 NW 97th Ter, Pembroke Pines, FL 33024
$-855
Cash flow
-10.8%
Cash-on-Cash Return
3.7%
Cap rate
0.7%
Rent to Value Ratio

Active
$314,999
2
bds
|
2
ba
|
1,080
sqft
|
built
1979
9401 NW 14th Ct, Pembroke Pines, FL 33024
$-695
Cash flow
-11.5%
Cash-on-Cash Return
3.5%
Cap rate
0.8%
Rent to Value Ratio

Active
$429,000
2
bds
|
2
ba
|
1,196
sqft
|
built
1980
10110 Acorn Ln, Pembroke Pines, FL 33026
$-700
Cash flow
-8.5%
Cash-on-Cash Return
4.2%
Cap rate
0.7%
Rent to Value Ratio

Active
$400,000
2
bds
|
2
ba
|
972
sqft
|
built
1987
11657 NW 11th St, Pembroke Pines, FL 33026
$-1,027
Cash flow
-13.4%
Cash-on-Cash Return
3.1%
Cap rate
0.6%
Rent to Value Ratio

Active
$485,000
3
bds
|
3
ba
|
1,698
sqft
|
built
1987
11282 SW 9th Ct, Pembroke Pines, FL 33025
$-941
Cash flow
-10.1%
Cash-on-Cash Return
3.8%
Cap rate
0.6%
Rent to Value Ratio
Active
$399,000
2
bds
|
3
ba
|
1,660
sqft
|
built
2015
948 SW 147th Ave, Pembroke Pines, FL 33027
$-763
Cash flow
-10.0%
Cash-on-Cash Return
3.9%
Cap rate
0.7%
Rent to Value Ratio

Active
$355,000
2
bds
|
2
ba
|
1,048
sqft
|
built
2015
964 SW 147th Ave, Pembroke Pines, FL 33027
$-656
Cash flow
-9.6%
Cash-on-Cash Return
3.9%
Cap rate
0.7%
Rent to Value Ratio

Active
$690,000
4
bds
|
3
ba
|
1,888
sqft
|
built
2023
238 SW 159th Ct, Pembroke Pines, FL 33027
$-1,743
Cash flow
-13.2%
Cash-on-Cash Return
3.1%
Cap rate
0.6%
Rent to Value Ratio
Active
$420,000
2
bds
|
3
ba
|
1,226
sqft
|
built
1995
2412 NW 97th Way, Pembroke Pines, FL 33024
$-727
Cash flow
-9.0%
Cash-on-Cash Return
4.1%
Cap rate
0.7%
Rent to Value Ratio