Pembroke Pines, FL Investment Properties for Sale
Browse homes for sale and investment properties in Pembroke Pines, FL. Refine your search by price, property type, or more.
Best cash flowing properties in Pembroke Pines, FL
Active
$235,900
2
bds
|
2
ba
|
1,100
sqft
|
built
1974
661 N University Dr, Pembroke Pines, FL 33024
$-381
Cash flow
-8.4%
Cash-on-Cash Return
4.2%
Cap rate
0.8%
Rent to Value Ratio

Active
$199,000
1
bds
|
2
ba
|
805
sqft
|
built
1989
365 SW 86th Ave, Pembroke Pines, FL 33025
$-418
Cash flow
-11.0%
Cash-on-Cash Return
3.6%
Cap rate
1.0%
Rent to Value Ratio
508 out of 561 properties for sale in Pembroke Pines, FL
Limited Results Shown
Create a free account, or log in to reveal all property listings and enjoy the complete experience.

Active
$544,900
3
bds
|
2
ba
|
1,209
sqft
|
built
1969
8621 NW 15th Ct, Pembroke Pines, FL 33024
$-1,836
Cash flow
-17.6%
Cash-on-Cash Return
2.1%
Cap rate
0.4%
Rent to Value Ratio

Active
$849,900
5
bds
|
3
ba
|
2,998
sqft
|
built
1998
1560 NW 159th Ave, Pembroke Pines, FL 33028
$-1,598
Cash flow
-9.8%
Cash-on-Cash Return
3.9%
Cap rate
0.6%
Rent to Value Ratio
Active
$310,000
2
bds
|
2
ba
|
1,112
sqft
|
built
1989
1250 SW 113th Ter, Pembroke Pines, FL 33025
$-958
Cash flow
-16.1%
Cash-on-Cash Return
2.4%
Cap rate
0.7%
Rent to Value Ratio
Active
$275,000
2
bds
|
2
ba
|
970
sqft
|
built
2002
630 NW 79th Ter, Pembroke Pines, FL 33024
$-664
Cash flow
-12.6%
Cash-on-Cash Return
3.3%
Cap rate
0.8%
Rent to Value Ratio
Active
$594,950
3
bds
|
2
ba
|
1,961
sqft
|
built
1995
10327 SW 16th St, Pembroke Pines, FL 33025
$-1,051
Cash flow
-9.2%
Cash-on-Cash Return
4.0%
Cap rate
0.6%
Rent to Value Ratio

Active
$562,500
3
bds
|
2
ba
|
1,768
sqft
|
built
1997
1955 NW 100th Ave, Pembroke Pines, FL 33024
$-1,616
Cash flow
-15.0%
Cash-on-Cash Return
2.7%
Cap rate
0.6%
Rent to Value Ratio
Active
$1,150,000
4
bds
|
3
ba
|
2,320
sqft
|
built
2012
8328 NW 26th Ct, Pembroke Pines, FL 33024
$-3,255
Cash flow
-14.8%
Cash-on-Cash Return
2.8%
Cap rate
0.6%
Rent to Value Ratio
Active
$874,900
4
bds
|
3
ba
|
2,655
sqft
|
built
1994
1311 NW 193rd Ave, Pembroke Pines, FL 33029
$-1,657
Cash flow
-9.9%
Cash-on-Cash Return
3.9%
Cap rate
0.6%
Rent to Value Ratio
Active
$534,900
3
bds
|
2
ba
|
1,831
sqft
|
built
2001
7752 NW 18th St, Pembroke Pines, FL 33024
$-1,626
Cash flow
-15.9%
Cash-on-Cash Return
2.5%
Cap rate
0.5%
Rent to Value Ratio
Active
$320,000
2
bds
|
2
ba
|
980
sqft
|
built
1984
11344 Taft St, Pembroke Pines, FL 33026
$-994
Cash flow
-16.2%
Cash-on-Cash Return
2.4%
Cap rate
0.7%
Rent to Value Ratio
Active
$555,000
3
bds
|
3
ba
|
1,731
sqft
|
built
1992
381 NW 102nd Ter, Pembroke Pines, FL 33026
$-1,043
Cash flow
-9.8%
Cash-on-Cash Return
3.9%
Cap rate
0.6%
Rent to Value Ratio
Active
$655,900
3
bds
|
2
ba
|
1,370
sqft
|
built
1982
8421 NW 8th St, Pembroke Pines, FL 33024
$-1,606
Cash flow
-12.8%
Cash-on-Cash Return
3.2%
Cap rate
0.5%
Rent to Value Ratio

Active
$795,000
5
bds
|
4
ba
|
2,604
sqft
|
built
2000
1541 SW 190th Ave, Pembroke Pines, FL 33029
$-1,809
Cash flow
-11.9%
Cash-on-Cash Return
3.4%
Cap rate
0.6%
Rent to Value Ratio
Active
$615,000
3
bds
|
2
ba
|
1,663
sqft
|
built
1997
251 SW 203rd Ave, Pembroke Pines, FL 33029
$-1,679
Cash flow
-14.2%
Cash-on-Cash Return
2.9%
Cap rate
0.5%
Rent to Value Ratio
Active
$235,900
2
bds
|
2
ba
|
1,100
sqft
|
built
1974
661 N University Dr, Pembroke Pines, FL 33024
$-381
Cash flow
-8.4%
Cash-on-Cash Return
4.2%
Cap rate
0.8%
Rent to Value Ratio
Active
$199,000
1
bds
|
2
ba
|
805
sqft
|
built
1989
365 SW 86th Ave, Pembroke Pines, FL 33025
$-418
Cash flow
-11.0%
Cash-on-Cash Return
3.6%
Cap rate
1.0%
Rent to Value Ratio
Active
$639,000
3
bds
|
3
ba
|
1,778
sqft
|
built
1996
15319 NW 7th St, Pembroke Pines, FL 33028
$-1,333
Cash flow
-10.9%
Cash-on-Cash Return
3.6%
Cap rate
0.5%
Rent to Value Ratio
Active
$365,000
2
bds
|
2
ba
|
1,040
sqft
|
built
2007
433 SW 147th Ave, Pembroke Pines, FL 33027
$-1,268
Cash flow
-18.1%
Cash-on-Cash Return
2.0%
Cap rate
0.7%
Rent to Value Ratio

Active
$645,000
3
bds
|
3
ba
|
1,848
sqft
|
built
1991
381 NW 207th Ave, Pembroke Pines, FL 33029
$-1,196
Cash flow
-9.7%
Cash-on-Cash Return
3.9%
Cap rate
0.7%
Rent to Value Ratio

Active
$599,000
3
bds
|
3
ba
|
1,938
sqft
|
built
2000
7558 NW 17th Dr, Pembroke Pines, FL 33024
$-1,437
Cash flow
-12.5%
Cash-on-Cash Return
3.3%
Cap rate
0.6%
Rent to Value Ratio

Active
$240,000
2
bds
|
2
ba
|
1,192
sqft
|
built
1987
1501 SW 134th Way, Pembroke Pines, FL 33027
$-512
Cash flow
-11.1%
Cash-on-Cash Return
3.6%
Cap rate
0.9%
Rent to Value Ratio

Active
$689,990
4
bds
|
2
ba
|
2,174
sqft
|
built
2002
7314 NW 19th Ct, Pembroke Pines, FL 33024
$-2,093
Cash flow
-15.8%
Cash-on-Cash Return
2.5%
Cap rate
0.6%
Rent to Value Ratio
Active
$475,718
3
bds
|
3
ba
|
1,686
sqft
|
built
1977
1111 Windward Dr, Pembroke Pines, FL 33026
$-653
Cash flow
-7.2%
Cash-on-Cash Return
4.5%
Cap rate
0.7%
Rent to Value Ratio
Active
$535,000
3
bds
|
2
ba
|
1,480
sqft
|
built
1991
162 NW 207th Ave, Pembroke Pines, FL 33029
$-1,029
Cash flow
-10.0%
Cash-on-Cash Return
3.8%
Cap rate
0.7%
Rent to Value Ratio

Active
$697,000
4
bds
|
3
ba
|
2,488
sqft
|
built
1998
15868 NW 4th St, Pembroke Pines, FL 33028
$-1,376
Cash flow
-10.3%
Cash-on-Cash Return
3.8%
Cap rate
0.7%
Rent to Value Ratio
Active
$265,000
2
bds
|
2
ba
|
880
sqft
|
built
1985
11537 NW 10th St, Pembroke Pines, FL 33026
$-799
Cash flow
-15.7%
Cash-on-Cash Return
2.5%
Cap rate
0.9%
Rent to Value Ratio

Active
$489,999
3
bds
|
4
ba
|
1,817
sqft
|
built
2015
946 SW 147th Ave, Pembroke Pines, FL 33027
$-1,780
Cash flow
-19.0%
Cash-on-Cash Return
1.8%
Cap rate
0.6%
Rent to Value Ratio
Active
$279,000
2
bds
|
2
ba
|
790
sqft
|
built
1984
151 NW 93rd Ave, Pembroke Pines, FL 33024
$-795
Cash flow
-14.9%
Cash-on-Cash Return
2.7%
Cap rate
0.7%
Rent to Value Ratio
Active
$694,000
4
bds
|
3
ba
|
2,087
sqft
|
built
1998
15343 NW 14th Rd, Pembroke Pines, FL 33028
$-1,583
Cash flow
-11.9%
Cash-on-Cash Return
3.4%
Cap rate
0.5%
Rent to Value Ratio
Active
$729,000
3
bds
|
3
ba
|
1,935
sqft
|
built
1990
1071 SW 101st Ter, Pembroke Pines, FL 33025
$-1,864
Cash flow
-13.3%
Cash-on-Cash Return
3.1%
Cap rate
0.5%
Rent to Value Ratio
Active
$721,900
4
bds
|
3
ba
|
2,512
sqft
|
built
2001
1858 NW 74th Way, Pembroke Pines, FL 33024
$-2,694
Cash flow
-19.5%
Cash-on-Cash Return
1.7%
Cap rate
0.4%
Rent to Value Ratio
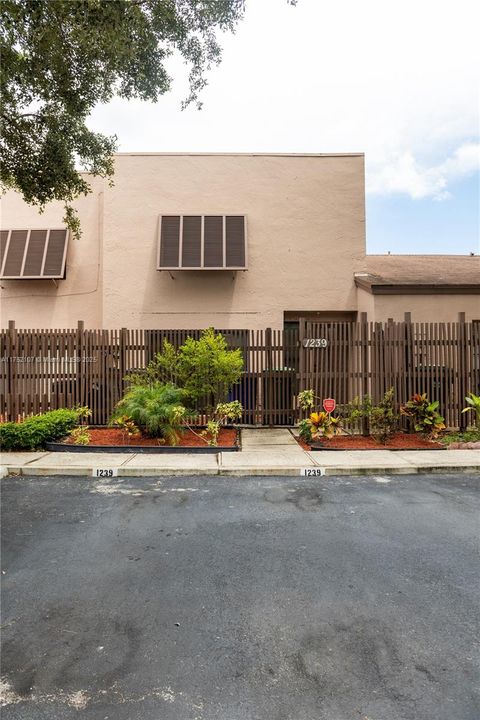
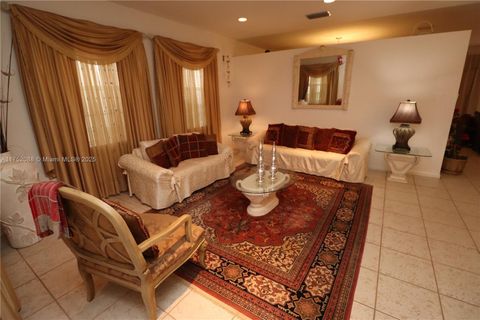
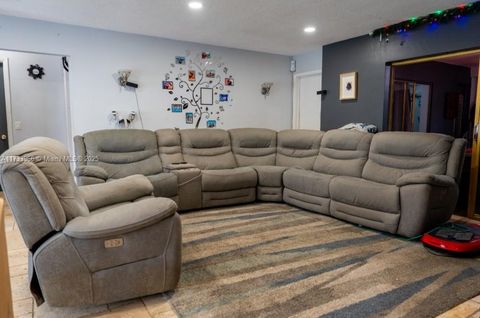
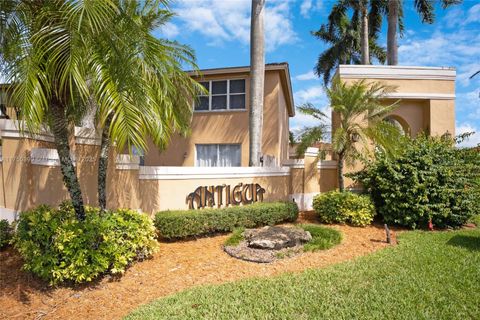
Active
$495,000
3
bds
|
3
ba
|
1,588
sqft
|
built
1985
1239 NW 122nd Ter, Pembroke Pines, FL 33026
$-1,136
Cash flow
-12.0%
Cash-on-Cash Return
3.4%
Cap rate
0.6%
Rent to Value Ratio
Active
$687,000
4
bds
|
3
ba
|
2,488
sqft
|
built
1998
15719 NW 4th St, Pembroke Pines, FL 33028
$-1,378
Cash flow
-10.5%
Cash-on-Cash Return
3.7%
Cap rate
0.6%
Rent to Value Ratio

Active
$530,000
3
bds
|
2
ba
|
1,612
sqft
|
built
1960
6880 SW 5th Ct, Pembroke Pines, FL 33023
$-1,047
Cash flow
-10.3%
Cash-on-Cash Return
3.8%
Cap rate
0.7%
Rent to Value Ratio

Active
$649,999
3
bds
|
4
ba
|
2,078
sqft
|
built
2018
11558 SW 13th Ct, Pembroke Pines, FL 33025
$-1,751
Cash flow
-14.1%
Cash-on-Cash Return
2.9%
Cap rate
0.6%
Rent to Value Ratio
Active
$625,000
3
bds
|
2
ba
|
1,927
sqft
|
built
1967
650 SW 68th Ave, Pembroke Pines, FL 33023
$-1,749
Cash flow
-14.6%
Cash-on-Cash Return
2.8%
Cap rate
0.5%
Rent to Value Ratio
Active
$503,999
3
bds
|
3
ba
|
1,467
sqft
|
built
2000
886 NW 135th Ter, Pembroke Pines, FL 33028
$-1,330
Cash flow
-13.8%
Cash-on-Cash Return
3.0%
Cap rate
0.6%
Rent to Value Ratio
Active
$835,000
4
bds
|
3
ba
|
2,392
sqft
|
built
1996
18840 NW 23rd Pl, Pembroke Pines, FL 33029
$-1,866
Cash flow
-11.7%
Cash-on-Cash Return
3.5%
Cap rate
0.6%
Rent to Value Ratio
Active
$640,000
3
bds
|
3
ba
|
1,778
sqft
|
built
1996
15181 NW 6th Ct, Pembroke Pines, FL 33028
$-1,345
Cash flow
-11.0%
Cash-on-Cash Return
3.6%
Cap rate
0.5%
Rent to Value Ratio

Active
$1,100,000
4
bds
|
3
ba
|
2,720
sqft
|
built
2012
4038 NW 85th Ave, Pembroke Pines, FL 33024
$-3,256
Cash flow
-15.4%
Cash-on-Cash Return
2.6%
Cap rate
0.5%
Rent to Value Ratio