Pembroke Pines, FL Investment Properties for Sale
Browse homes for sale and investment properties in Pembroke Pines, FL. Refine your search by price, property type, or more.
Best cash flowing properties in Pembroke Pines, FL

Active
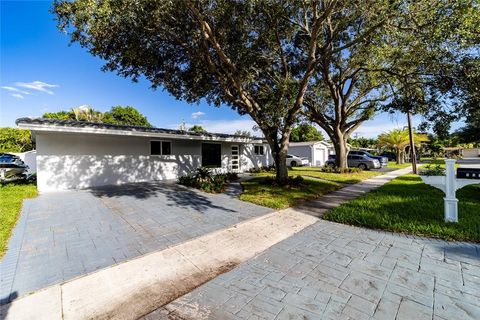
$585,000
5
bds
|
2
ba
|
2,176
sqft
|
built
1964
521 SW 68th Ter, Pembroke Pines, FL 33023
$-237
Cash flow
-2.1%
Cash-on-Cash Return
5.7%
Cap rate
0.7%
Rent to Value Ratio
Active
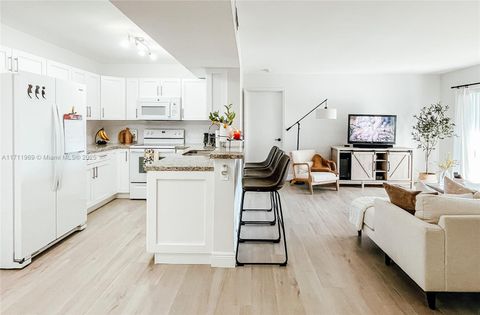
$183,250
2
bds
|
1
ba
|
770
sqft
|
built
1989
333 SW 86th Ave, Pembroke Pines, FL 33025
$-303
Cash flow
-8.6%
Cash-on-Cash Return
4.2%
Cap rate
1.1%
Rent to Value Ratio
508 out of 561 properties for sale in Pembroke Pines, FL
Limited Results Shown
Create a free account, or log in to reveal all property listings and enjoy the complete experience.
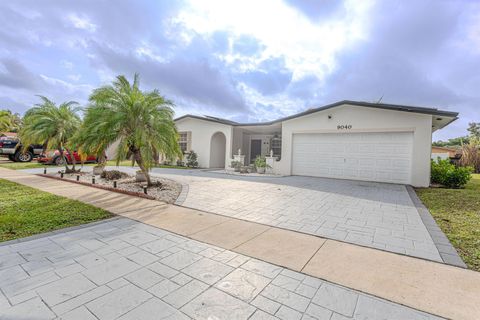
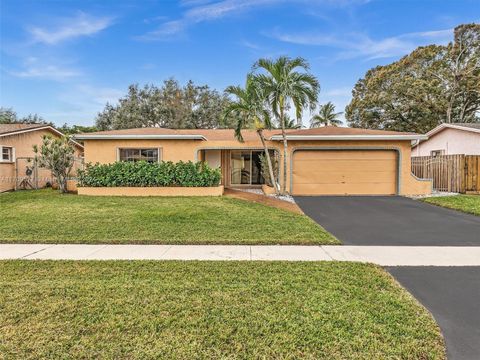
Active
$725,000
4
bds
|
2
ba
|
2,277
sqft
|
built
1971
9040 NW 20th St, Pembroke Pines, FL 33024
$-1,289
Cash flow
-9.3%
Cash-on-Cash Return
4.0%
Cap rate
0.6%
Rent to Value Ratio

Active
$299,990
2
bds
|
2
ba
|
978
sqft
|
built
1988
401 SW 113th Way, Pembroke Pines, FL 33025
$-644
Cash flow
-11.2%
Cash-on-Cash Return
3.6%
Cap rate
0.8%
Rent to Value Ratio
Active
$259,999
1
bds
|
1
ba
|
770
sqft
|
built
1989
711 SW 113th Way, Pembroke Pines, FL 33025
$-554
Cash flow
-11.1%
Cash-on-Cash Return
3.6%
Cap rate
0.7%
Rent to Value Ratio
Active
$280,000
2
bds
|
2
ba
|
815
sqft
|
built
2001
2125 NW 77th Way, Pembroke Pines, FL 33024
$-718
Cash flow
-13.4%
Cash-on-Cash Return
3.1%
Cap rate
0.8%
Rent to Value Ratio
Active
$549,900
3
bds
|
3
ba
|
1,848
sqft
|
built
1993
18463 NW 20th St, Pembroke Pines, FL 33029
$-1,255
Cash flow
-11.9%
Cash-on-Cash Return
3.4%
Cap rate
0.7%
Rent to Value Ratio
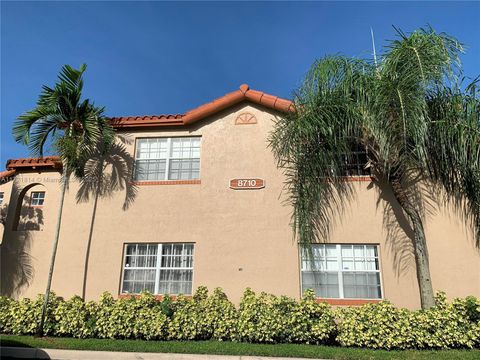
Active
$259,900
2
bds
|
2
ba
|
985
sqft
|
built
1989
8710 SW 3rd St, Pembroke Pines, FL 33025
$-589
Cash flow
-11.8%
Cash-on-Cash Return
3.4%
Cap rate
0.9%
Rent to Value Ratio
Active
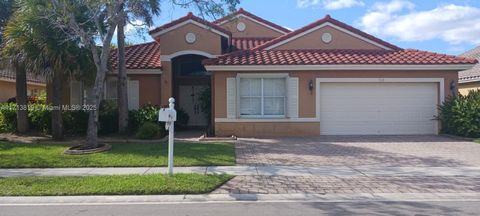
$675,000
3
bds
|
3
ba
|
1,778
sqft
|
built
1996
338 NW 152nd Ln, Pembroke Pines, FL 33028
$-1,268
Cash flow
-9.8%
Cash-on-Cash Return
3.9%
Cap rate
0.7%
Rent to Value Ratio

Active
$1,250,000
4
bds
|
4
ba
|
3,284
sqft
|
built
2000
1104 NW 139th Ave, Pembroke Pines, FL 33028
$-3,603
Cash flow
-15.0%
Cash-on-Cash Return
2.7%
Cap rate
0.5%
Rent to Value Ratio
Active
$298,000
2
bds
|
2
ba
|
854
sqft
|
built
1989
2331 NW 96th Ter, Pembroke Pines, FL 33024
$-645
Cash flow
-11.3%
Cash-on-Cash Return
3.6%
Cap rate
0.8%
Rent to Value Ratio
Active
$585,000
5
bds
|
2
ba
|
2,176
sqft
|
built
1964
521 SW 68th Ter, Pembroke Pines, FL 33023
$-237
Cash flow
-2.1%
Cash-on-Cash Return
5.7%
Cap rate
0.7%
Rent to Value Ratio

Active
$460,000
2
bds
|
1
ba
|
1,425
sqft
|
built
1968
8471 NW 16th St, Pembroke Pines, FL 33024
$-981
Cash flow
-11.1%
Cash-on-Cash Return
3.6%
Cap rate
0.6%
Rent to Value Ratio
Active
$849,900
5
bds
|
4
ba
|
2,742
sqft
|
built
2003
860 SW 191st Ave, Pembroke Pines, FL 33029
$-1,497
Cash flow
-9.2%
Cash-on-Cash Return
4.0%
Cap rate
0.7%
Rent to Value Ratio
Active
$192,000
1
bds
|
1
ba
|
720
sqft
|
built
1989
8621 SW 5th St, Pembroke Pines, FL 33025
$-598
Cash flow
-16.3%
Cash-on-Cash Return
2.4%
Cap rate
0.9%
Rent to Value Ratio
Active
$275,000
2
bds
|
2
ba
|
1,016
sqft
|
built
1990
301 Palm Way, Pembroke Pines, FL 33025
$-589
Cash flow
-11.2%
Cash-on-Cash Return
3.6%
Cap rate
0.8%
Rent to Value Ratio
Active
$309,975
2
bds
|
2
ba
|
978
sqft
|
built
1989
11360 SW 3rd St, Pembroke Pines, FL 33025
$-542
Cash flow
-9.1%
Cash-on-Cash Return
4.0%
Cap rate
0.8%
Rent to Value Ratio

Active
$950,000
4
bds
|
3
ba
|
2,814
sqft
|
built
1995
821 Cypress Pointe Dr W, Pembroke Pines, FL 33027
$-2,086
Cash flow
-11.5%
Cash-on-Cash Return
3.5%
Cap rate
0.6%
Rent to Value Ratio
Active
$649,900
3
bds
|
2
ba
|
1,321
sqft
|
built
1963
131 NW 72nd Way, Pembroke Pines, FL 33024
$-1,199
Cash flow
-9.6%
Cash-on-Cash Return
3.9%
Cap rate
0.6%
Rent to Value Ratio
Active
$843,000
5
bds
|
3
ba
|
2,813
sqft
|
built
2003
760 SW 190th Ave, Pembroke Pines, FL 33029
$-1,495
Cash flow
-9.3%
Cash-on-Cash Return
4.0%
Cap rate
0.6%
Rent to Value Ratio
Active
$280,000
2
bds
|
2
ba
|
1,016
sqft
|
built
1990
200 Palm Cir W, Pembroke Pines, FL 33025
$-603
Cash flow
-11.2%
Cash-on-Cash Return
3.6%
Cap rate
0.8%
Rent to Value Ratio
Active
$689,000
3
bds
|
2
ba
|
1,543
sqft
|
built
1977
8910 NW 7th Ct, Pembroke Pines, FL 33024
$-462
Cash flow
-3.5%
Cash-on-Cash Return
5.3%
Cap rate
0.7%
Rent to Value Ratio

Active
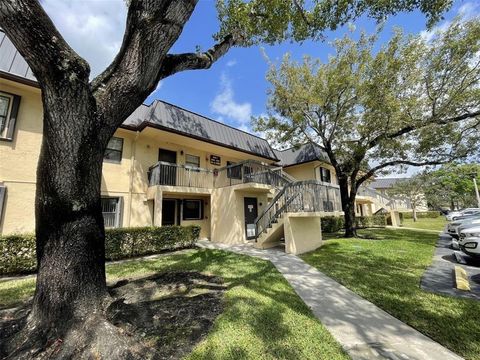
$259,900
2
bds
|
2
ba
|
1,100
sqft
|
built
1974
661 N University Dr, Pembroke Pines, FL 33024
$-719
Cash flow
-14.4%
Cash-on-Cash Return
2.8%
Cap rate
0.8%
Rent to Value Ratio
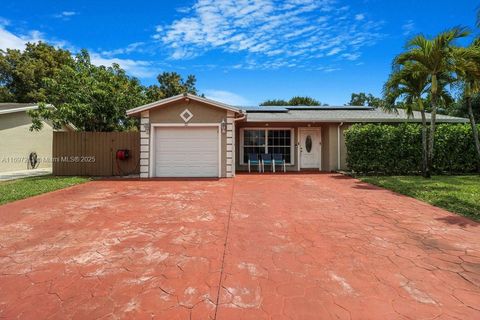
Active
$265,000
2
bds
|
2
ba
|
754
sqft
|
built
1983
515 NW 100th Pl, Pembroke Pines, FL 33024
$-722
Cash flow
-14.2%
Cash-on-Cash Return
2.9%
Cap rate
0.7%
Rent to Value Ratio
Active
$259,000
2
bds
|
2
ba
|
854
sqft
|
built
1989
2361 NW 96th Ter, Pembroke Pines, FL 33024
$-635
Cash flow
-12.8%
Cash-on-Cash Return
3.2%
Cap rate
0.8%
Rent to Value Ratio
Active
$748,900
4
bds
|
3
ba
|
2,098
sqft
|
built
1995
326 SW 162nd Ave, Pembroke Pines, FL 33027
$-1,215
Cash flow
-8.5%
Cash-on-Cash Return
4.2%
Cap rate
0.6%
Rent to Value Ratio
Active
$775,000
3
bds
|
2
ba
|
1,971
sqft
|
built
1971
8711 NW 18th St, Pembroke Pines, FL 33024
$-552
Cash flow
-3.7%
Cash-on-Cash Return
5.3%
Cap rate
0.7%
Rent to Value Ratio
Active
$289,000
2
bds
|
2
ba
|
806
sqft
|
built
1984
9173 NW 1st Ct, Pembroke Pines, FL 33024
$-678
Cash flow
-12.2%
Cash-on-Cash Return
3.3%
Cap rate
0.8%
Rent to Value Ratio

Active
$249,999
2
bds
|
2
ba
|
790
sqft
|
built
1984
137 NW 93rd Ave, Pembroke Pines, FL 33024
$-499
Cash flow
-10.4%
Cash-on-Cash Return
3.8%
Cap rate
0.8%
Rent to Value Ratio

Active
$260,000
2
bds
|
2
ba
|
787
sqft
|
built
1984
9165 NW 1st Ct, Pembroke Pines, FL 33024
$-536
Cash flow
-10.8%
Cash-on-Cash Return
3.7%
Cap rate
0.9%
Rent to Value Ratio
Active
$735,000
4
bds
|
3
ba
|
2,011
sqft
|
built
1990
940 SW 96th Ave, Pembroke Pines, FL 33025
$-625
Cash flow
-4.4%
Cash-on-Cash Return
5.1%
Cap rate
0.6%
Rent to Value Ratio

Active
$507,000
2
bds
|
1
ba
|
1,425
sqft
|
built
1973
1131 NW 85th Way, Pembroke Pines, FL 33024
$-1,095
Cash flow
-11.3%
Cash-on-Cash Return
3.6%
Cap rate
0.6%
Rent to Value Ratio
Active
$183,250
2
bds
|
1
ba
|
770
sqft
|
built
1989
333 SW 86th Ave, Pembroke Pines, FL 33025
$-303
Cash flow
-8.6%
Cash-on-Cash Return
4.2%
Cap rate
1.1%
Rent to Value Ratio
Active
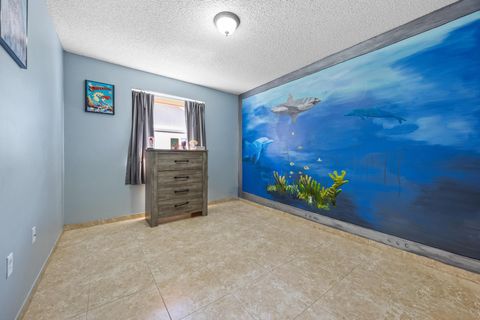
$179,000
1
bds
|
2
ba
|
780
sqft
|
built
1974
661 N University Dr, Pembroke Pines, FL 33024
$-630
Cash flow
-18.4%
Cash-on-Cash Return
1.9%
Cap rate
0.9%
Rent to Value Ratio
Active
$664,900
4
bds
|
2
ba
|
1,874
sqft
|
built
1982
301 NW 83rd Way, Pembroke Pines, FL 33024
$-1,815
Cash flow
-14.2%
Cash-on-Cash Return
2.9%
Cap rate
0.5%
Rent to Value Ratio

Active
$819,000
4
bds
|
2
ba
|
2,174
sqft
|
built
2002
1850 NW 72nd Way, Pembroke Pines, FL 33024
$-1,696
Cash flow
-10.8%
Cash-on-Cash Return
3.7%
Cap rate
0.6%
Rent to Value Ratio

Active
$199,999
1
bds
|
2
ba
|
805
sqft
|
built
1989
8664 SW 3rd St, Pembroke Pines, FL 33025
$-553
Cash flow
-14.4%
Cash-on-Cash Return
2.8%
Cap rate
0.9%
Rent to Value Ratio
Active
$930,000
5
bds
|
3
ba
|
2,814
sqft
|
built
1994
212 SW 179th Ave, Pembroke Pines, FL 33029
$-1,573
Cash flow
-8.8%
Cash-on-Cash Return
4.1%
Cap rate
0.7%
Rent to Value Ratio

Active
$459,900
3
bds
|
2
ba
|
1,103
sqft
|
built
1985
8615 SW 15th St, Pembroke Pines, FL 33025
$-467
Cash flow
-5.3%
Cash-on-Cash Return
4.9%
Cap rate
0.7%
Rent to Value Ratio

Active
$345,000
3
bds
|
2
ba
|
1,170
sqft
|
built
2001
7930 NW 7th St, Pembroke Pines, FL 33024
$-823
Cash flow
-12.4%
Cash-on-Cash Return
3.3%
Cap rate
0.7%
Rent to Value Ratio
Active
$265,000
2
bds
|
2
ba
|
754
sqft
|
built
1983
10018 NW 4th St, Pembroke Pines, FL 33024
$-624
Cash flow
-12.3%
Cash-on-Cash Return
3.3%
Cap rate
0.8%
Rent to Value Ratio
Active
$320,000
2
bds
|
2
ba
|
932
sqft
|
built
1988
10477 NW 7th St, Pembroke Pines, FL 33026
$-853
Cash flow
-13.9%
Cash-on-Cash Return
2.9%
Cap rate
0.7%
Rent to Value Ratio