Pembroke Pines, FL Investment Properties for Sale
Browse homes for sale and investment properties in Pembroke Pines, FL. Refine your search by price, property type, or more.
Best cash flowing properties in Pembroke Pines, FL
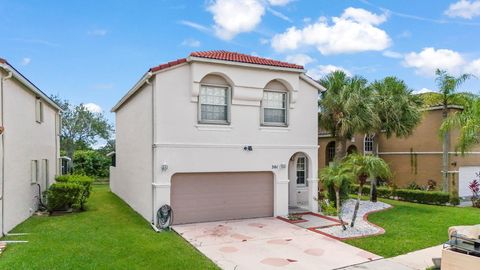
Active
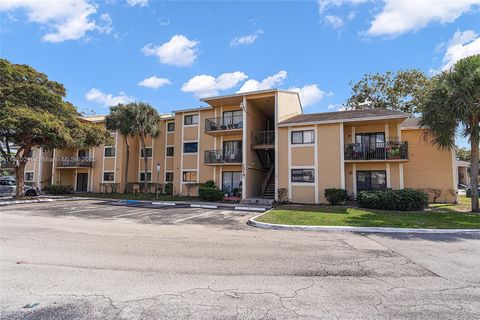
$269,000
2
bds
|
1
ba
|
881
sqft
|
built
1990
251 Palm Cir W, Pembroke Pines, FL 33025
$-435
Cash flow
-8.4%
Cash-on-Cash Return
4.2%
Cap rate
0.9%
Rent to Value Ratio
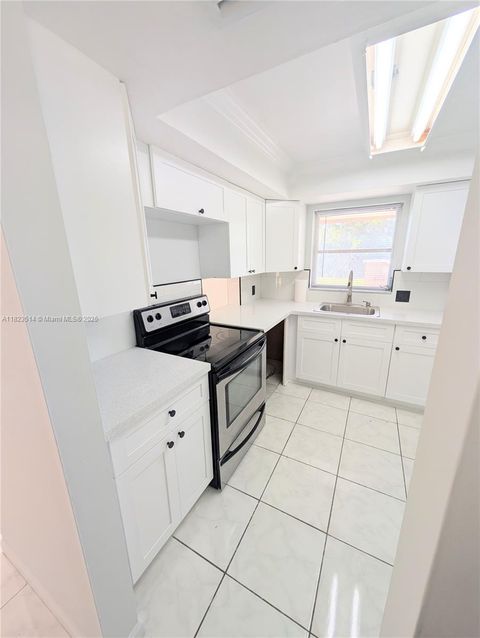
Active
$285,000
2
bds
|
2
ba
|
900
sqft
|
built
1971
14901 SW 4th St, Pembroke Pines, FL 33027
$-497
Cash flow
-9.1%
Cash-on-Cash Return
4.1%
Cap rate
0.8%
Rent to Value Ratio
508 out of 561 properties for sale in Pembroke Pines, FL
Limited Results Shown
Create a free account, or log in to reveal all property listings and enjoy the complete experience.

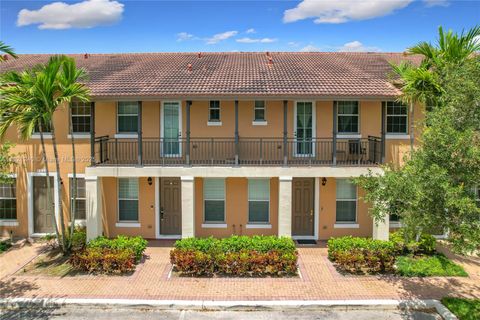
Active
$720,000
3
bds
|
2
ba
|
1,984
sqft
|
built
2001
14295 NW 18th Pl, Pembroke Pines, FL 33028
$-1,764
Cash flow
-12.8%
Cash-on-Cash Return
3.2%
Cap rate
0.5%
Rent to Value Ratio

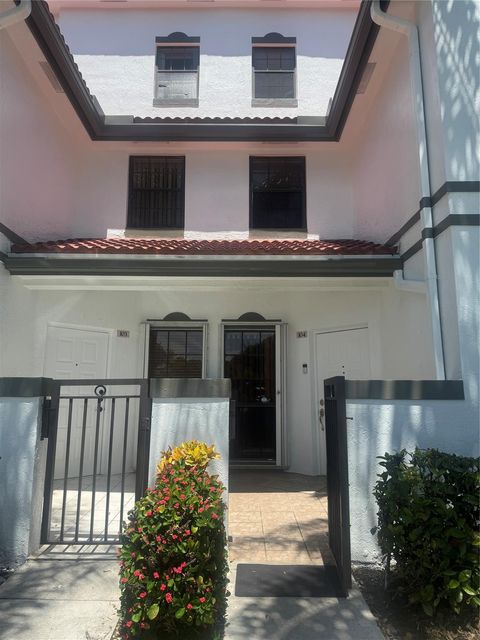
Active
$1,097,300
6
bds
|
4
ba
|
3,622
sqft
|
built
1999
1273 SW 161st Ave, Pembroke Pines, FL 33027
$-2,770
Cash flow
-13.2%
Cash-on-Cash Return
3.1%
Cap rate
0.5%
Rent to Value Ratio
Active
$450,000
2
bds
|
3
ba
|
1,368
sqft
|
built
2012
1214 SW 147th Ter, Pembroke Pines, FL 33027
$-1,503
Cash flow
-17.4%
Cash-on-Cash Return
2.1%
Cap rate
0.6%
Rent to Value Ratio
Active
$335,000
2
bds
|
2
ba
|
1,250
sqft
|
built
1992
301 SW 158th Ter, Pembroke Pines, FL 33027
$-861
Cash flow
-13.4%
Cash-on-Cash Return
3.1%
Cap rate
0.7%
Rent to Value Ratio
Active
$260,000
2
bds
|
2
ba
|
1,037
sqft
|
built
1989
1250 SW 113th Ter, Pembroke Pines, FL 33025
$-670
Cash flow
-13.4%
Cash-on-Cash Return
3.1%
Cap rate
0.9%
Rent to Value Ratio

Active
$959,999
4
bds
|
3
ba
|
2,444
sqft
|
built
1999
13741 NW 23rd St, Pembroke Pines, FL 33028
$-2,998
Cash flow
-16.3%
Cash-on-Cash Return
2.4%
Cap rate
0.5%
Rent to Value Ratio
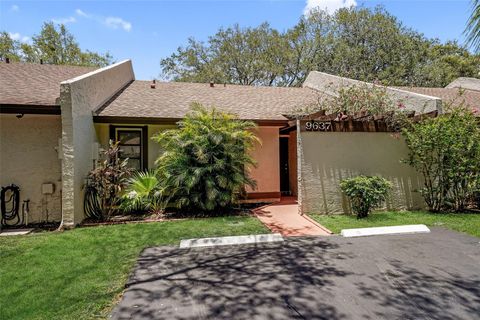
Active
$425,000
2
bds
|
2
ba
|
1,060
sqft
|
built
1980
9637 NW 15th Ct, Pembroke Pines, FL 33024
$-699
Cash flow
-8.6%
Cash-on-Cash Return
4.2%
Cap rate
0.6%
Rent to Value Ratio

Active
$434,921
2
bds
|
1
ba
|
874
sqft
|
built
1970
8851 NW 12th St, Pembroke Pines, FL 33024
$-786
Cash flow
-9.4%
Cash-on-Cash Return
4.0%
Cap rate
0.7%
Rent to Value Ratio
Active
$750,000
3
bds
|
3
ba
|
1,654
sqft
|
built
2010
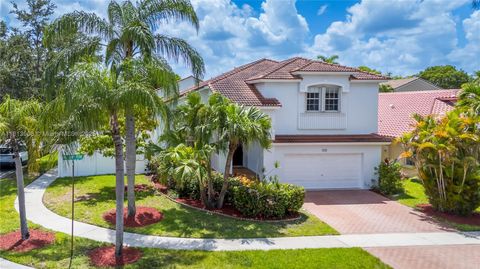
3730 NW 84th Way, Pembroke Pines, FL 33024
$-1,486
Cash flow
-10.3%
Cash-on-Cash Return
3.8%
Cap rate
0.7%
Rent to Value Ratio
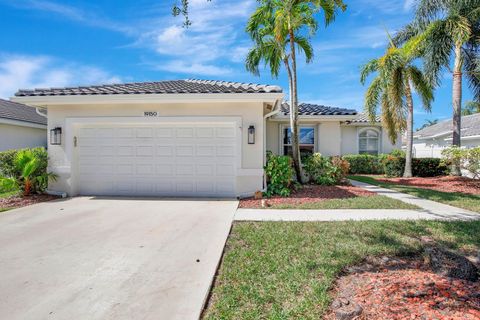
Active
$725,000
4
bds
|
2
ba
|
1,980
sqft
|
built
1998
19150 NW 23rd Ct, Pembroke Pines, FL 33029
$-1,666
Cash flow
-12.0%
Cash-on-Cash Return
3.4%
Cap rate
0.5%
Rent to Value Ratio
Active
$749,950
4
bds
|
3
ba
|
2,595
sqft
|
built
1994
1020 NW 184th Ter, Pembroke Pines, FL 33029
$-1,181
Cash flow
-8.2%
Cash-on-Cash Return
4.3%
Cap rate
0.7%
Rent to Value Ratio

Active
$590,000
3
bds
|
3
ba
|
2,054
sqft
|
built
2021
9265 NW 16th St, Pembroke Pines, FL 33024
$-1,211
Cash flow
-10.7%
Cash-on-Cash Return
3.7%
Cap rate
0.7%
Rent to Value Ratio
Active
$649,000
4
bds
|
2
ba
|
1,865
sqft
|
built
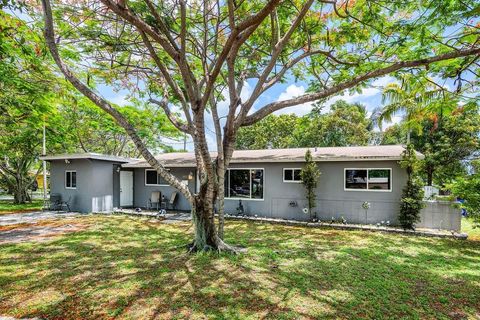
1979
8801 NW 5th St, Pembroke Pines, FL 33024
$-954
Cash flow
-7.7%
Cash-on-Cash Return
4.4%
Cap rate
0.6%
Rent to Value Ratio

Active
$940,000
5
bds
|
3
ba
|
2,820
sqft
|
built
2000
1001 SW 189th Ave, Pembroke Pines, FL 33029
$-1,565
Cash flow
-8.7%
Cash-on-Cash Return
4.1%
Cap rate
0.6%
Rent to Value Ratio
Active
$285,000
2
bds
|
2
ba
|
900
sqft
|
built
1971
14901 SW 4th St, Pembroke Pines, FL 33027
$-497
Cash flow
-9.1%
Cash-on-Cash Return
4.1%
Cap rate
0.8%
Rent to Value Ratio

Active
$349,900
2
bds
|
2
ba
|
1,040
sqft
|
built
2013
14745 SW 9th St, Pembroke Pines, FL 33027
$-1,330
Cash flow
-19.8%
Cash-on-Cash Return
1.6%
Cap rate
0.7%
Rent to Value Ratio
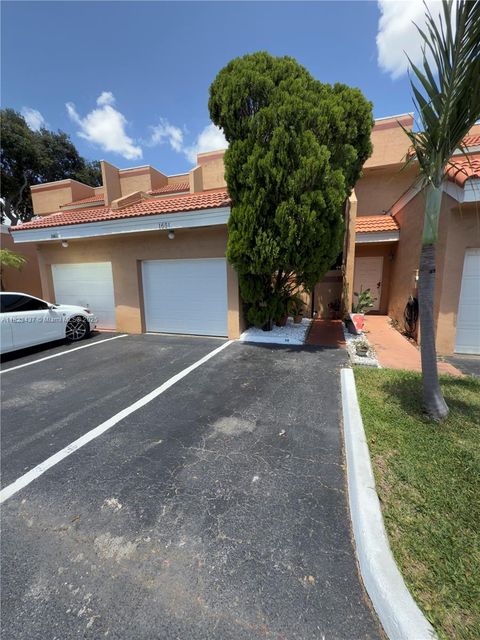
Active
$499,000
4
bds
|
3
ba
|
1,524
sqft
|
built
1987
1651 SW 120th Ave, Pembroke Pines, FL 33025
$-865
Cash flow
-9.0%
Cash-on-Cash Return
4.1%
Cap rate
0.6%
Rent to Value Ratio
Active
$840,000
4
bds
|
3
ba
|
2,880
sqft
|
built
1996
801 NW 156th Ave, Pembroke Pines, FL 33028
$-2,157
Cash flow
-13.4%
Cash-on-Cash Return
3.1%
Cap rate
0.5%
Rent to Value Ratio
Active
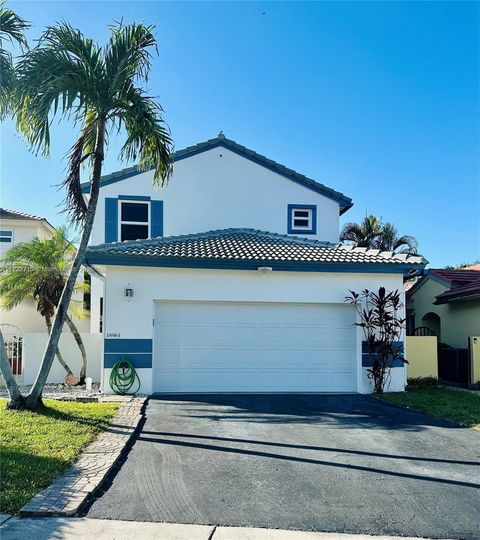
$649,000
3
bds
|
3
ba
|
1,568
sqft
|
built
1993
18961 NW 22nd St, Pembroke Pines, FL 33029
$-1,821
Cash flow
-14.6%
Cash-on-Cash Return
2.8%
Cap rate
0.5%
Rent to Value Ratio
Active
$756,000
4
bds
|
3
ba
|
2,154
sqft
|
built
2002
1745 NW 77th Ave, Pembroke Pines, FL 33024
$-2,249
Cash flow
-15.5%
Cash-on-Cash Return
2.6%
Cap rate
0.5%
Rent to Value Ratio
Active
$700,000
3
bds
|
2
ba
|
1,460
sqft
|
built
1997
19253 SW 5th St, Pembroke Pines, FL 33029
$-1,618
Cash flow
-12.1%
Cash-on-Cash Return
3.4%
Cap rate
0.5%
Rent to Value Ratio
Active
$369,000
2
bds
|
3
ba
|
1,224
sqft
|
built
1987
621 NW 105th Way, Pembroke Pines, FL 33026
$-1,164
Cash flow
-16.5%
Cash-on-Cash Return
2.4%
Cap rate
0.7%
Rent to Value Ratio
Active
$649,000
4
bds
|
3
ba
|
2,053
sqft
|
built
1995
301 NW 151st Ave, Pembroke Pines, FL 33028
$-1,197
Cash flow
-9.6%
Cash-on-Cash Return
3.9%
Cap rate
0.6%
Rent to Value Ratio
Active
$675,000
3
bds
|
2
ba
|
1,991
sqft
|
built
1998
16174 SW 9th St, Pembroke Pines, FL 33027
$-1,273
Cash flow
-9.8%
Cash-on-Cash Return
3.9%
Cap rate
0.6%
Rent to Value Ratio
Active
$630,000
3
bds
|
3
ba
|
1,731
sqft
|
built
1993
470 NW 102nd Ter, Pembroke Pines, FL 33026
$-1,469
Cash flow
-12.2%
Cash-on-Cash Return
3.3%
Cap rate
0.5%
Rent to Value Ratio
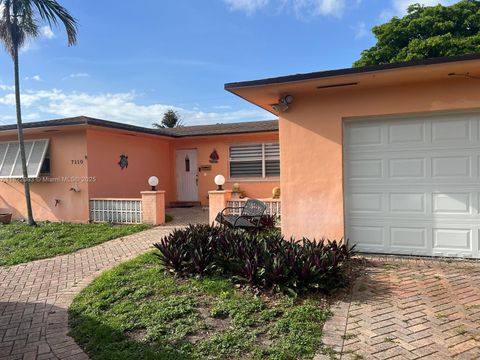
Active
$599,999
3
bds
|
2
ba
|
1,505
sqft
|
built
1963
7110 SW 11th St, Pembroke Pines, FL 33023
$-1,113
Cash flow
-9.7%
Cash-on-Cash Return
3.9%
Cap rate
0.6%
Rent to Value Ratio

Active
$640,000
3
bds
|
3
ba
|
1,993
sqft
|
built
1995
19257 NW 14th St, Pembroke Pines, FL 33029
$-1,224
Cash flow
-10.0%
Cash-on-Cash Return
3.9%
Cap rate
0.6%
Rent to Value Ratio

Active
$930,000
5
bds
|
3
ba
|
2,924
sqft
|
built
1998
1925 NW 167th Ter, Pembroke Pines, FL 33028
$-2,355
Cash flow
-13.2%
Cash-on-Cash Return
3.1%
Cap rate
0.5%
Rent to Value Ratio
Active
$559,000
4
bds
|
2
ba
|
1,599
sqft
|
built
1961
6631 SW 4th St, Pembroke Pines, FL 33023
$-1,292
Cash flow
-12.1%
Cash-on-Cash Return
3.4%
Cap rate
0.6%
Rent to Value Ratio
Active
$250,000
2
bds
|
2
ba
|
1,300
sqft
|
built
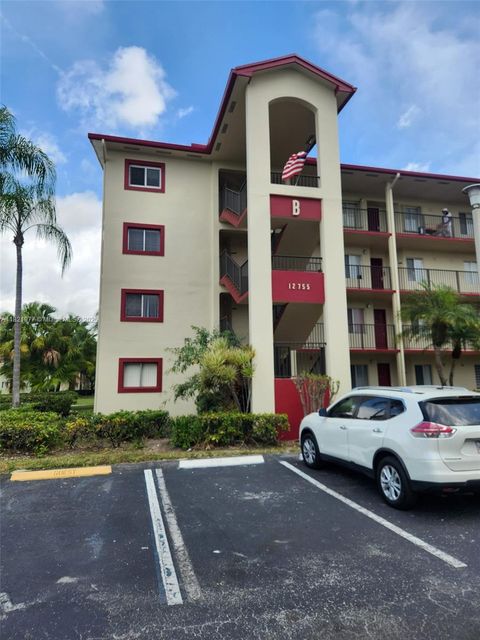
1993
12755 SW 16th Ct, Pembroke Pines, FL 33027
$-515
Cash flow
-10.7%
Cash-on-Cash Return
3.7%
Cap rate
1.0%
Rent to Value Ratio
Active
$879,000
4
bds
|
3
ba
|
3,347
sqft
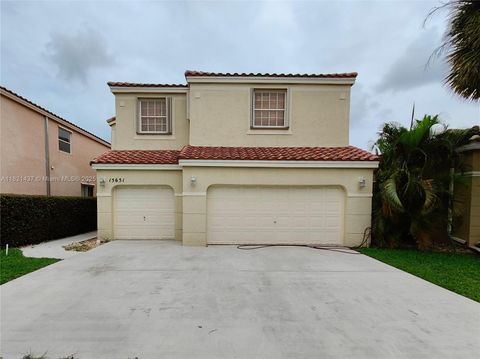
|
built
1997
15651 NW 14th Ct, Pembroke Pines, FL 33028
$-1,884
Cash flow
-11.2%
Cash-on-Cash Return
3.6%
Cap rate
0.6%
Rent to Value Ratio
Active
$495,000
3
bds
|
2
ba
|
1,595
sqft
|
built
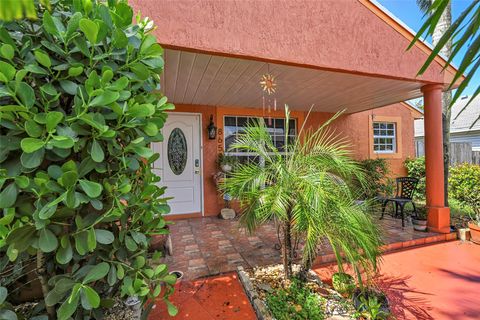
1986
8650 SW 16th St, Pembroke Pines, FL 33025
$-843
Cash flow
-8.9%
Cash-on-Cash Return
4.1%
Cap rate
0.6%
Rent to Value Ratio
Active
$650,000
3
bds
|
2
ba
|
1,783
sqft
|
built
1977
9440 NW 24th Pl, Pembroke Pines, FL 33024
$-1,331
Cash flow
-10.7%
Cash-on-Cash Return
3.7%
Cap rate
0.6%
Rent to Value Ratio

Active
$419,900
2
bds
|
1
ba
|
1,113
sqft
|
built
1969
7640 NW 16th Ct, Pembroke Pines, FL 33024
$-806
Cash flow
-10.0%
Cash-on-Cash Return
3.8%
Cap rate
0.7%
Rent to Value Ratio
Active
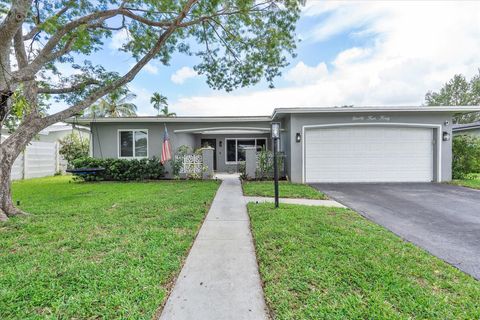
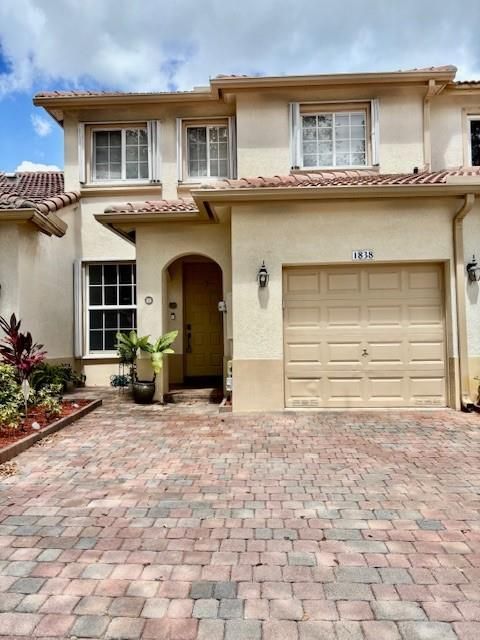
$519,900
3
bds
|
3
ba
|
1,694
sqft
|
built
2001
1838 NW 79th Way, Pembroke Pines, FL 33024
$-1,356
Cash flow
-13.6%
Cash-on-Cash Return
3.0%
Cap rate
0.7%
Rent to Value Ratio
Active
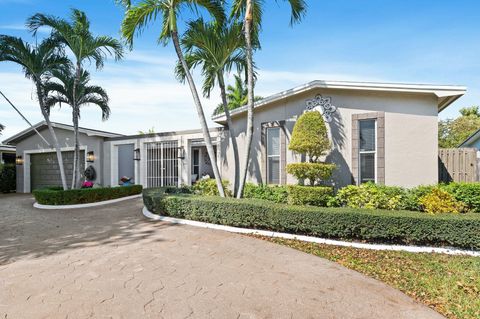
$269,000
2
bds
|
1
ba
|
881
sqft
|
built
1990
251 Palm Cir W, Pembroke Pines, FL 33025
$-435
Cash flow
-8.4%
Cash-on-Cash Return
4.2%
Cap rate
0.9%
Rent to Value Ratio

Active
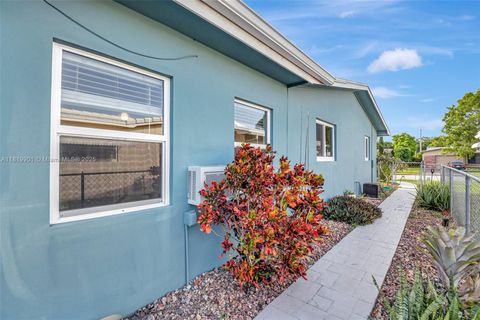
$619,000
4
bds
|
3
ba
|
2,285
sqft
|
built
1995
10257 SW 12th St, Pembroke Pines, FL 33025
$-1,195
Cash flow
-10.1%
Cash-on-Cash Return
3.8%
Cap rate
0.7%
Rent to Value Ratio

Active
$700,000
3
bds
|
2
ba
|
1,663
sqft
|
built
1996
142 SW 204th Ave, Pembroke Pines, FL 33029
$-1,559
Cash flow
-11.6%
Cash-on-Cash Return
3.5%
Cap rate
0.6%
Rent to Value Ratio
Active
$699,999
3
bds
|
2
ba
|
1,919
sqft
|
built
1979
1400 NW 114th Ave, Pembroke Pines, FL 33026
$-1,286
Cash flow
-9.6%
Cash-on-Cash Return
3.9%
Cap rate
0.6%
Rent to Value Ratio
Active
$833,000
5
bds
|
2
ba
|
2,206
sqft
|
built
1977
11520 NW 23rd St, Pembroke Pines, FL 33026
$-1,866
Cash flow
-11.7%
Cash-on-Cash Return
3.5%
Cap rate
0.5%
Rent to Value Ratio