Pembroke Pines, FL Investment Properties for Sale
Browse homes for sale and investment properties in Pembroke Pines, FL. Refine your search by price, property type, or more.
Best cash flowing properties in Pembroke Pines, FL

Active
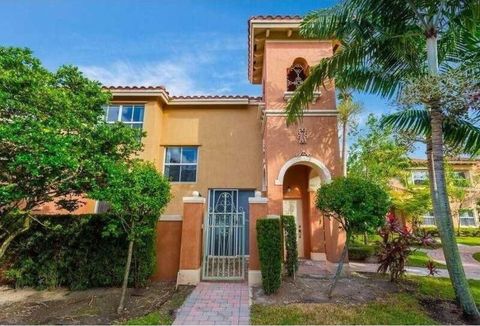
$169,000
1
bds
|
1
ba
|
675
sqft
|
built
1972
2041 NW 81st Ave, Pembroke Pines, FL 33024
$-275
Cash flow
-8.5%
Cash-on-Cash Return
4.2%
Cap rate
0.9%
Rent to Value Ratio

Active
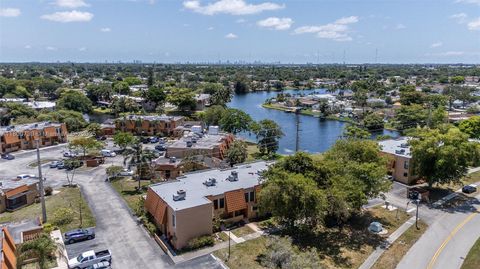
$129,000
1
bds
|
2
ba
|
900
sqft
|
built
1973
9823 S Hollybrook Lake Dr, Pembroke Pines, FL 33025
$-410
Cash flow
-16.6%
Cash-on-Cash Return
2.3%
Cap rate
1.3%
Rent to Value Ratio
509 out of 561 properties for sale in Pembroke Pines, FL
Limited Results Shown
Create a free account, or log in to reveal all property listings and enjoy the complete experience.
Active
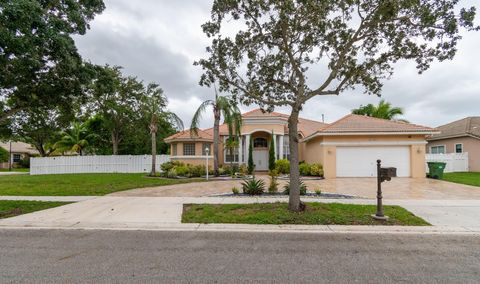
$450,000
3
bds
|
3
ba
|
1,361
sqft
|
built
1998
20866 NW 3rd Ln, Pembroke Pines, FL 33029
$-1,000
Cash flow
-11.6%
Cash-on-Cash Return
3.5%
Cap rate
0.6%
Rent to Value Ratio

Active
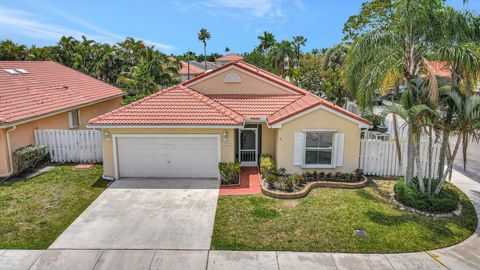
$567,500
4
bds
|
3
ba
|
2,057
sqft
|
built
1992
349 NW 207th Ave, Pembroke Pines, FL 33029
$-877
Cash flow
-8.1%
Cash-on-Cash Return
4.3%
Cap rate
0.7%
Rent to Value Ratio
Active
$671,000
4
bds
|
3
ba
|
2,428
sqft
|
built
1990
1210 SW 115th Ave, Pembroke Pines, FL 33025
$-871
Cash flow
-6.8%
Cash-on-Cash Return
4.6%
Cap rate
0.7%
Rent to Value Ratio

Active
$715,000
4
bds
|
3
ba
|
2,092
sqft
|
built
2001
1874 NW 74th Way, Pembroke Pines, FL 33024
$-2,062
Cash flow
-15.0%
Cash-on-Cash Return
2.7%
Cap rate
0.5%
Rent to Value Ratio

Active
$620,000
3
bds
|
2
ba
|
1,859
sqft
|
built
1979
9400 NW 13th St, Pembroke Pines, FL 33024
$-1,074
Cash flow
-9.0%
Cash-on-Cash Return
4.1%
Cap rate
0.7%
Rent to Value Ratio
Active
$898,000
5
bds
|
3
ba
|
3,501
sqft
|
built
2003
16928 SW 16th St, Pembroke Pines, FL 33027
$-2,550
Cash flow
-14.8%
Cash-on-Cash Return
2.7%
Cap rate
0.4%
Rent to Value Ratio
Active
$321,750
2
bds
|
2
ba
|
1,205
sqft
|
built
1984
11318 Taft St, Pembroke Pines, FL 33026
$-1,003
Cash flow
-16.3%
Cash-on-Cash Return
2.4%
Cap rate
0.7%
Rent to Value Ratio

Active
$575,000
3
bds
|
3
ba
|
1,719
sqft
|
built
1997
1437 NW 154th Ln, Pembroke Pines, FL 33028
$-1,424
Cash flow
-12.9%
Cash-on-Cash Return
3.2%
Cap rate
0.6%
Rent to Value Ratio

Active
$355,000
2
bds
|
3
ba
|
1,240
sqft
|
built
1986
131 SW 97th Ave, Pembroke Pines, FL 33025
$-1,035
Cash flow
-15.2%
Cash-on-Cash Return
2.6%
Cap rate
0.7%
Rent to Value Ratio
Active
$169,000
1
bds
|
1
ba
|
675
sqft
|
built
1972
2041 NW 81st Ave, Pembroke Pines, FL 33024
$-275
Cash flow
-8.5%
Cash-on-Cash Return
4.2%
Cap rate
0.9%
Rent to Value Ratio
Active
$129,000
1
bds
|
2
ba
|
900
sqft
|
built
1973
9823 S Hollybrook Lake Dr, Pembroke Pines, FL 33025
$-410
Cash flow
-16.6%
Cash-on-Cash Return
2.3%
Cap rate
1.3%
Rent to Value Ratio

Active
$850,000
4
bds
|
4
ba
|
3,284
sqft
|
built
1999
13366 NW 14th St, Pembroke Pines, FL 33028
$-2,586
Cash flow
-15.9%
Cash-on-Cash Return
2.5%
Cap rate
0.6%
Rent to Value Ratio

Active
$1,099,000
5
bds
|
4
ba
|
3,345
sqft
|
built
1999
13790 NW 20th St, Pembroke Pines, FL 33028
$-3,455
Cash flow
-16.4%
Cash-on-Cash Return
2.4%
Cap rate
0.5%
Rent to Value Ratio

Active
$619,000
4
bds
|
3
ba
|
2,114
sqft
|
built
1989
9731 SW 13th St, Pembroke Pines, FL 33025
$-817
Cash flow
-6.9%
Cash-on-Cash Return
4.6%
Cap rate
0.6%
Rent to Value Ratio

Active
$795,000
4
bds
|
3
ba
|
2,104
sqft
|
built
1993
1060 NW 192nd Ave, Pembroke Pines, FL 33029
$-1,560
Cash flow
-10.2%
Cash-on-Cash Return
3.8%
Cap rate
0.6%
Rent to Value Ratio

Active
$265,000
1
bds
|
1
ba
|
843
sqft
|
built
1989
11201 SW 13th St, Pembroke Pines, FL 33025
$-780
Cash flow
-15.4%
Cash-on-Cash Return
2.6%
Cap rate
0.8%
Rent to Value Ratio

Active
$530,000
3
bds
|
3
ba
|
1,442
sqft
|
built
1999
884 NW 170th Ter, Pembroke Pines, FL 33028
$-1,350
Cash flow
-13.3%
Cash-on-Cash Return
3.1%
Cap rate
0.6%
Rent to Value Ratio
Active
$435,000
3
bds
|
3
ba
|
1,396
sqft
|
built
2007
1035 SW 144th Ave, Pembroke Pines, FL 33027
$-1,409
Cash flow
-16.9%
Cash-on-Cash Return
2.3%
Cap rate
0.6%
Rent to Value Ratio

Active
$245,000
1
bds
|
1
ba
|
610
sqft
|
built
1991
805 NW 108th Ter, Pembroke Pines, FL 33026
$-841
Cash flow
-17.9%
Cash-on-Cash Return
2.0%
Cap rate
0.7%
Rent to Value Ratio
Active
$389,900
3
bds
|
3
ba
|
1,472
sqft
|
built
1979
1541 NW 92nd Ave, Pembroke Pines, FL 33024
$-1,073
Cash flow
-14.4%
Cash-on-Cash Return
2.8%
Cap rate
0.8%
Rent to Value Ratio

Active
$459,800
3
bds
|
2
ba
|
1,511
sqft
|
built
1985
1033 NW 124th Ave, Pembroke Pines, FL 33026
$-953
Cash flow
-10.8%
Cash-on-Cash Return
3.7%
Cap rate
0.7%
Rent to Value Ratio

Active
$599,000
3
bds
|
2
ba
|
1,530
sqft
|
built
1954
6626 SW 1st Ct, Pembroke Pines, FL 33023
$-1,358
Cash flow
-11.8%
Cash-on-Cash Return
3.4%
Cap rate
0.5%
Rent to Value Ratio

Active
$869,000
4
bds
|
3
ba
|
2,839
sqft
|
built
1994
596 NW 164th Ave, Pembroke Pines, FL 33028
$-1,885
Cash flow
-11.3%
Cash-on-Cash Return
3.5%
Cap rate
0.5%
Rent to Value Ratio
Active
$934,900
5
bds
|
3
ba
|
2,829
sqft
|
built
2002
13702 NW 16th St, Pembroke Pines, FL 33028
$-1,667
Cash flow
-9.3%
Cash-on-Cash Return
4.0%
Cap rate
0.7%
Rent to Value Ratio
Active
$609,999
3
bds
|
2
ba
|
1,637
sqft
|
built
1995
16590 NW 9th St, Pembroke Pines, FL 33028
$-1,338
Cash flow
-11.4%
Cash-on-Cash Return
3.5%
Cap rate
0.6%
Rent to Value Ratio

Active
$639,500
3
bds
|
2
ba
|
1,663
sqft
|
built
1998
20494 SW 5th St, Pembroke Pines, FL 33029
$-1,469
Cash flow
-12.0%
Cash-on-Cash Return
3.4%
Cap rate
0.6%
Rent to Value Ratio

Active
$1,300,000
5
bds
|
4
ba
|
2,955
sqft
|
built
1994
18201 NW 16th St, Pembroke Pines, FL 33029
$-3,287
Cash flow
-13.2%
Cash-on-Cash Return
3.1%
Cap rate
0.5%
Rent to Value Ratio

Active
$540,000
3
bds
|
2
ba
|
1,299
sqft
|
built
1957
6845 SW 12th St, Pembroke Pines, FL 33023
$-1,352
Cash flow
-13.1%
Cash-on-Cash Return
3.1%
Cap rate
0.5%
Rent to Value Ratio
Active
$435,000
2
bds
|
3
ba
|
1,482
sqft
|
built
1979
11291 NW 16th Ct, Pembroke Pines, FL 33026
$-1,077
Cash flow
-12.9%
Cash-on-Cash Return
3.2%
Cap rate
0.6%
Rent to Value Ratio
Active
$274,000
2
bds
|
2
ba
|
970
sqft
|
built
2001
7820 NW 7th St, Pembroke Pines, FL 33024
$-678
Cash flow
-12.9%
Cash-on-Cash Return
3.2%
Cap rate
0.8%
Rent to Value Ratio
Active
$379,000
3
bds
|
3
ba
|
1,472
sqft
|
built
1980
1150 NW 99th Ave, Pembroke Pines, FL 33024
$-687
Cash flow
-9.5%
Cash-on-Cash Return
4.0%
Cap rate
0.8%
Rent to Value Ratio

Active
$579,000
4
bds
|
2
ba
|
1,866
sqft
|
built
1981
8510 NW 7th Ct, Pembroke Pines, FL 33024
$-827
Cash flow
-7.5%
Cash-on-Cash Return
4.4%
Cap rate
0.6%
Rent to Value Ratio

Active
$255,000
2
bds
|
2
ba
|
806
sqft
|
built
1986
1124 NW 106th Ter, Pembroke Pines, FL 33026
$-596
Cash flow
-12.2%
Cash-on-Cash Return
3.3%
Cap rate
0.9%
Rent to Value Ratio
Active
$609,999
4
bds
|
2
ba
|
1,492
sqft
|
built
1965
6820 SW 9th St, Pembroke Pines, FL 33023
$-732
Cash flow
-6.3%
Cash-on-Cash Return
4.7%
Cap rate
0.7%
Rent to Value Ratio

Active
$269,995
2
bds
|
2
ba
|
854
sqft
|
built
1989
2301 NW 96th Ter, Pembroke Pines, FL 33024
$-627
Cash flow
-12.1%
Cash-on-Cash Return
3.4%
Cap rate
0.9%
Rent to Value Ratio

Active
$598,000
4
bds
|
3
ba
|
1,429
sqft
|
built
1970
8761 NW 12th St, Pembroke Pines, FL 33024
$-1,554
Cash flow
-13.6%
Cash-on-Cash Return
3.0%
Cap rate
0.5%
Rent to Value Ratio
Active
$285,000
1
bds
|
1
ba
|
713
sqft
|
built
1998
151 SW 117th Ave, Pembroke Pines, FL 33025
$-736
Cash flow
-13.5%
Cash-on-Cash Return
3.0%
Cap rate
0.7%
Rent to Value Ratio
Active
$1,200,000
4
bds
|
3
ba
|
2,320
sqft
|
built
2011
8513 NW 41st St, Pembroke Pines, FL 33024
$-4,439
Cash flow
-19.3%
Cash-on-Cash Return
1.7%
Cap rate
0.4%
Rent to Value Ratio
Active
$615,000
3
bds
|
2
ba
|
1,386
sqft
|
built
1980
8640 NW 4th St, Pembroke Pines, FL 33024
$-1,075
Cash flow
-9.1%
Cash-on-Cash Return
4.0%
Cap rate
0.6%
Rent to Value Ratio

Active
$564,500
3
bds
|
2
ba
|
1,336
sqft
|
built
1957
7000 SW 10th St, Pembroke Pines, FL 33023
$-1,436
Cash flow
-13.3%
Cash-on-Cash Return
3.1%
Cap rate
0.6%
Rent to Value Ratio