Phoenix, AZ Investment Properties for Sale
Browse homes for sale and investment properties in Phoenix, AZ. Refine your search by price, property type, or more.
Best cash flowing properties in Phoenix, AZ
Active
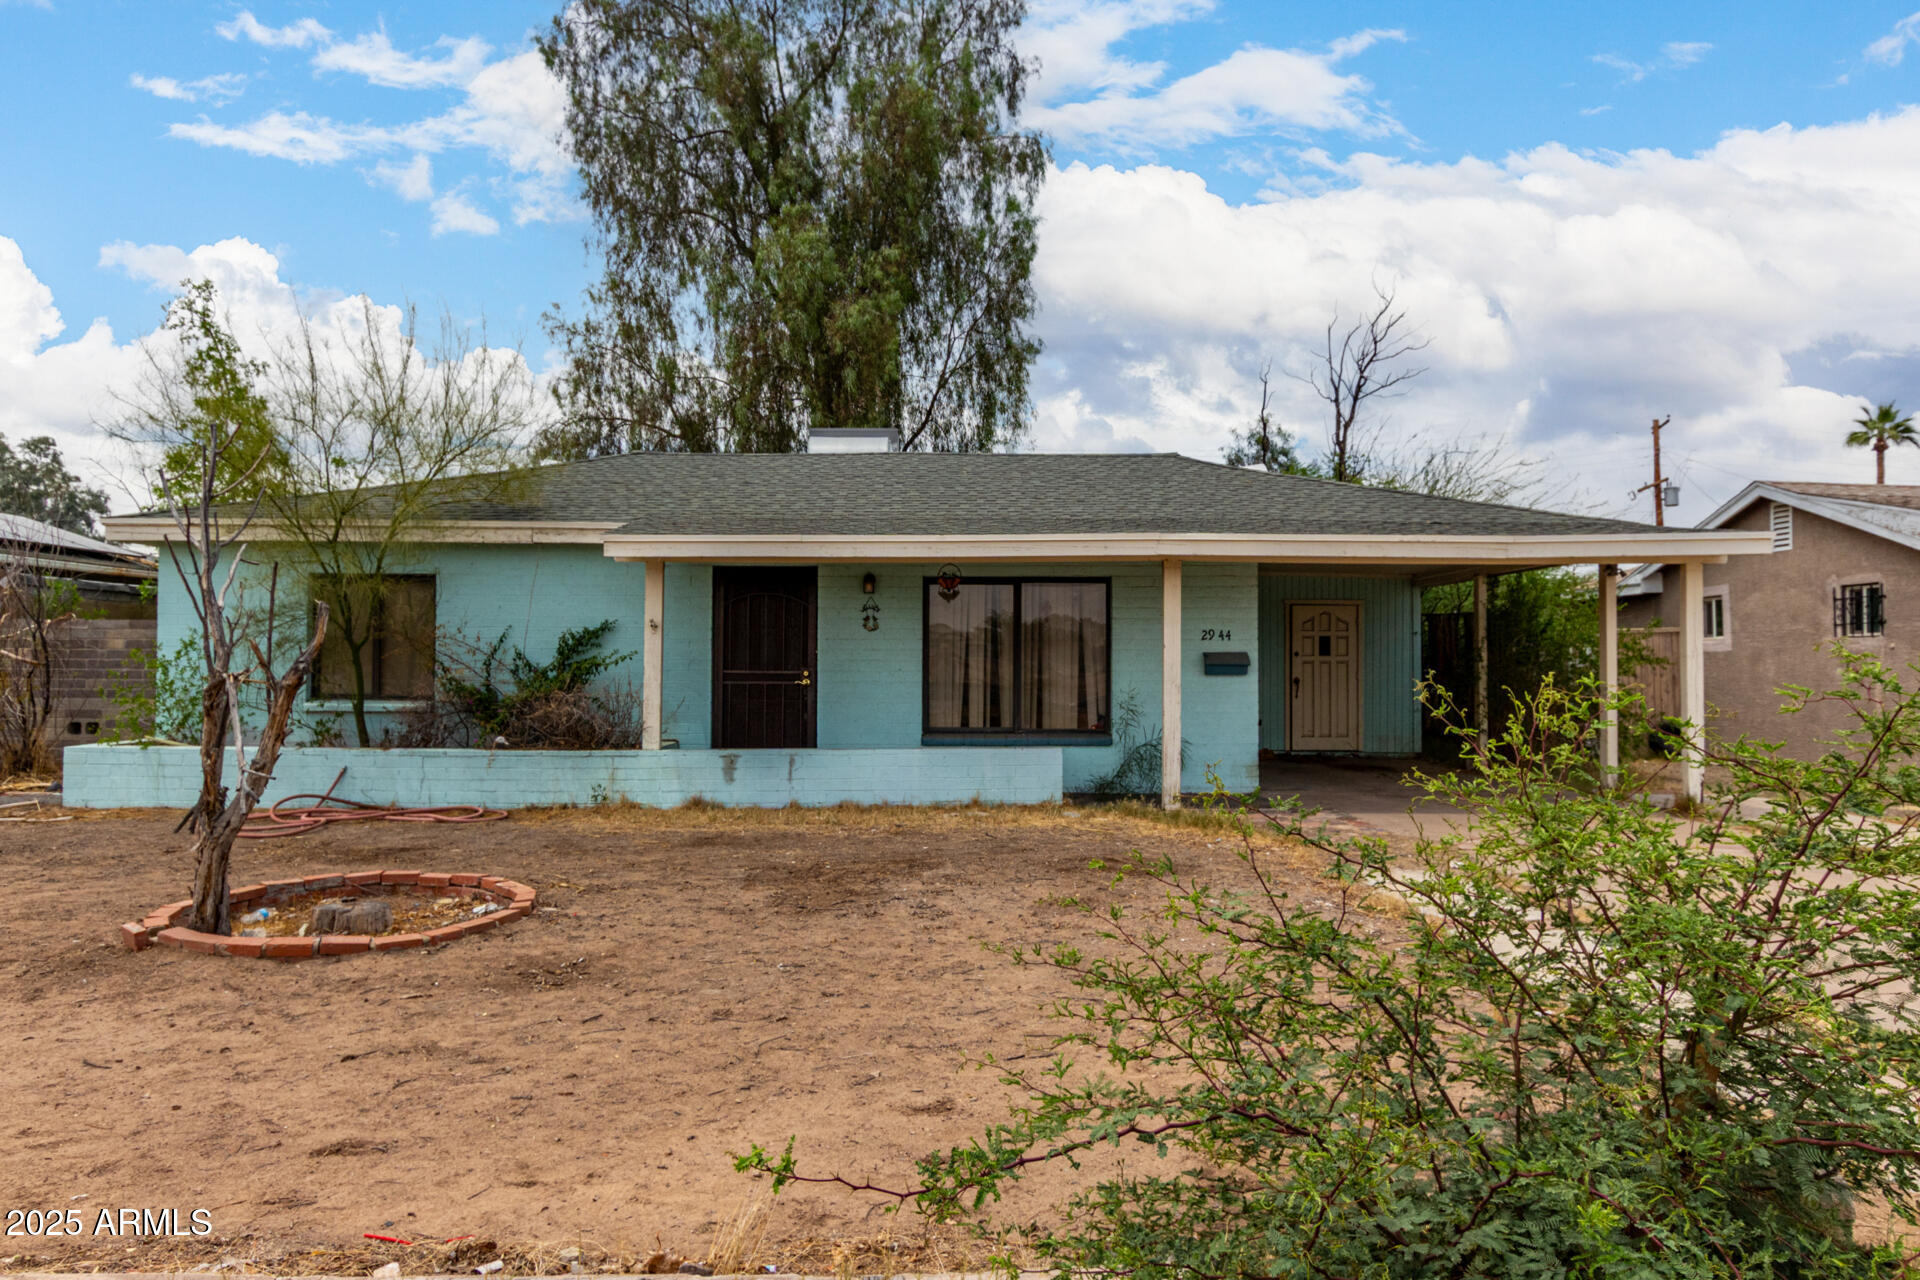
$259,999
3
bds
|
1
ba
|
1,241
sqft
|
built
1953
2944 W Northern Ave, Phoenix, AZ 85051
$-169
Cash flow
-3.4%
Cash-on-Cash Return
4.9%
Cap rate
0.6%
Rent to Value Ratio
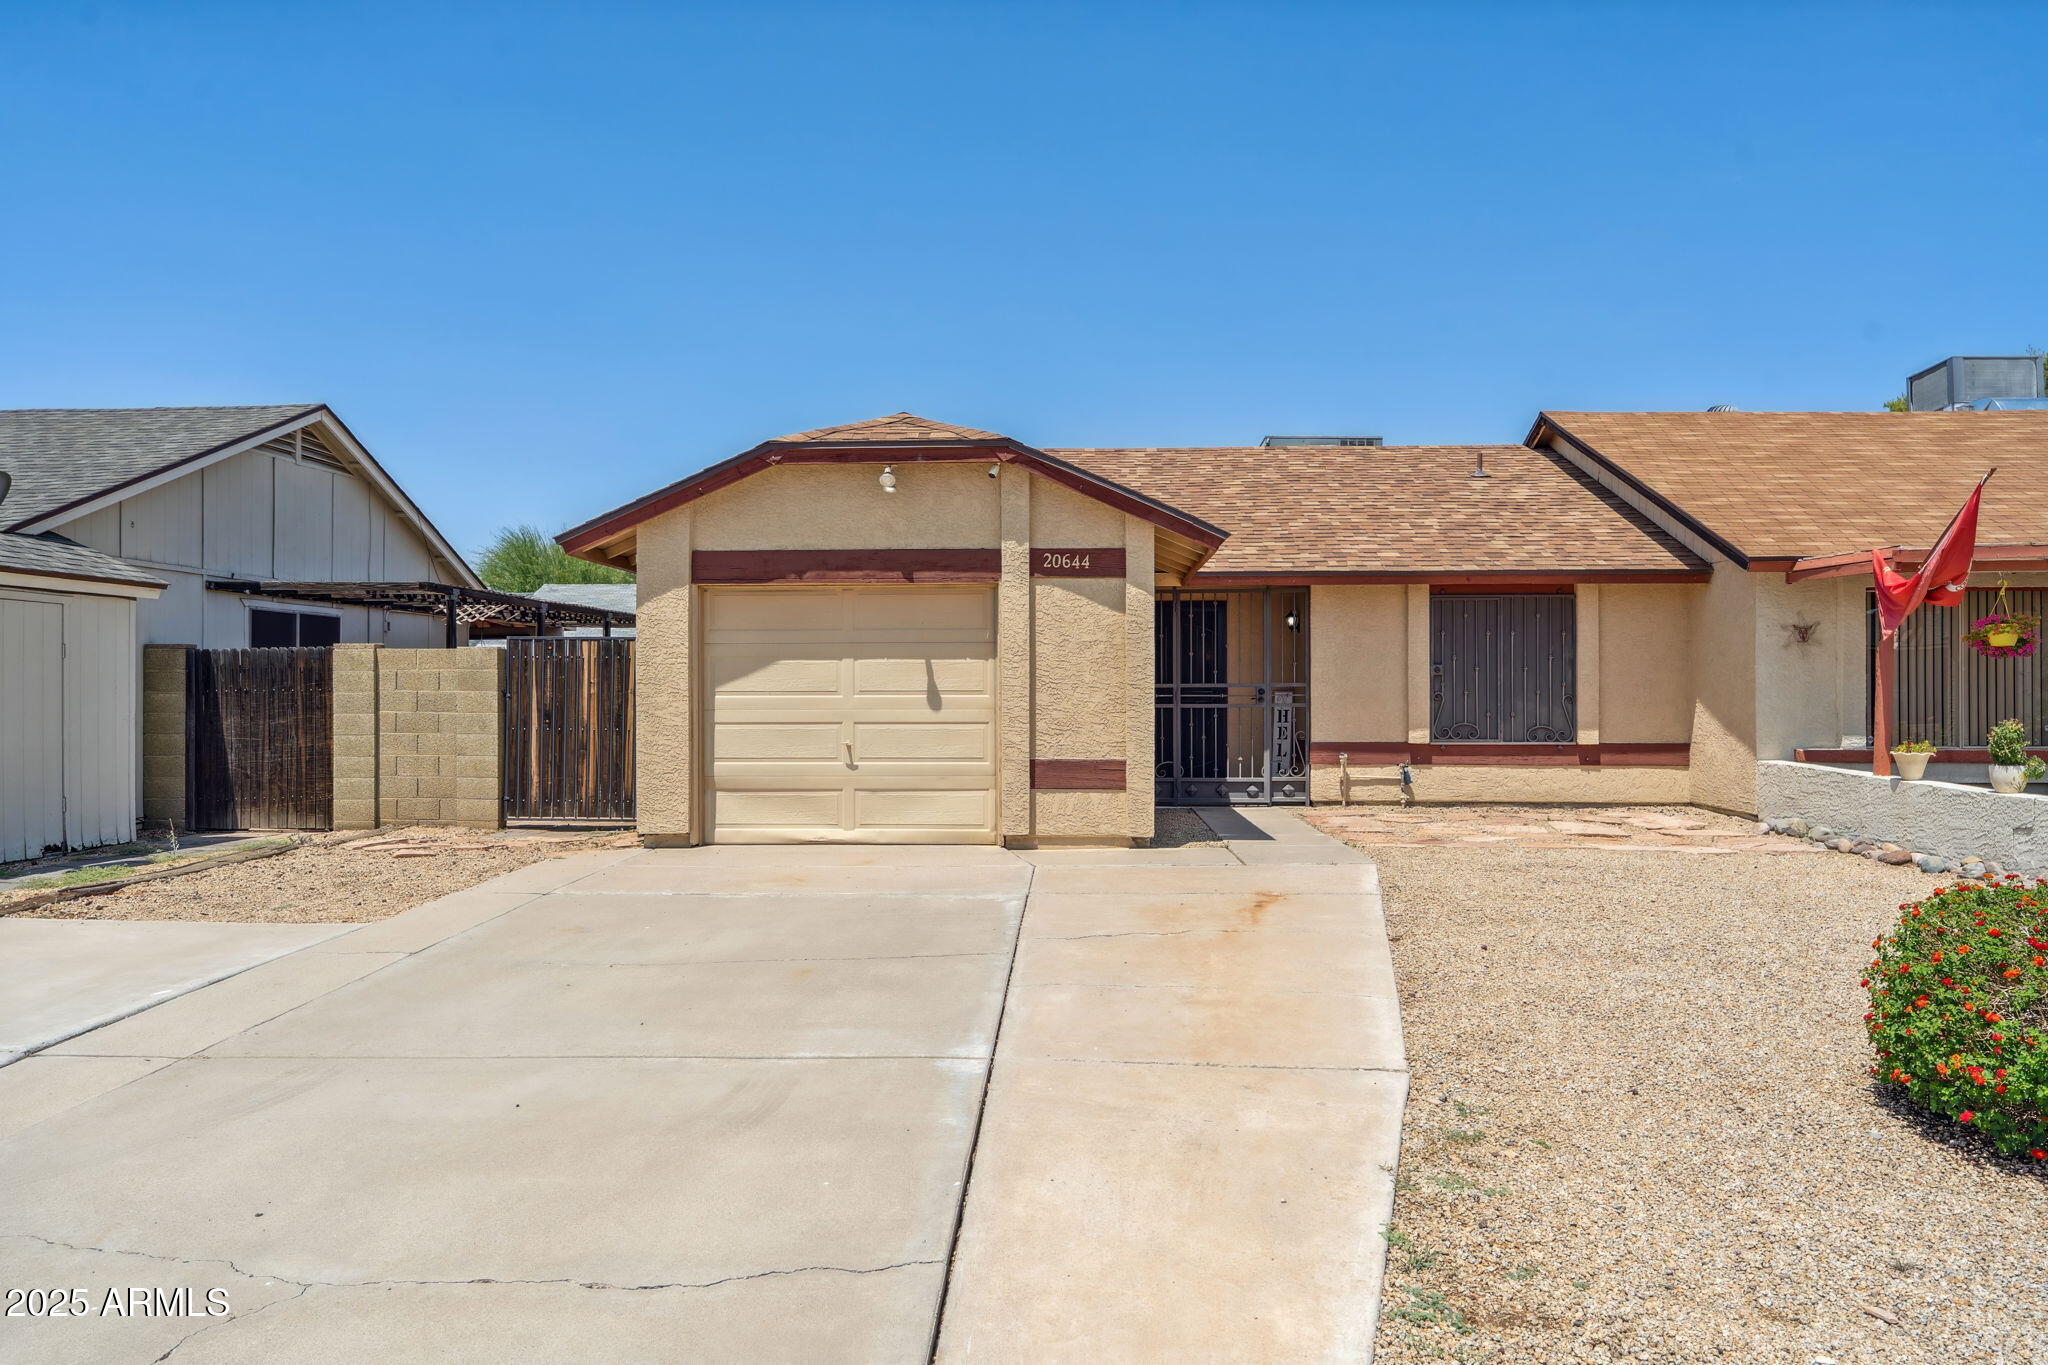
Active
$300,000
2
bds
|
1
ba
|
824
sqft
|
built
1982
20644 N 30th Dr, Phoenix, AZ 85027
$-373
Cash flow
-6.5%
Cash-on-Cash Return
4.2%
Cap rate
0.5%
Rent to Value Ratio
3,650 out of 4,024 properties for sale in Phoenix, AZ
Limited Results Shown
Create a free account, or log in to reveal all property listings and enjoy the complete experience.

Active
$800,000
3
bds
|
2
ba
|
2,336
sqft
|
built
1998
1307 E Galvin St, Phoenix, AZ 85086
$-1,798
Cash flow
-11.7%
Cash-on-Cash Return
3.0%
Cap rate
0.4%
Rent to Value Ratio
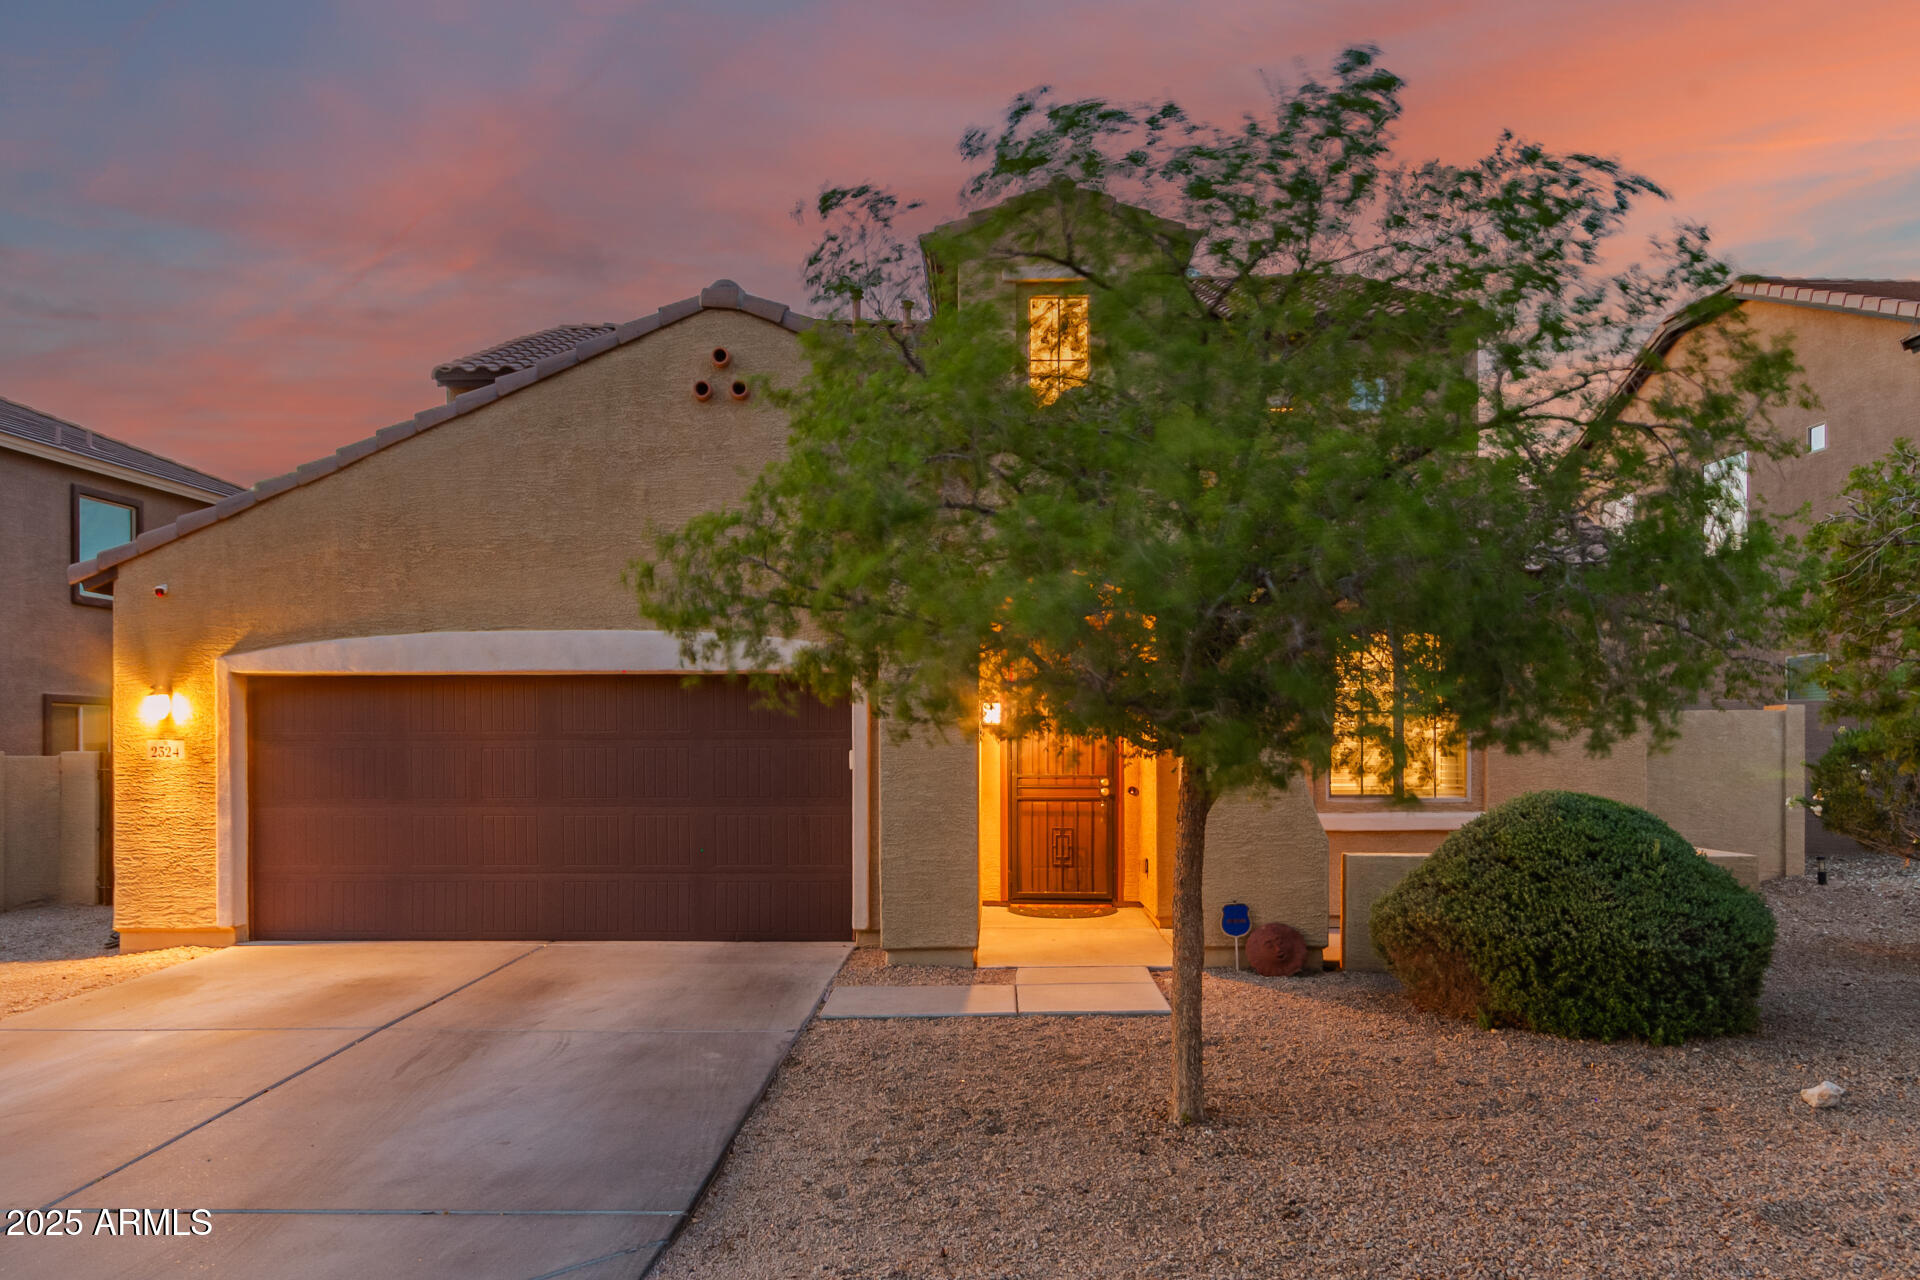
Active
$509,990
6
bds
|
4
ba
|
2,901
sqft
|
built
2012
2324 W Melody Dr, Phoenix, AZ 85041
$-777
Cash flow
-7.9%
Cash-on-Cash Return
3.8%
Cap rate
0.6%
Rent to Value Ratio
Active
$429,900
4
bds
|
3
ba
|
2,229
sqft
|
built
1987
8912 W Sheridan St, Phoenix, AZ 85037
$-434
Cash flow
-5.3%
Cash-on-Cash Return
4.5%
Cap rate
0.6%
Rent to Value Ratio

Active
$1,325,000
5
bds
|
4
ba
|
3,783
sqft
|
built
1980
5621 N 13th St, Phoenix, AZ 85014
$-2,262
Cash flow
-8.9%
Cash-on-Cash Return
3.6%
Cap rate
0.5%
Rent to Value Ratio
Active
$540,000
4
bds
|
2
ba
|
2,185
sqft
|
built
1974
5101 E Toniko Dr, Phoenix, AZ 85044
$-1,034
Cash flow
-10.0%
Cash-on-Cash Return
3.4%
Cap rate
0.5%
Rent to Value Ratio
Active
$500,000
2
bds
|
2
ba
|
1,455
sqft
|
built
1979
1701 E Camino Del Santo, Phoenix, AZ 85022
$-912
Cash flow
-9.5%
Cash-on-Cash Return
3.5%
Cap rate
0.5%
Rent to Value Ratio
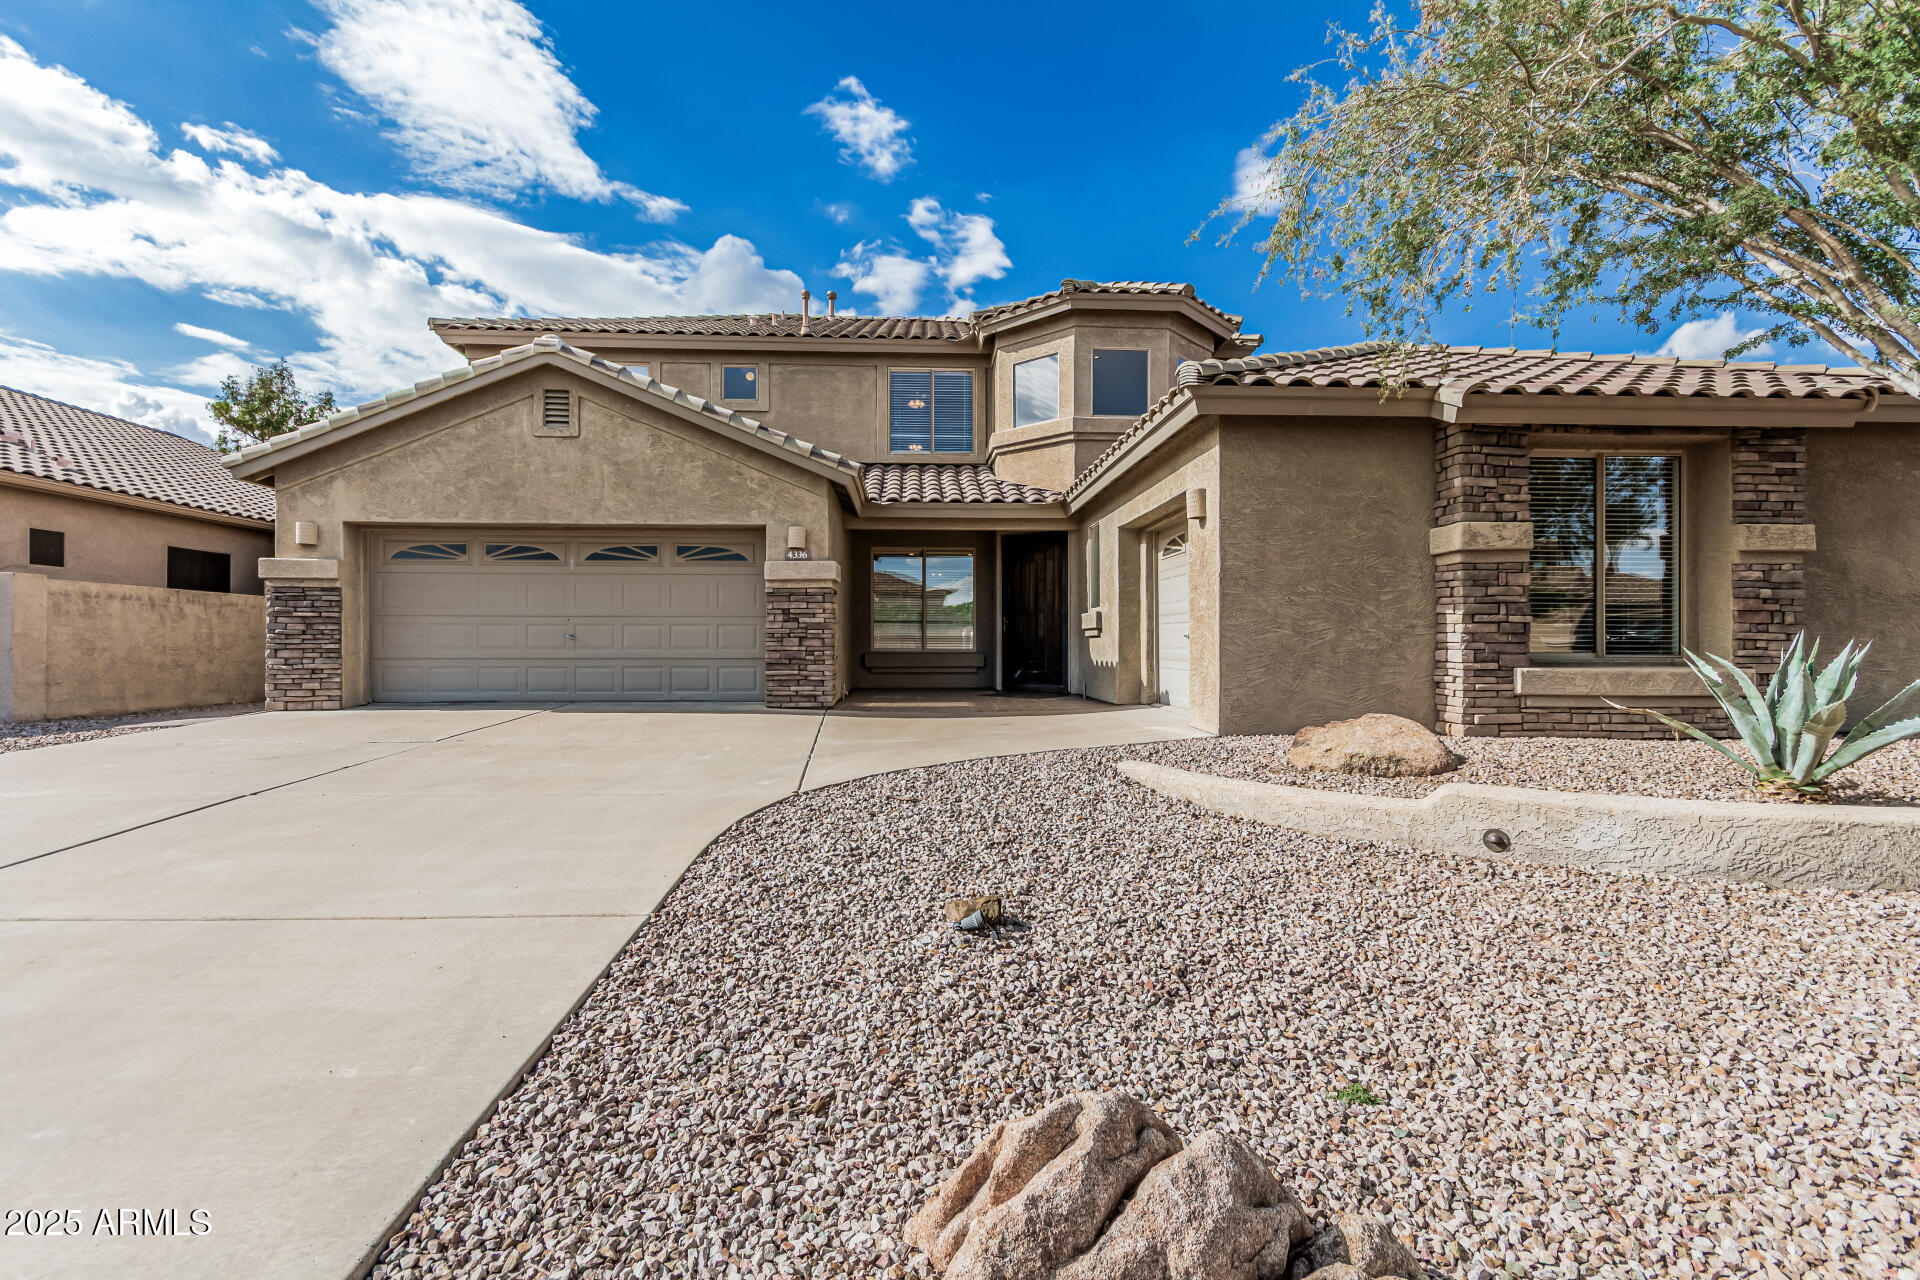
Active
$710,000
4
bds
|
4
ba
|
3,250
sqft
|
built
2000
4336 W Hackamore Dr, Phoenix, AZ 85083
$-1,572
Cash flow
-11.6%
Cash-on-Cash Return
3.0%
Cap rate
0.4%
Rent to Value Ratio
Active
$385,000
2
bds
|
1
ba
|
858
sqft
|
built
1923
1424 E Garfield St, Phoenix, AZ 85006
$-777
Cash flow
-10.5%
Cash-on-Cash Return
3.3%
Cap rate
0.4%
Rent to Value Ratio
Active
$1,535,000
6
bds
|
4
ba
|
5,028
sqft
|
built
1984
12015 S Tuzigoot Dr, Phoenix, AZ 85044
$-3,027
Cash flow
-10.3%
Cash-on-Cash Return
3.3%
Cap rate
0.5%
Rent to Value Ratio
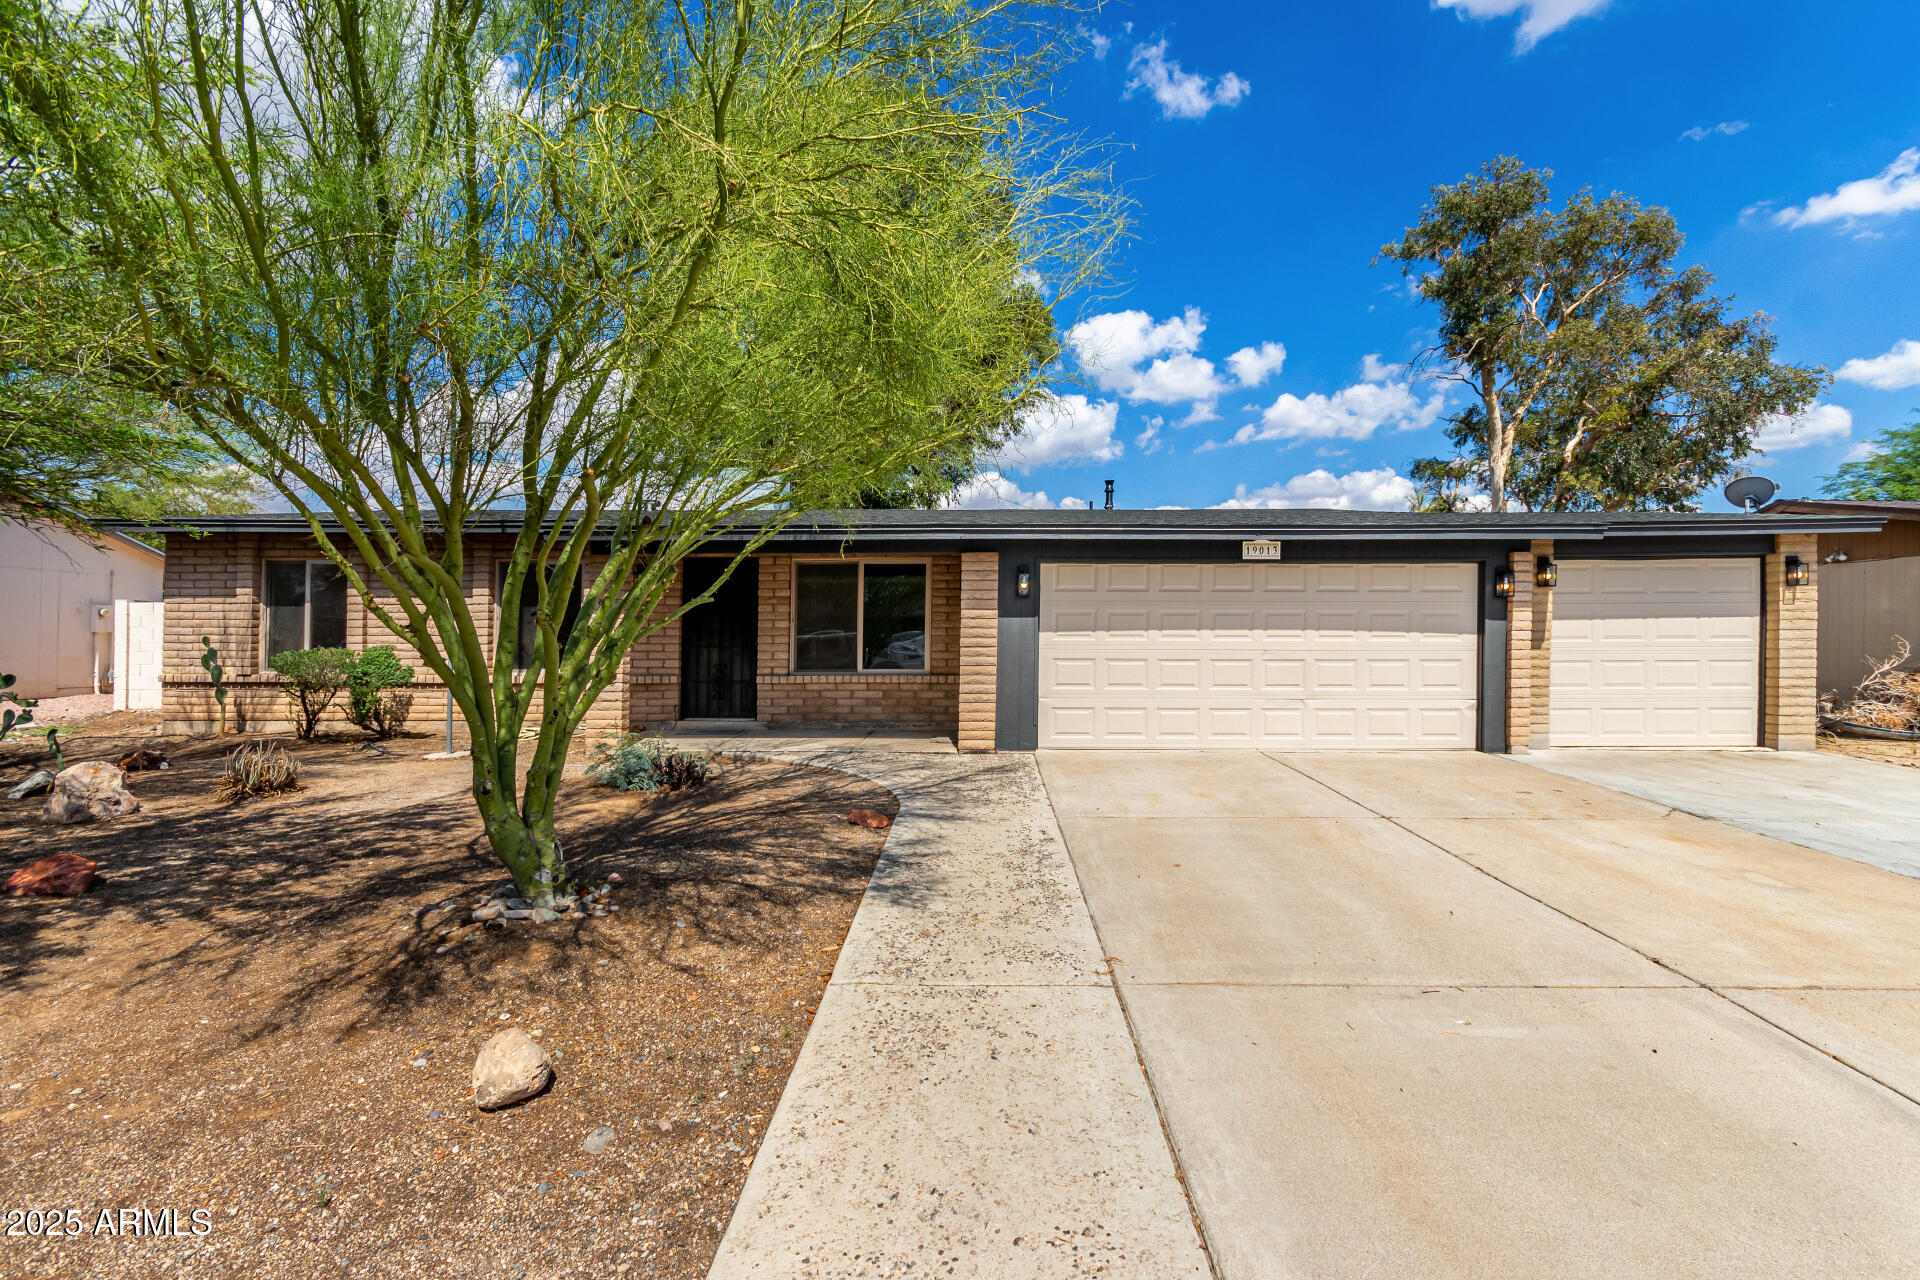
Active
$470,000
4
bds
|
2
ba
|
1,813
sqft
|
built
1976
19013 N 18th Ave, Phoenix, AZ 85027
$-944
Cash flow
-10.5%
Cash-on-Cash Return
3.3%
Cap rate
0.4%
Rent to Value Ratio
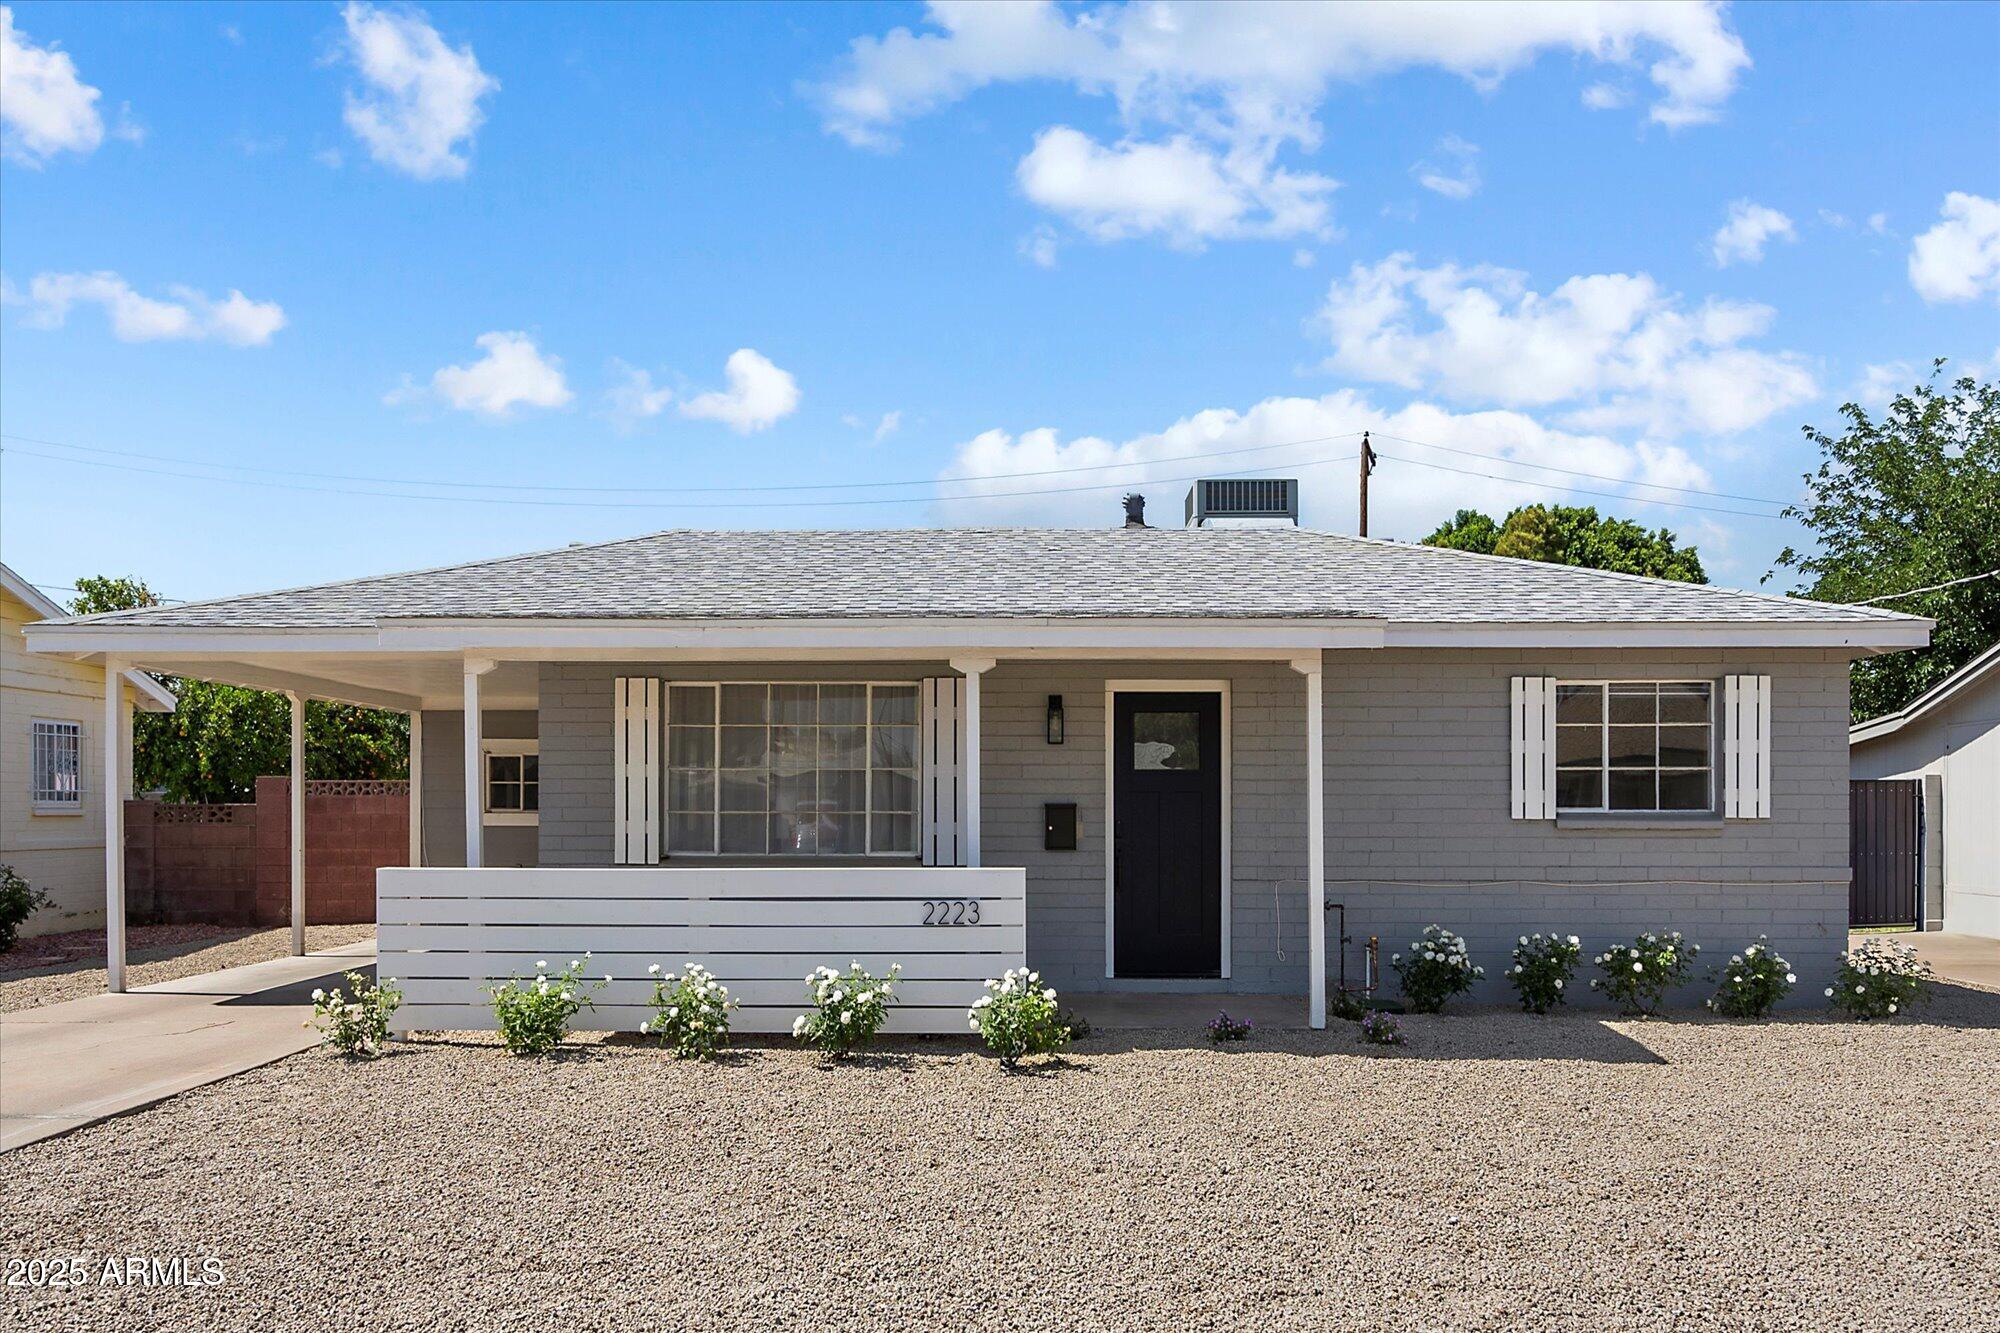
Active
$489,900
2
bds
|
1
ba
|
875
sqft
|
built
1953
2223 E Roma Ave, Phoenix, AZ 85016
$-1,224
Cash flow
-13.0%
Cash-on-Cash Return
2.7%
Cap rate
0.4%
Rent to Value Ratio

Active
$1,499,900
5
bds
|
5
ba
|
4,319
sqft
|
built
2006
42037 N Bradon Way, Phoenix, AZ 85086
$-3,149
Cash flow
-11.0%
Cash-on-Cash Return
3.2%
Cap rate
0.5%
Rent to Value Ratio

Active
$600,000
4
bds
|
3
ba
|
2,345
sqft
|
built
1987
1813 E Sheena Dr, Phoenix, AZ 85022
$-1,088
Cash flow
-9.5%
Cash-on-Cash Return
3.5%
Cap rate
0.5%
Rent to Value Ratio

Active
$975,000
4
bds
|
4
ba
|
3,143
sqft
|
built
2020
1337 E Paseo Way, Phoenix, AZ 85042
$-2,721
Cash flow
-14.6%
Cash-on-Cash Return
2.3%
Cap rate
0.4%
Rent to Value Ratio
Active
$300,000
2
bds
|
1
ba
|
824
sqft
|
built
1982
20644 N 30th Dr, Phoenix, AZ 85027
$-373
Cash flow
-6.5%
Cash-on-Cash Return
4.2%
Cap rate
0.5%
Rent to Value Ratio

Active
$530,000
5
bds
|
3
ba
|
2,224
sqft
|
built
1960
19615 N 18th Dr, Phoenix, AZ 85027
$-1,212
Cash flow
-11.9%
Cash-on-Cash Return
2.9%
Cap rate
0.4%
Rent to Value Ratio
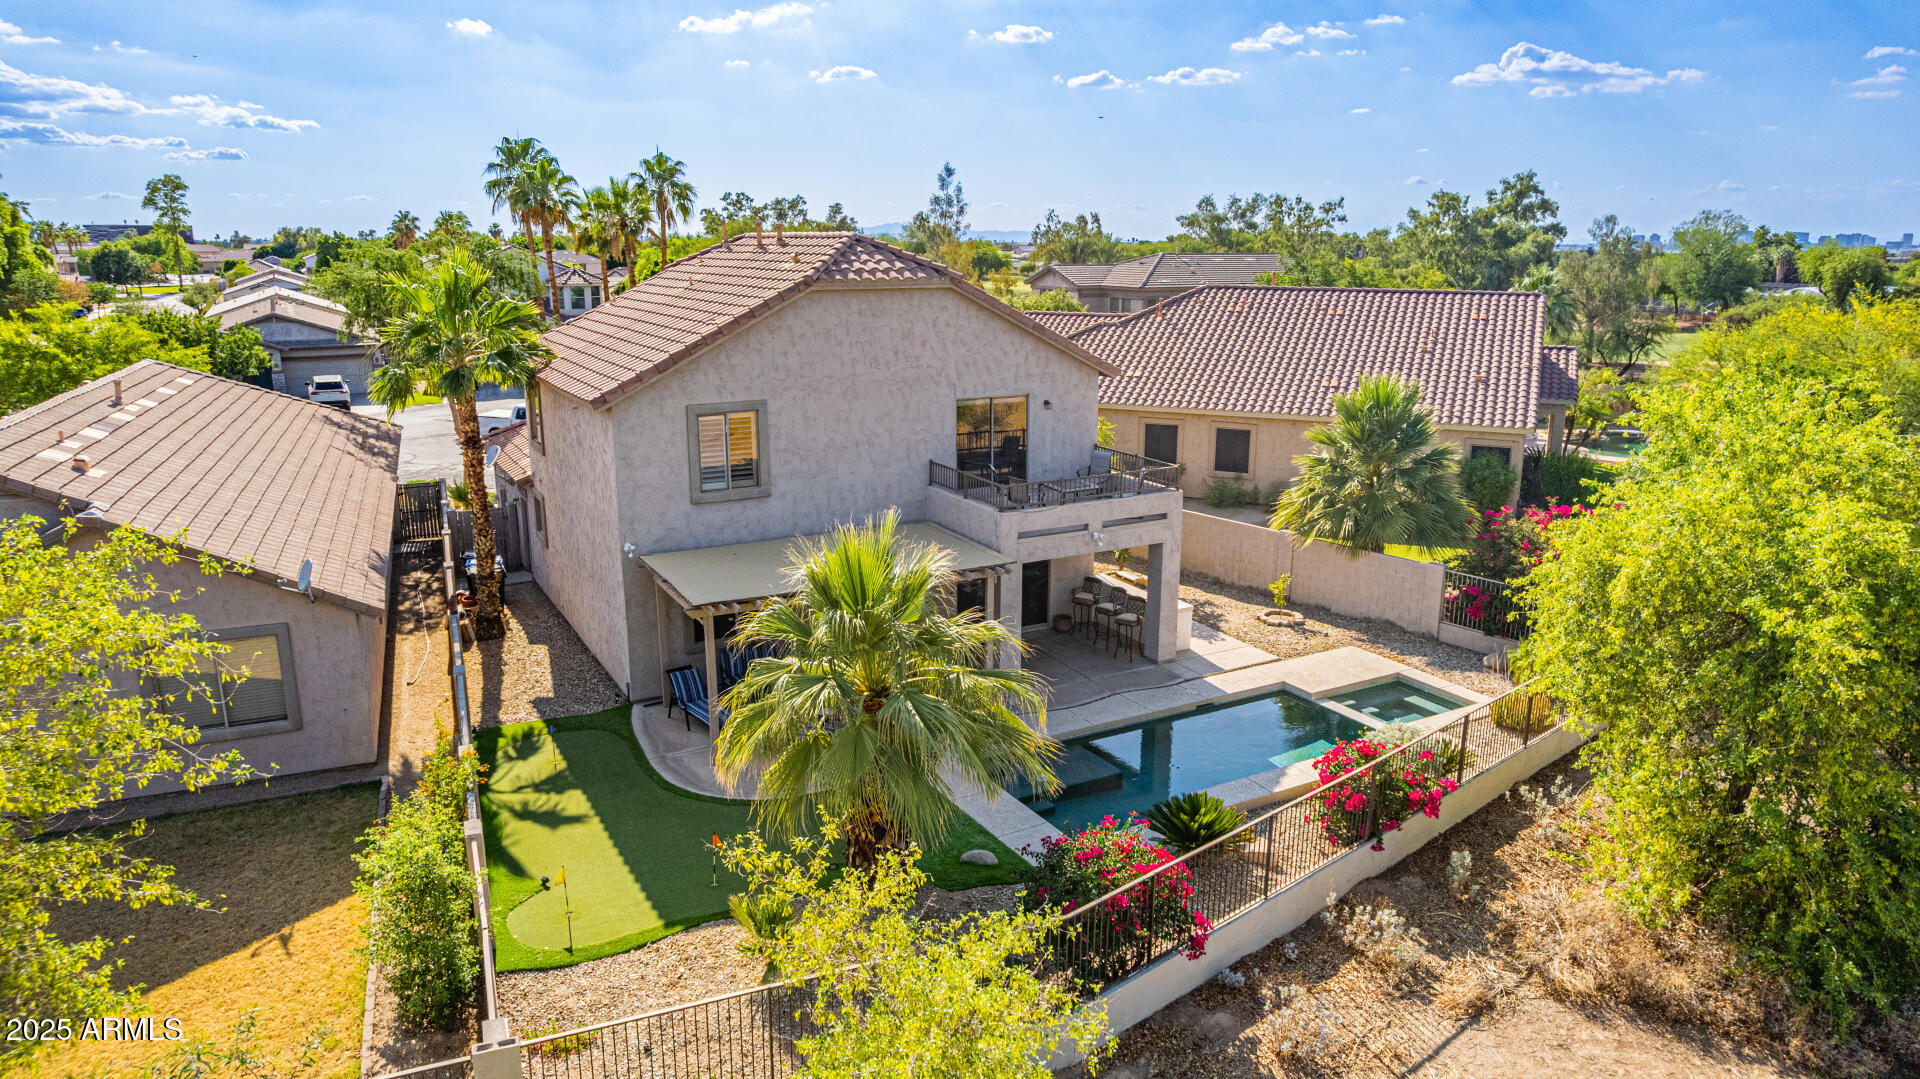
Active
$625,000
3
bds
|
3
ba
|
2,275
sqft
|
built
1987
16805 S 29th Pl, Phoenix, AZ 85048
$-1,052
Cash flow
-8.8%
Cash-on-Cash Return
3.7%
Cap rate
0.5%
Rent to Value Ratio

Active
$975,000
3
bds
|
2
ba
|
1,730
sqft
|
built
1958
4320 N 35th St, Phoenix, AZ 85018
$-1,787
Cash flow
-9.6%
Cash-on-Cash Return
3.5%
Cap rate
0.5%
Rent to Value Ratio
Active
$799,000
4
bds
|
3
ba
|
2,614
sqft
|
built
1978
3043 E Hartford Ave, Phoenix, AZ 85032
$-2,711
Cash flow
-17.7%
Cash-on-Cash Return
1.6%
Cap rate
0.2%
Rent to Value Ratio
Active
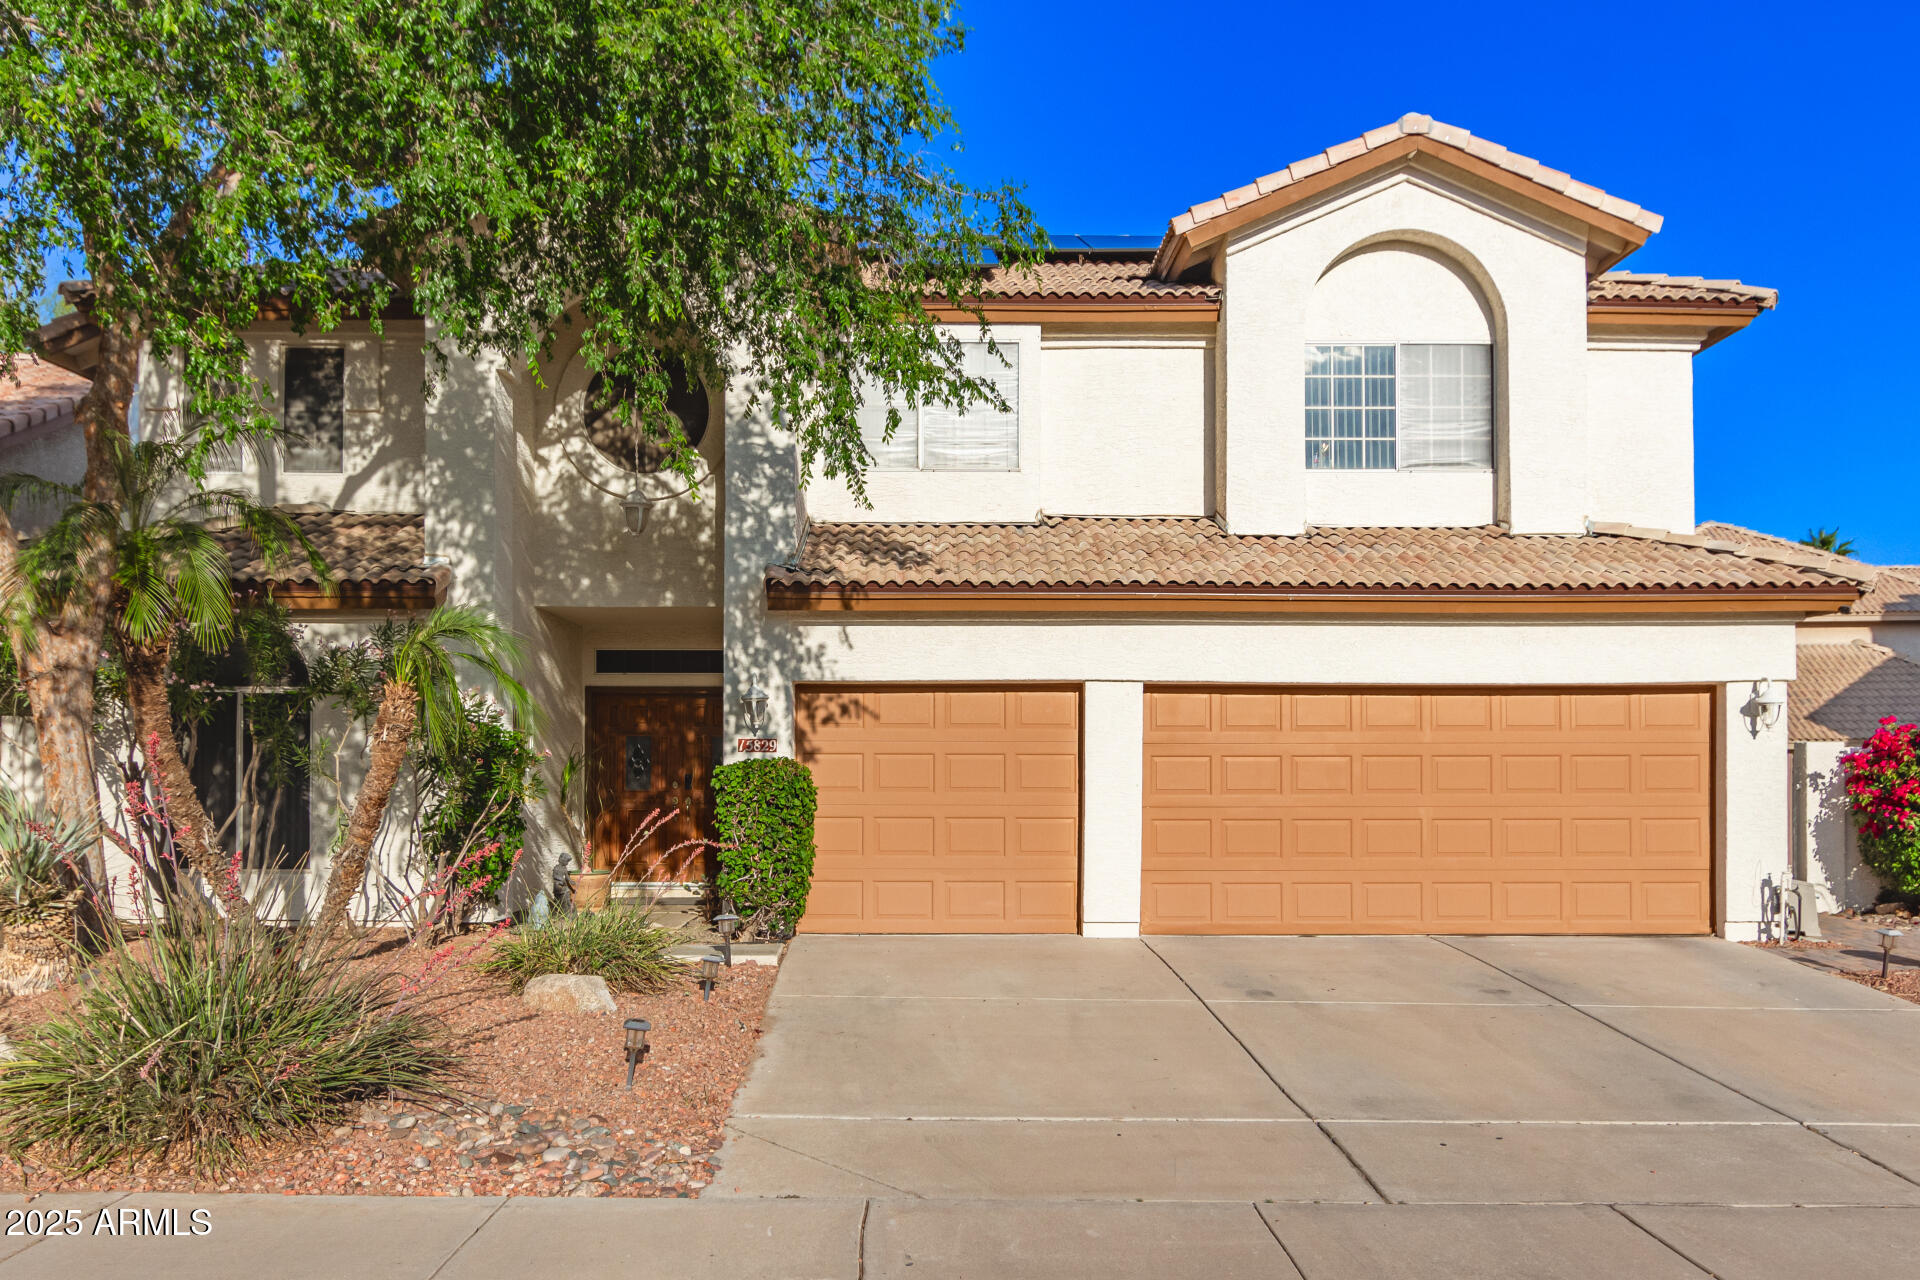
$747,000
5
bds
|
3
ba
|
2,986
sqft
|
built
1990
15829 S 13th Pl, Phoenix, AZ 85048
$-1,691
Cash flow
-11.8%
Cash-on-Cash Return
3.0%
Cap rate
0.4%
Rent to Value Ratio

Active
$1,295,000
5
bds
|
3
ba
|
2,779
sqft
|
built
2021
2028 E Chama Dr, Phoenix, AZ 85024
$-3,027
Cash flow
-12.2%
Cash-on-Cash Return
2.9%
Cap rate
0.4%
Rent to Value Ratio
Active
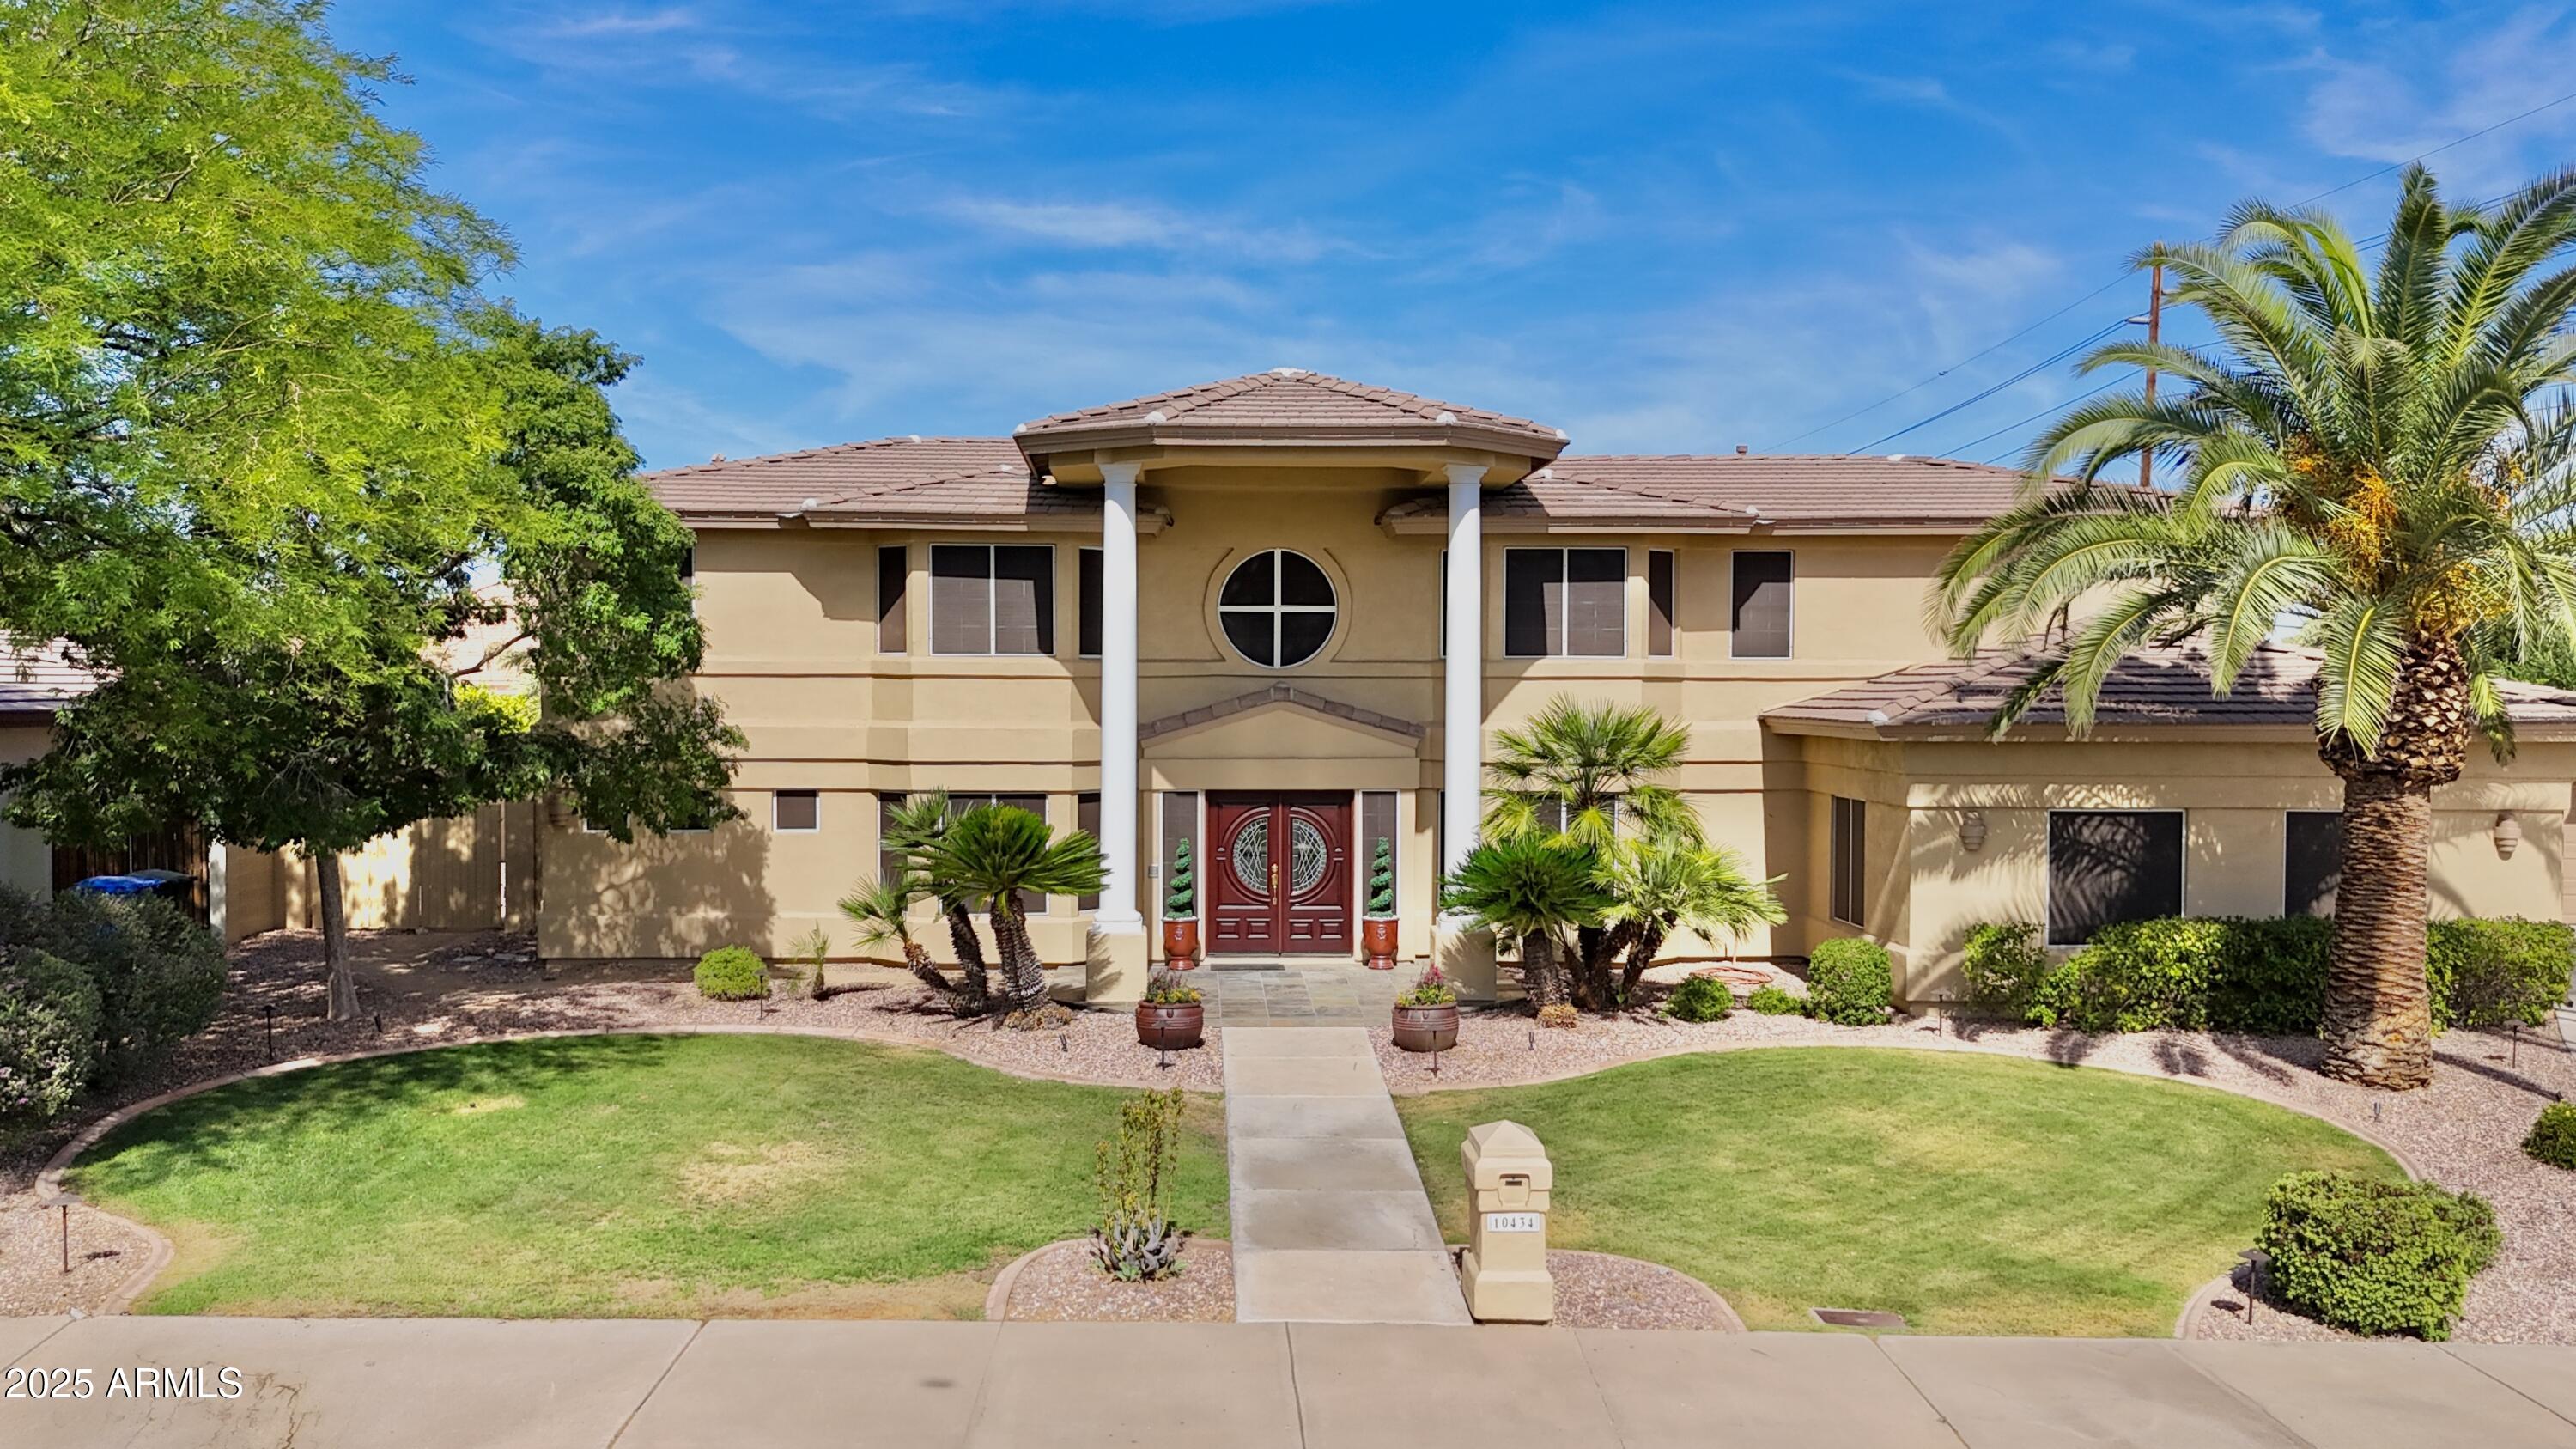
$1,970,000
5
bds
|
6
ba
|
4,459
sqft
|
built
2001
10434 N 44th St, Phoenix, AZ 85028
$-4,935
Cash flow
-13.1%
Cash-on-Cash Return
2.7%
Cap rate
0.4%
Rent to Value Ratio
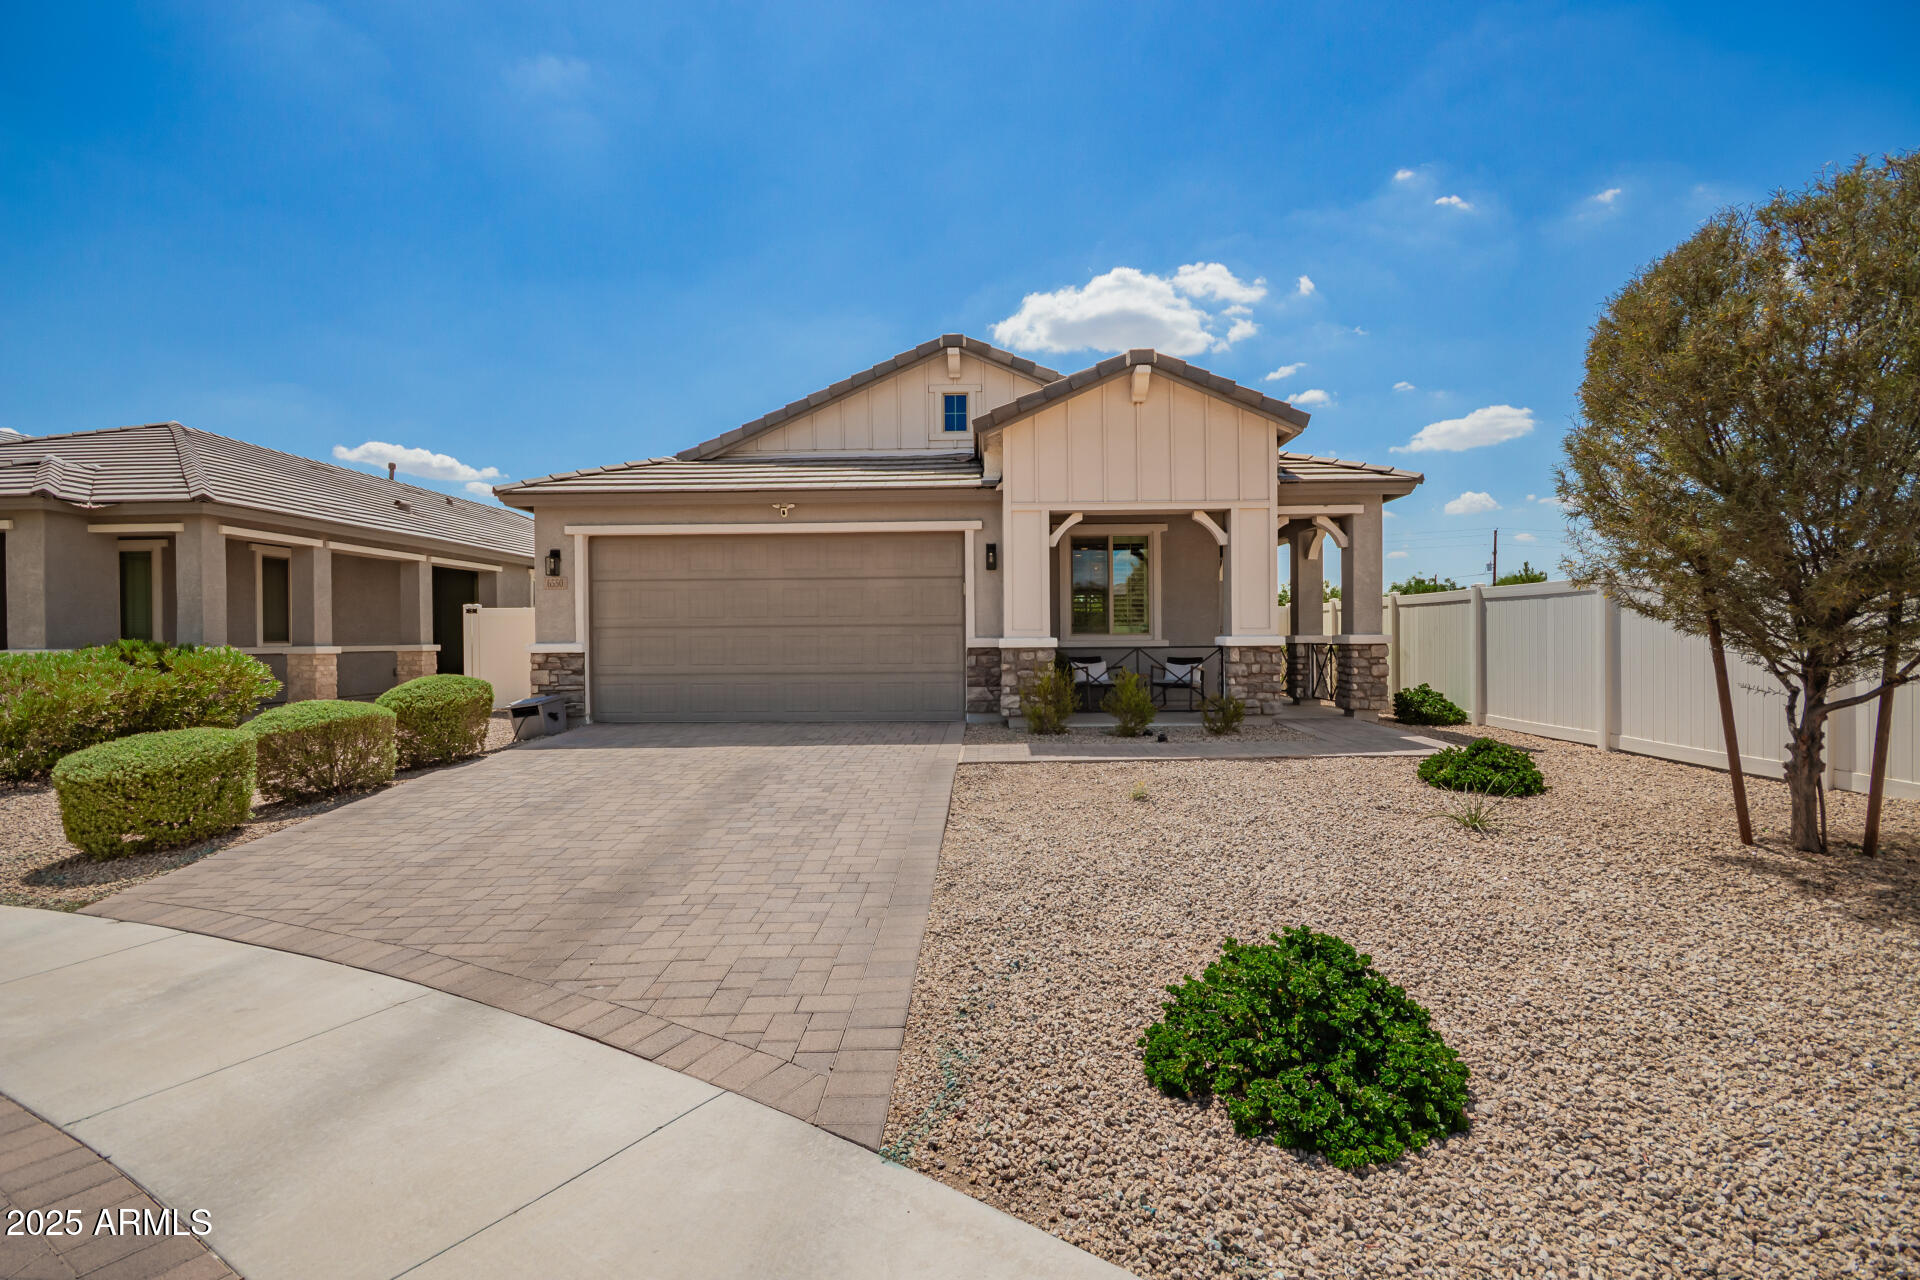
Active
$484,000
4
bds
|
2
ba
|
1,879
sqft
|
built
2019
6550 S 24th Pl, Phoenix, AZ 85042
$-1,000
Cash flow
-10.8%
Cash-on-Cash Return
3.2%
Cap rate
0.5%
Rent to Value Ratio

Active
$630,000
2
bds
|
3
ba
|
1,718
sqft
|
built
2016
325 E Coronado Rd, Phoenix, AZ 85004
$-1,527
Cash flow
-12.6%
Cash-on-Cash Return
2.8%
Cap rate
0.5%
Rent to Value Ratio

Active
$1,199,999
2
bds
|
3
ba
|
1,781
sqft
|
built
2023
5250 E Deer Valley Dr, Phoenix, AZ 85054
$-4,786
Cash flow
-20.8%
Cash-on-Cash Return
0.9%
Cap rate
0.3%
Rent to Value Ratio
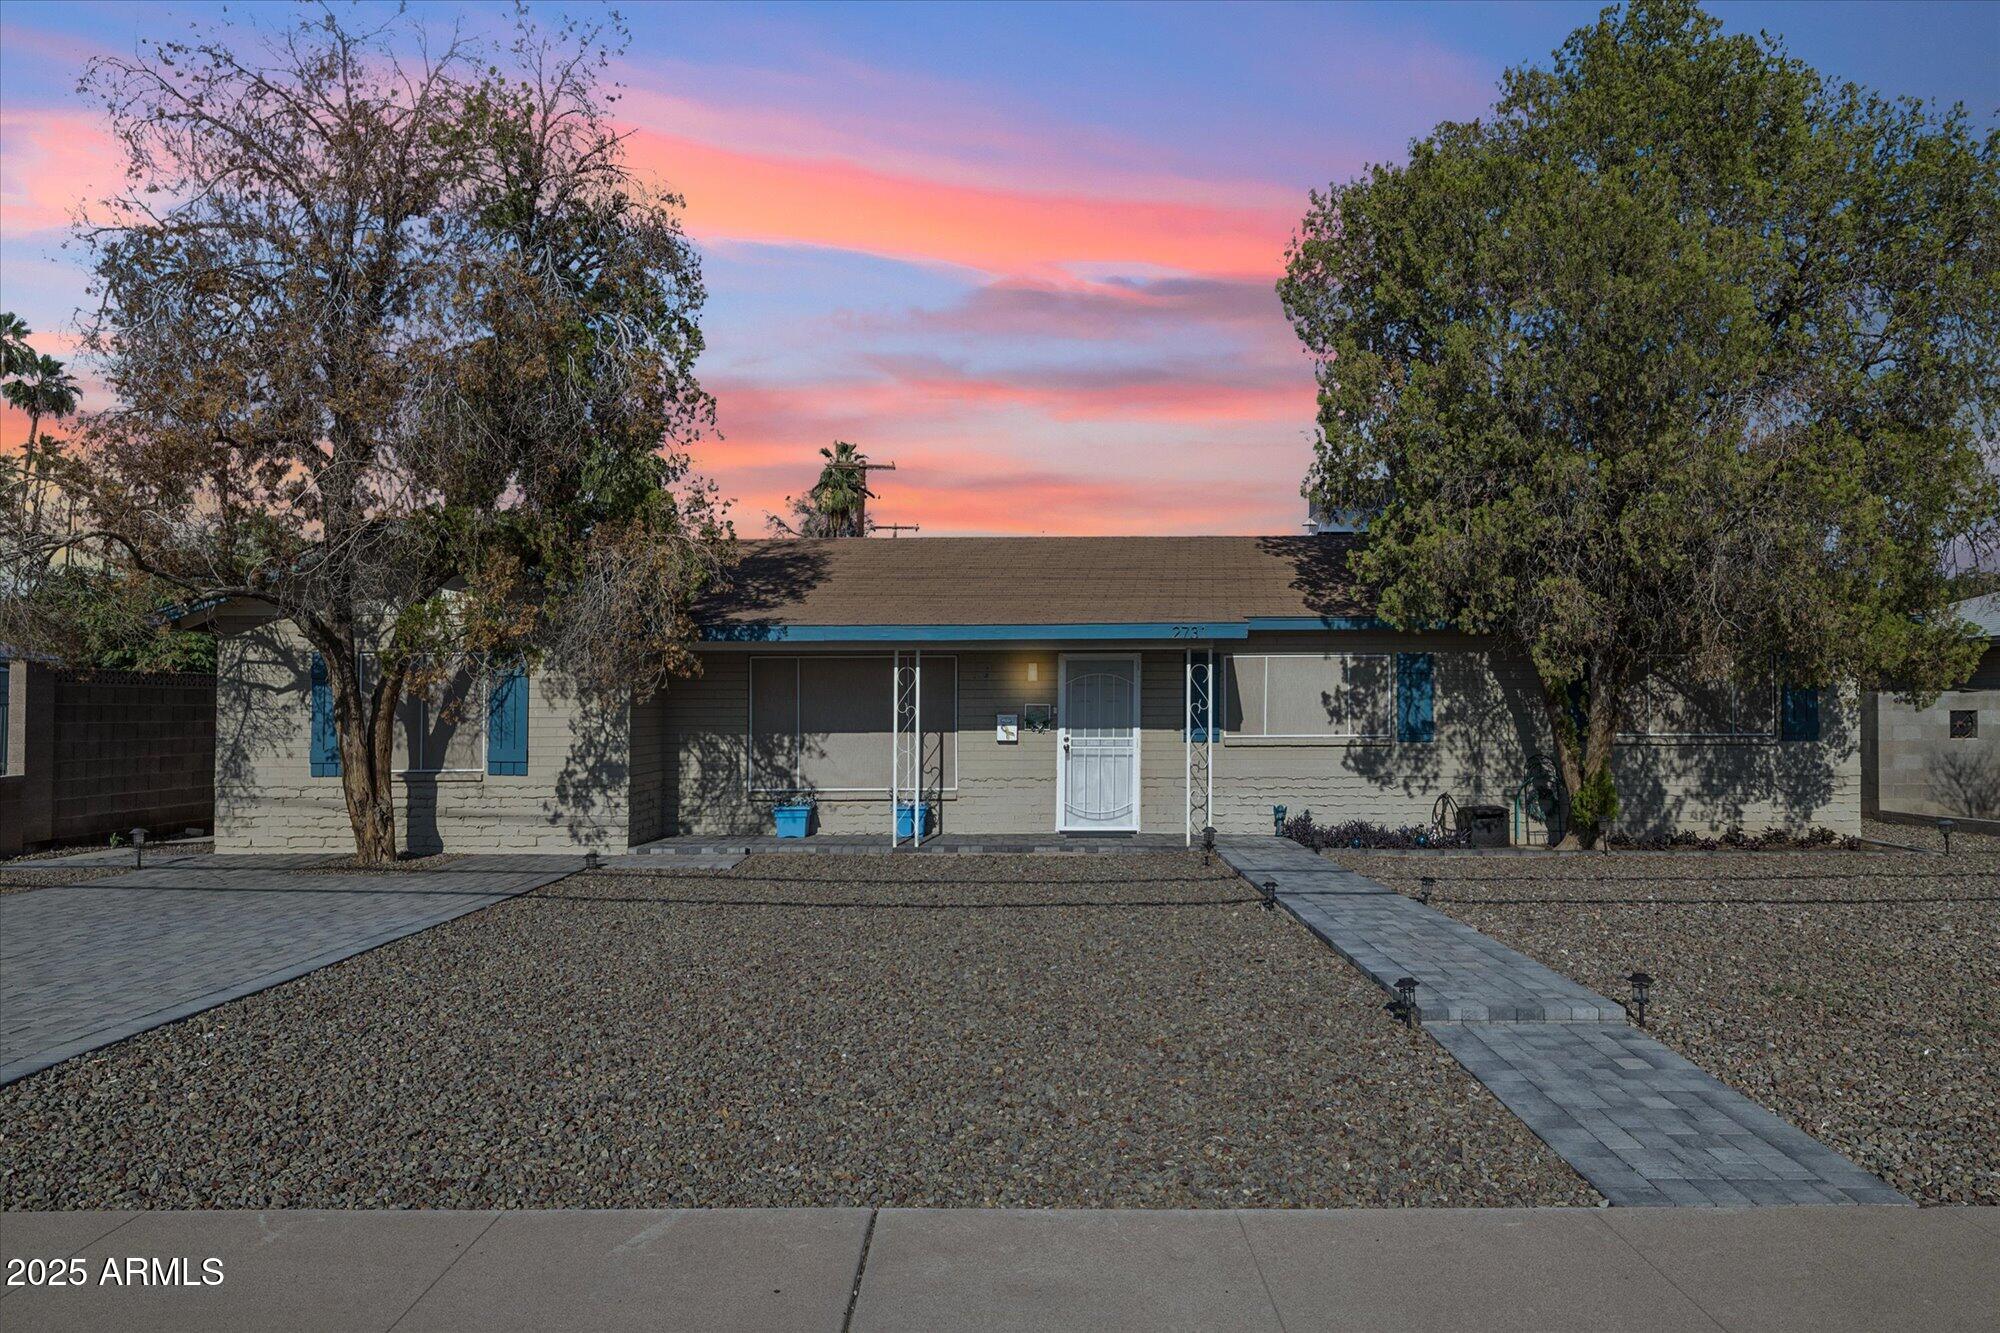
Active
$649,000
4
bds
|
3
ba
|
2,060
sqft
|
built
1957
2731 N 23rd Ave, Phoenix, AZ 85009
$-1,086
Cash flow
-8.7%
Cash-on-Cash Return
3.7%
Cap rate
0.5%
Rent to Value Ratio
Active
$3,150,000
3
bds
|
4
ba
|
3,196
sqft
|
built
1986
3186 E Stella Ln, Phoenix, AZ 85016
$-13,200
Cash flow
-21.9%
Cash-on-Cash Return
0.7%
Cap rate
0.1%
Rent to Value Ratio
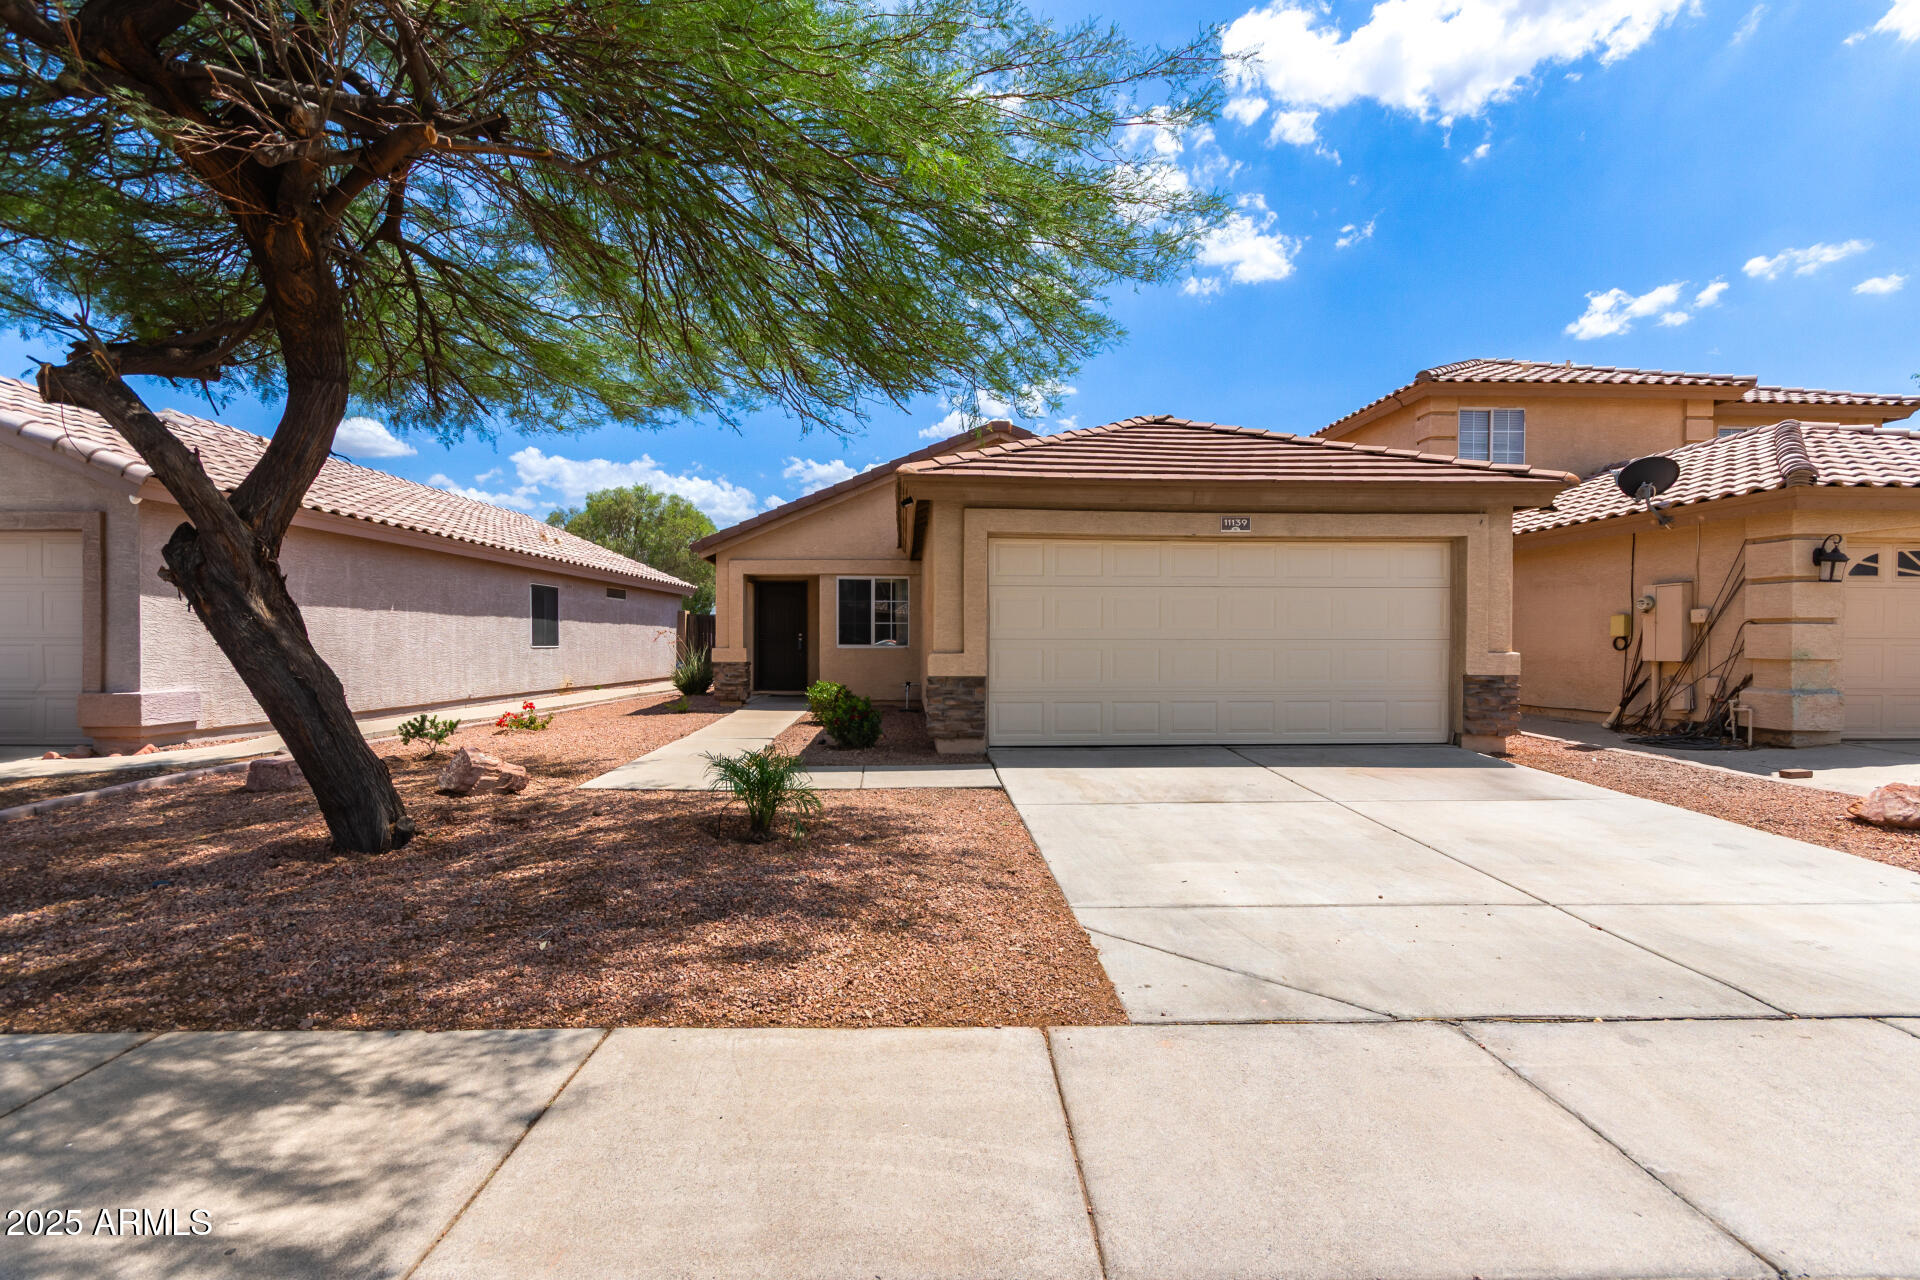
Active
$342,500
3
bds
|
2
ba
|
1,090
sqft
|
built
1999
11139 W Devonshire Ave, Phoenix, AZ 85037
$-520
Cash flow
-7.9%
Cash-on-Cash Return
3.9%
Cap rate
0.5%
Rent to Value Ratio
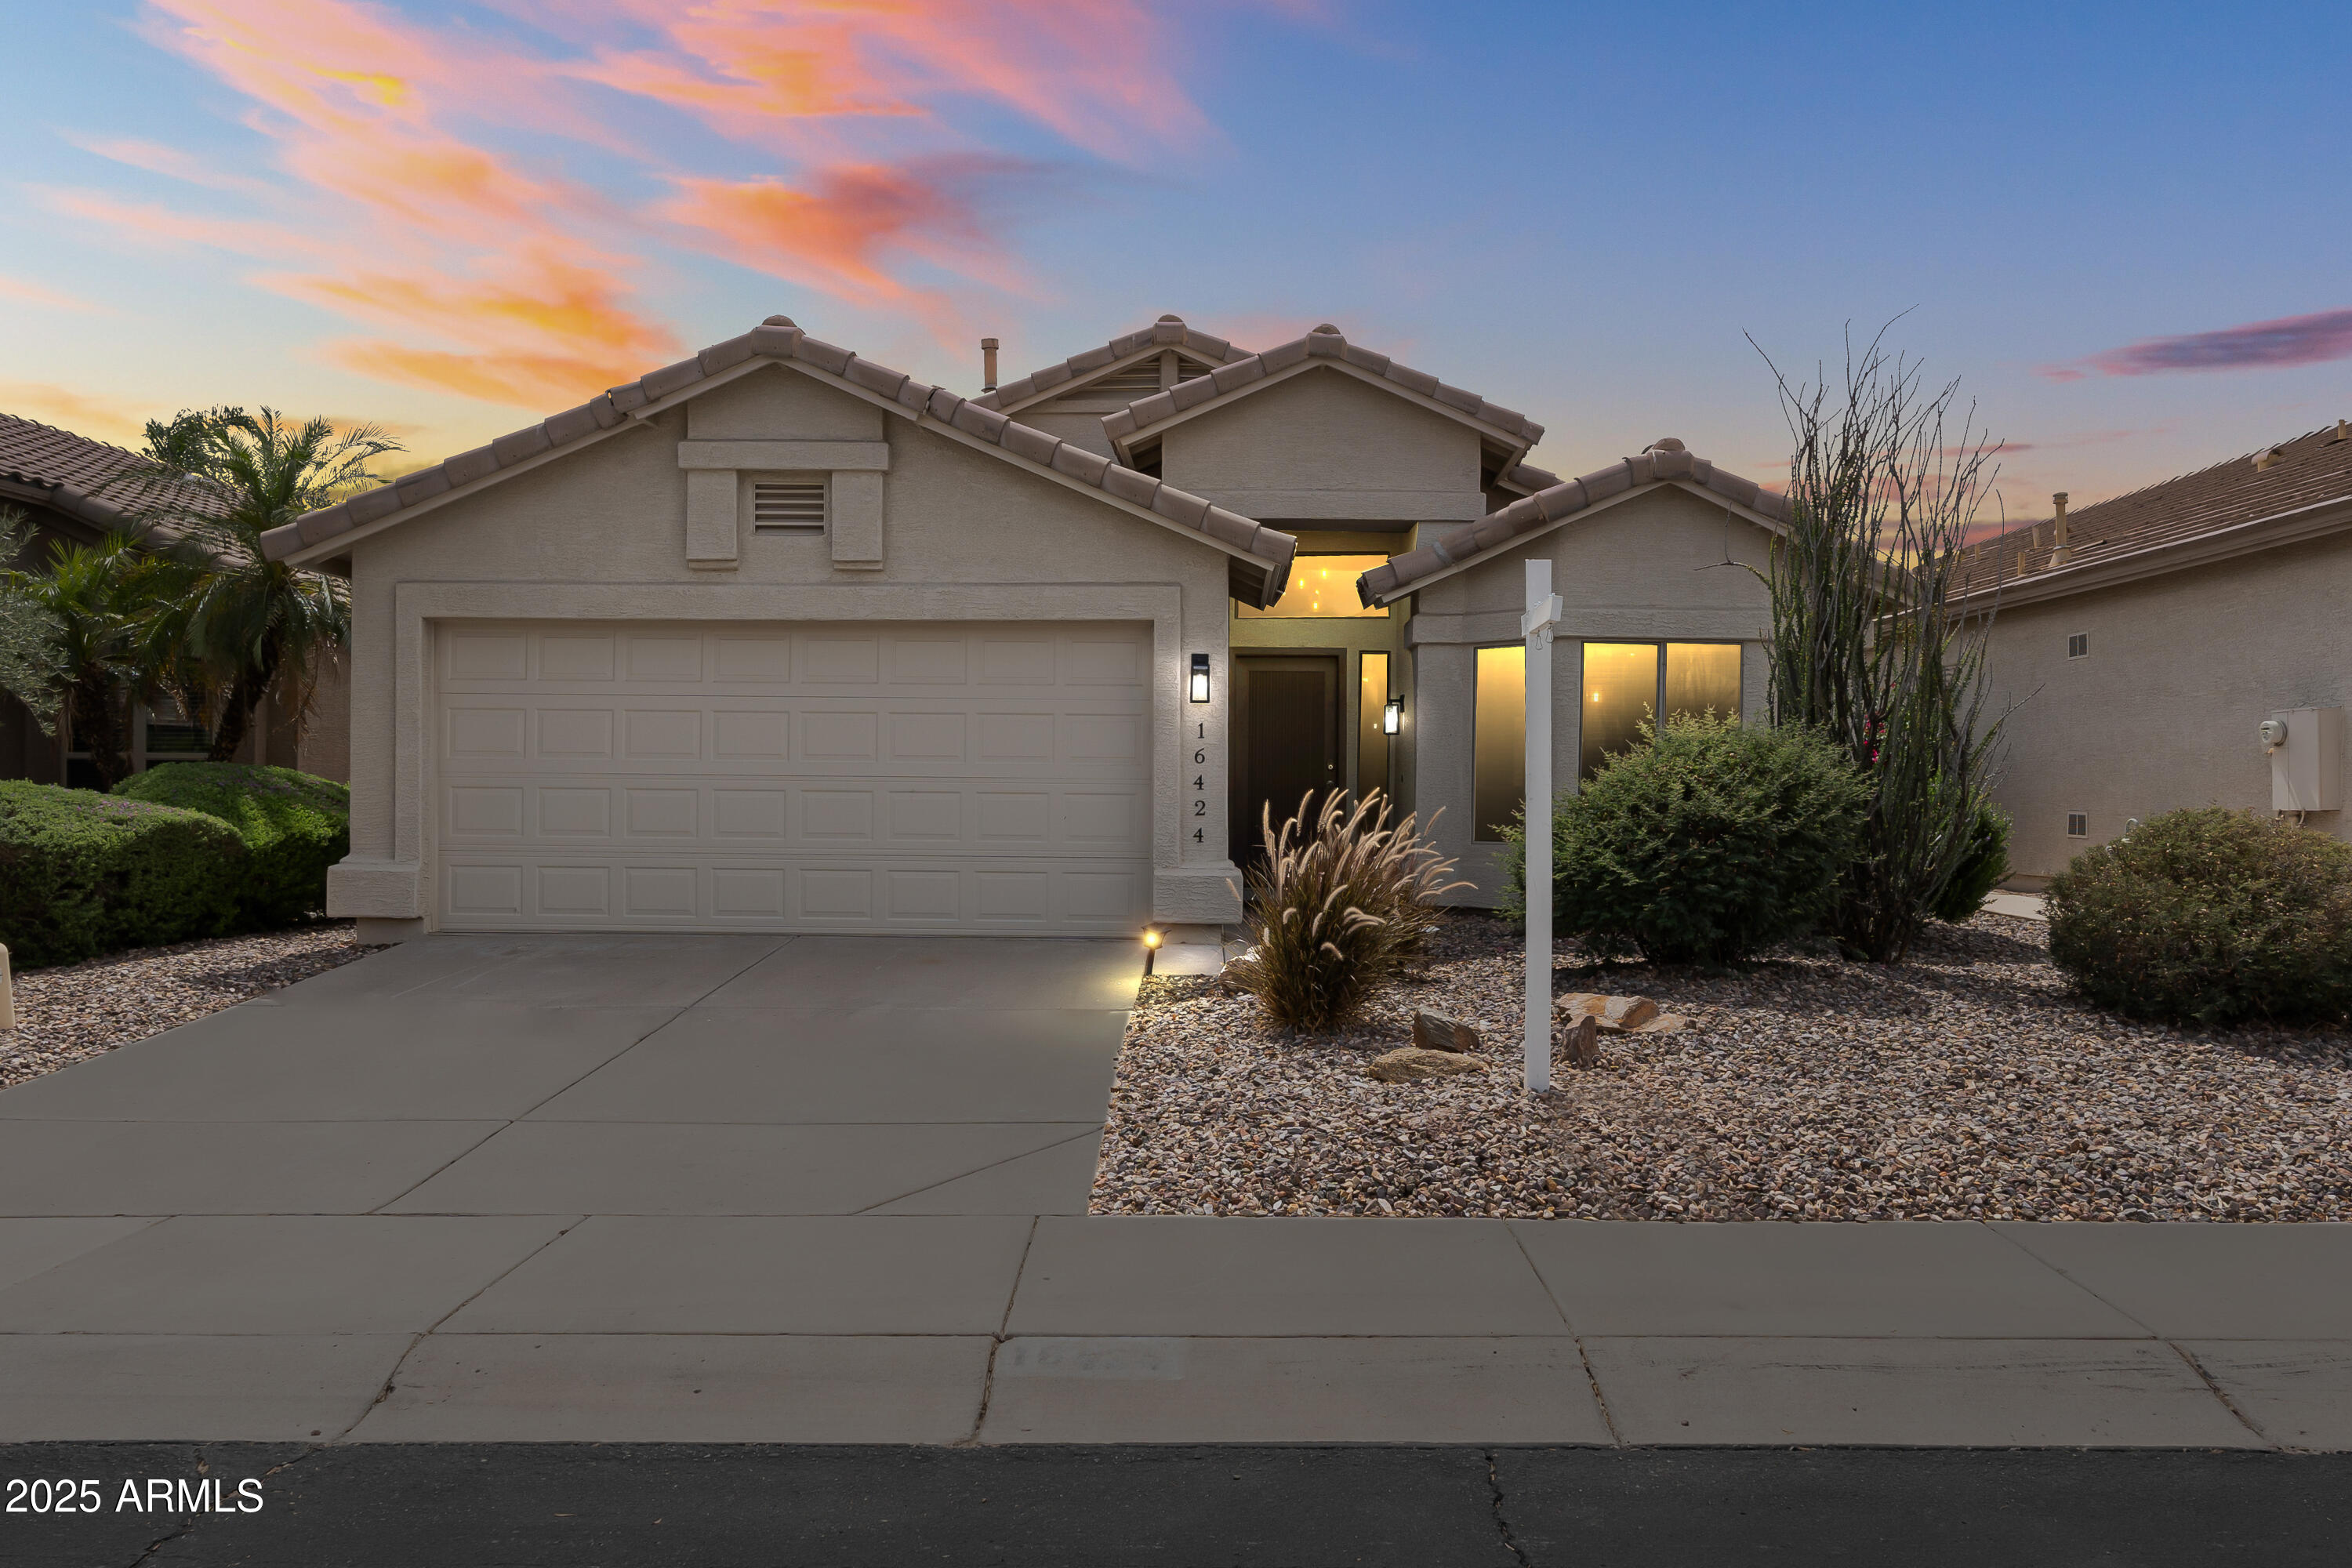
Active
$475,000
3
bds
|
2
ba
|
1,576
sqft
|
built
1996
16424 S 46th Way, Phoenix, AZ 85048
$-948
Cash flow
-10.4%
Cash-on-Cash Return
3.3%
Cap rate
0.5%
Rent to Value Ratio
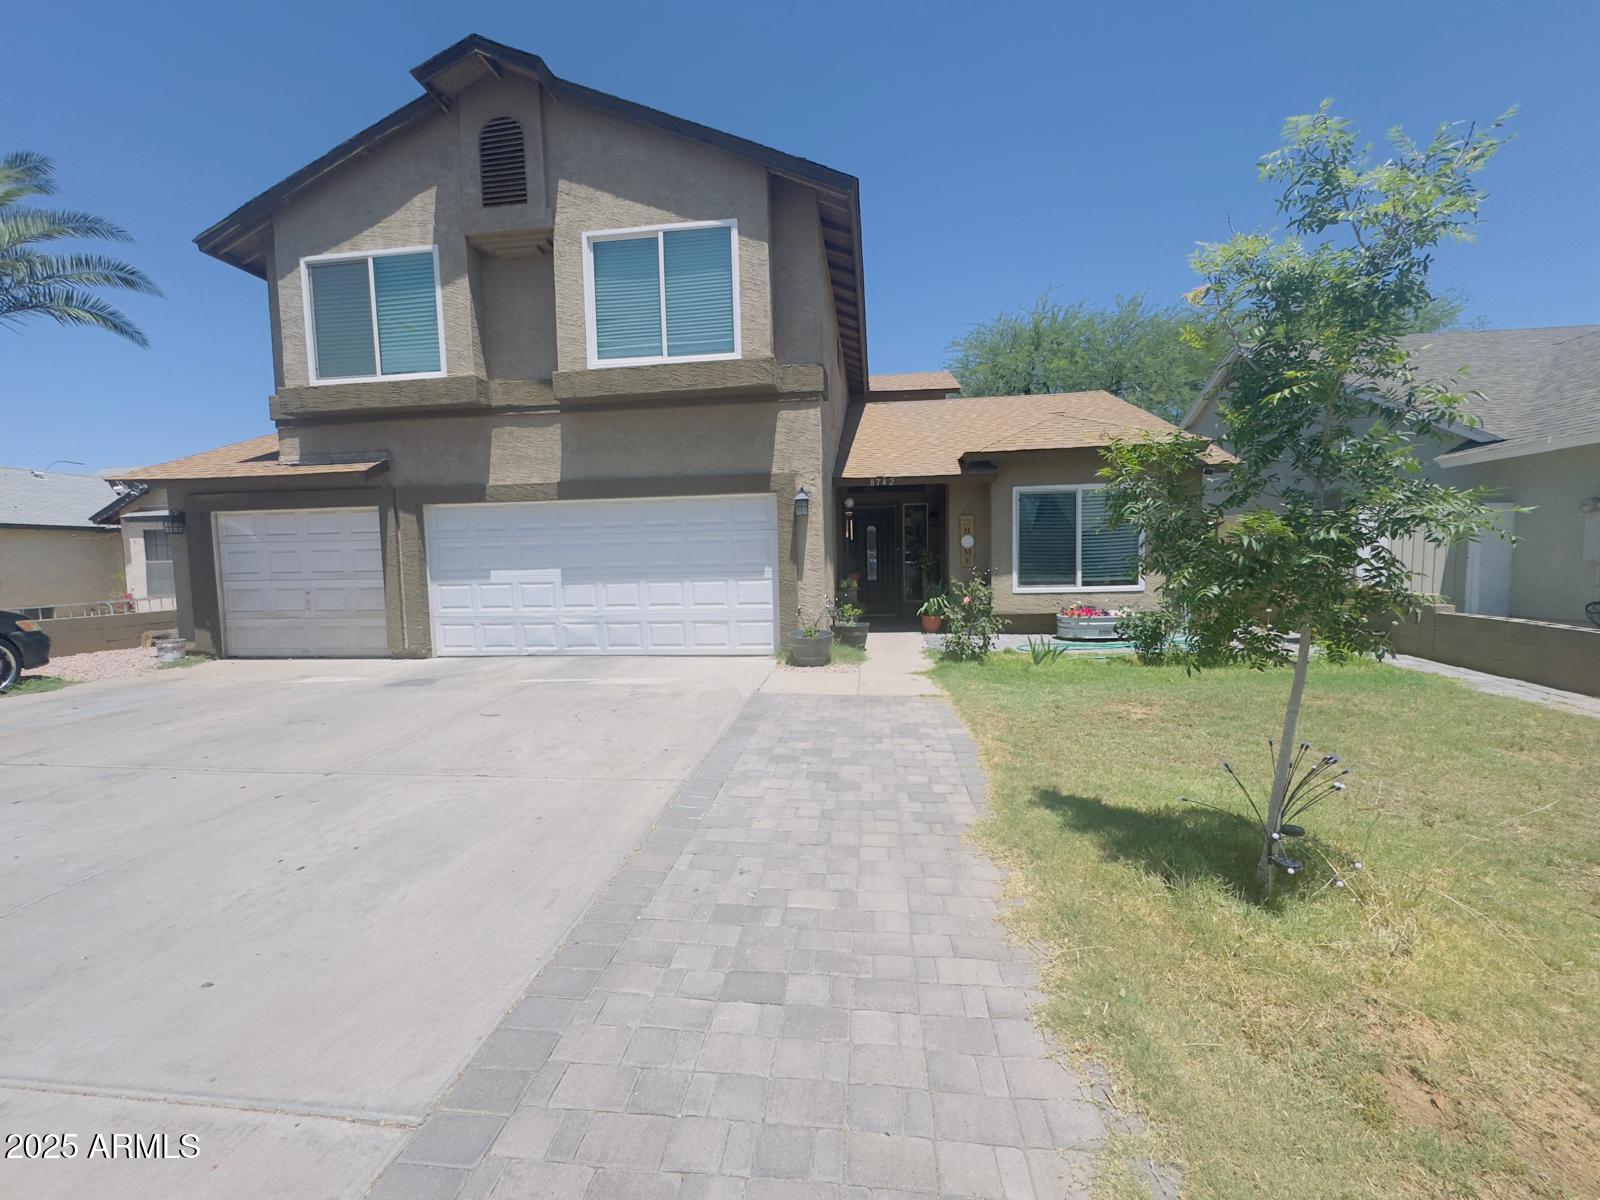
Active
$485,000
4
bds
|
2
ba
|
2,302
sqft
|
built
1990
8742 W Edgemont Ave, Phoenix, AZ 85037
$-901
Cash flow
-9.7%
Cash-on-Cash Return
3.4%
Cap rate
0.5%
Rent to Value Ratio
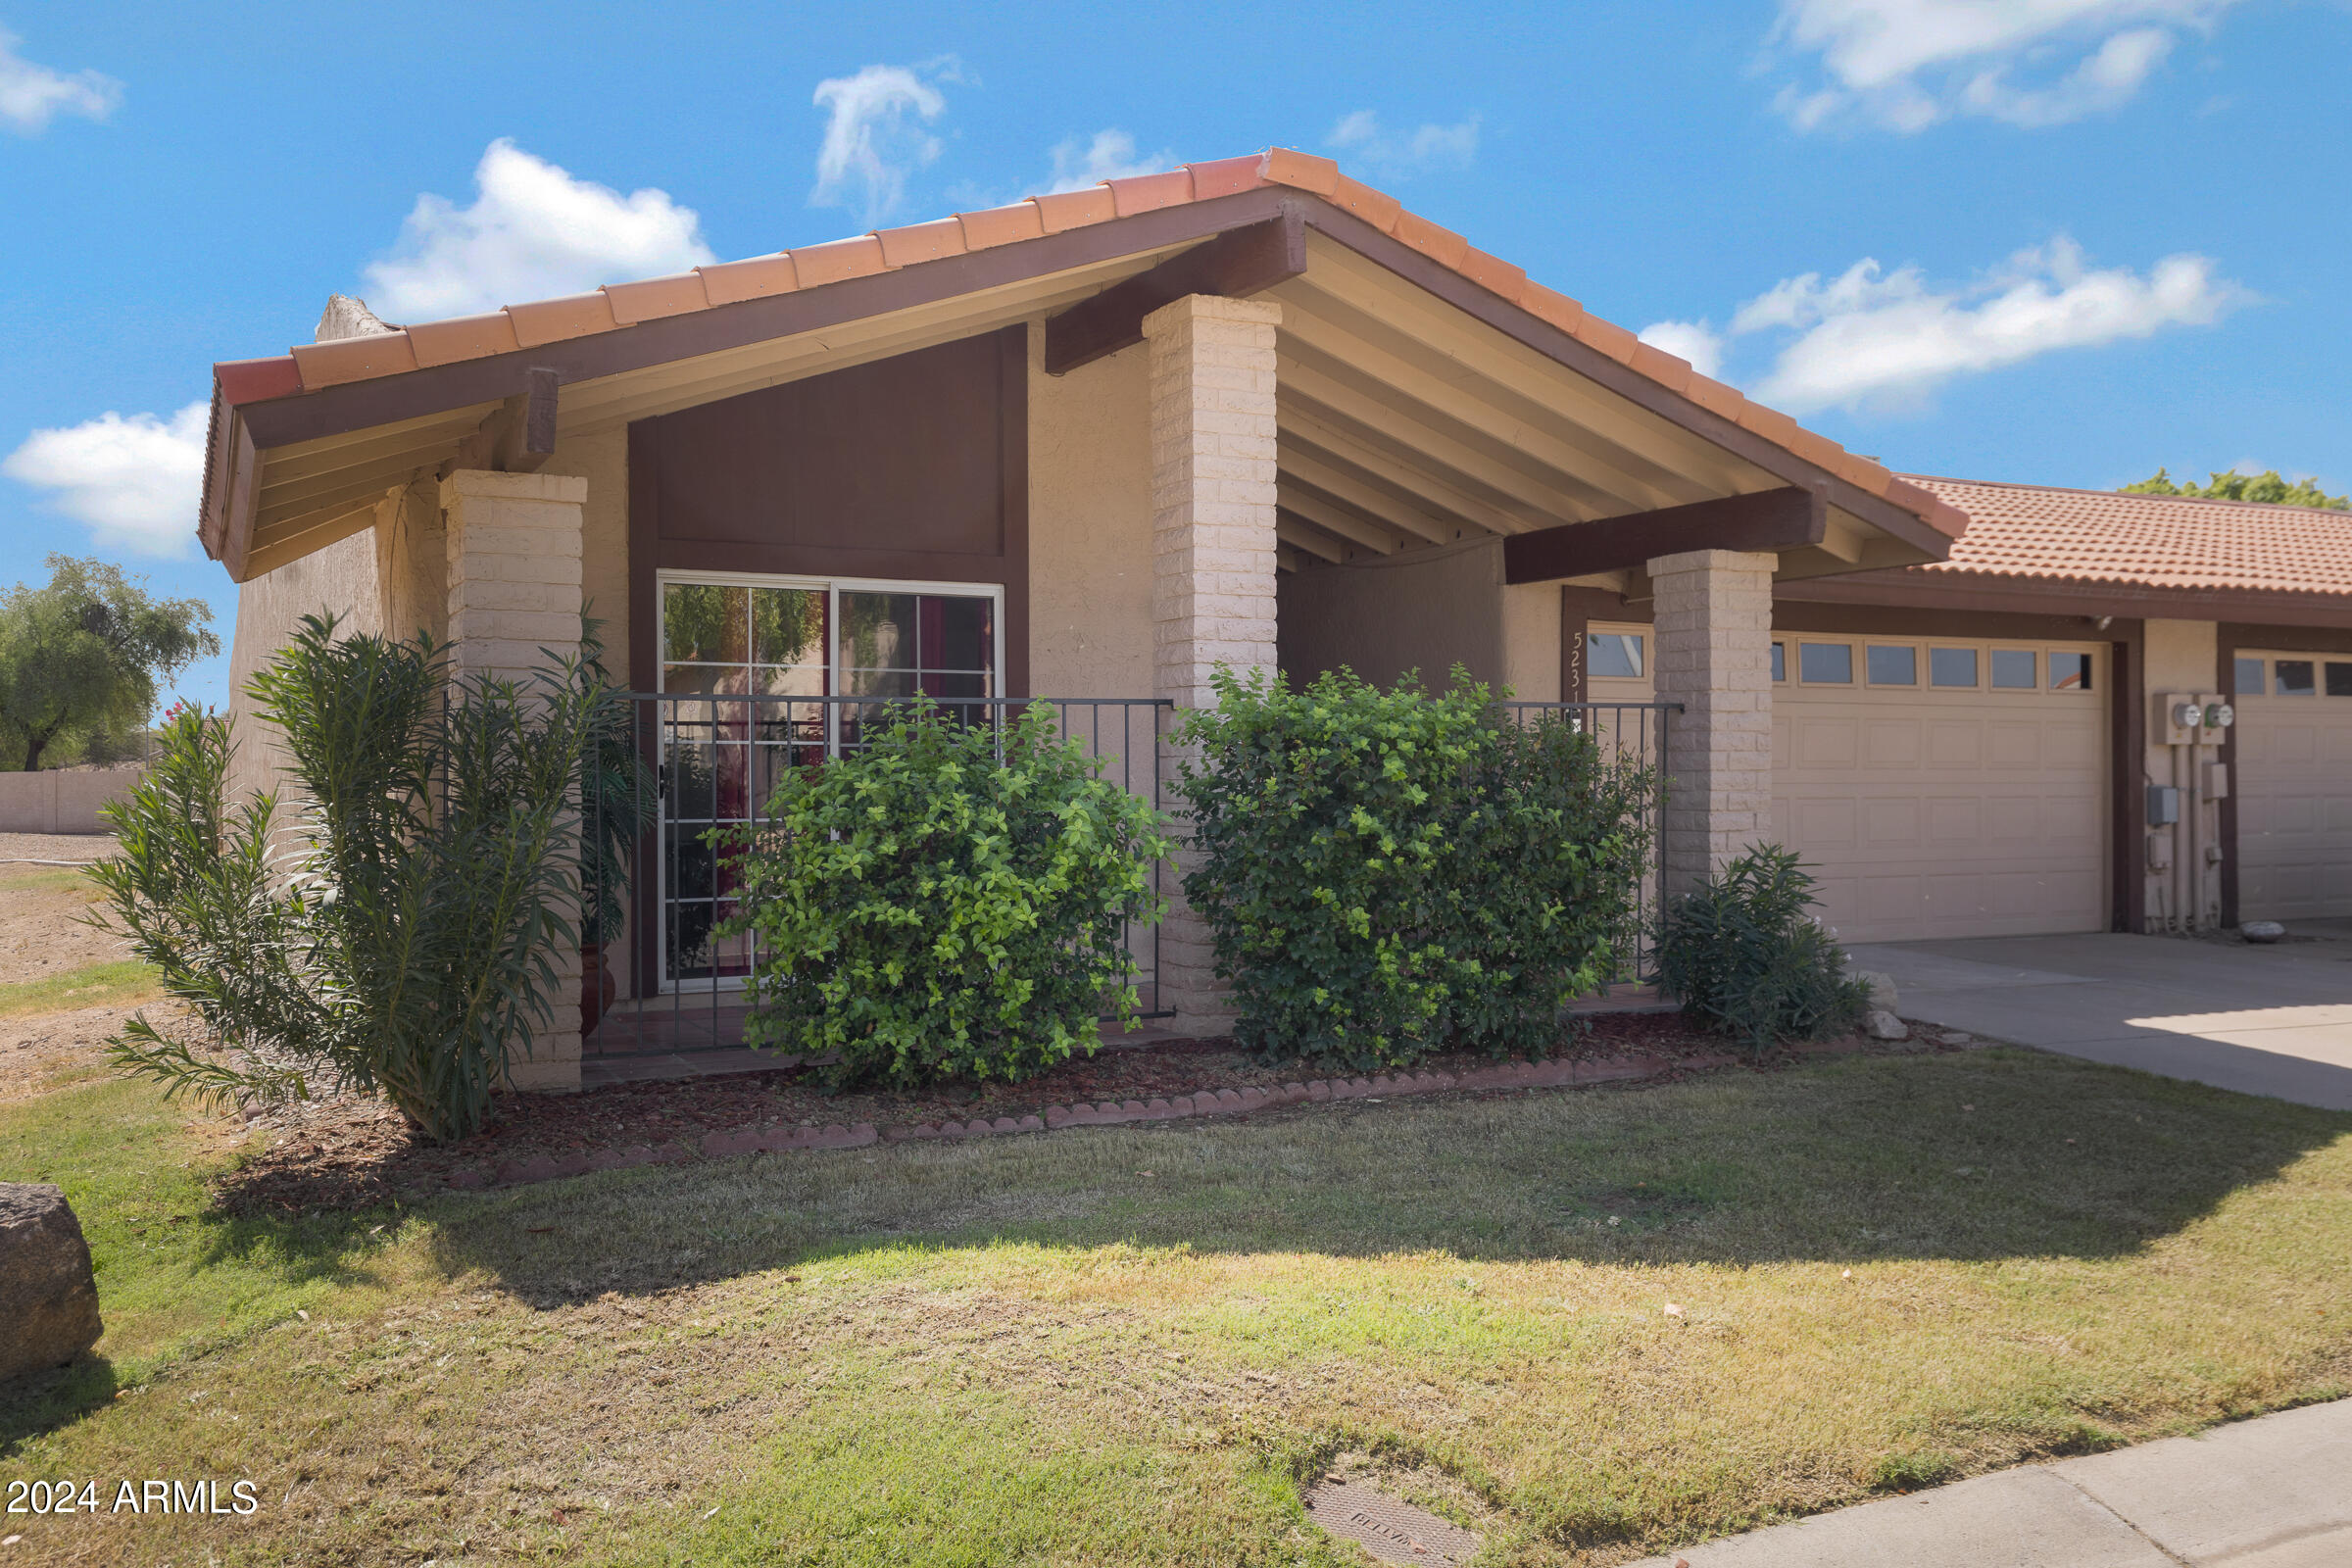
Active
$449,900
2
bds
|
2
ba
|
1,754
sqft
|
built
1974
5231 E Tamblo Dr, Phoenix, AZ 85044
$-802
Cash flow
-9.3%
Cash-on-Cash Return
3.5%
Cap rate
0.6%
Rent to Value Ratio
Active
$575,000
4
bds
|
3
ba
|
1,927
sqft
|
built
1997
4002 E Agave Rd, Phoenix, AZ 85044
$-1,315
Cash flow
-11.9%
Cash-on-Cash Return
2.9%
Cap rate
0.5%
Rent to Value Ratio
Active
$1,550,000
5
bds
|
5
ba
|
3,857
sqft
|
built
2021
3408 E Daley Ln, Phoenix, AZ 85050
$-5,023
Cash flow
-16.9%
Cash-on-Cash Return
1.8%
Cap rate
0.3%
Rent to Value Ratio

Active
$430,000
3
bds
|
3
ba
|
1,733
sqft
|
built
2019
3900 E Baseline Rd, Phoenix, AZ 85042
$-668
Cash flow
-8.1%
Cash-on-Cash Return
3.8%
Cap rate
0.7%
Rent to Value Ratio
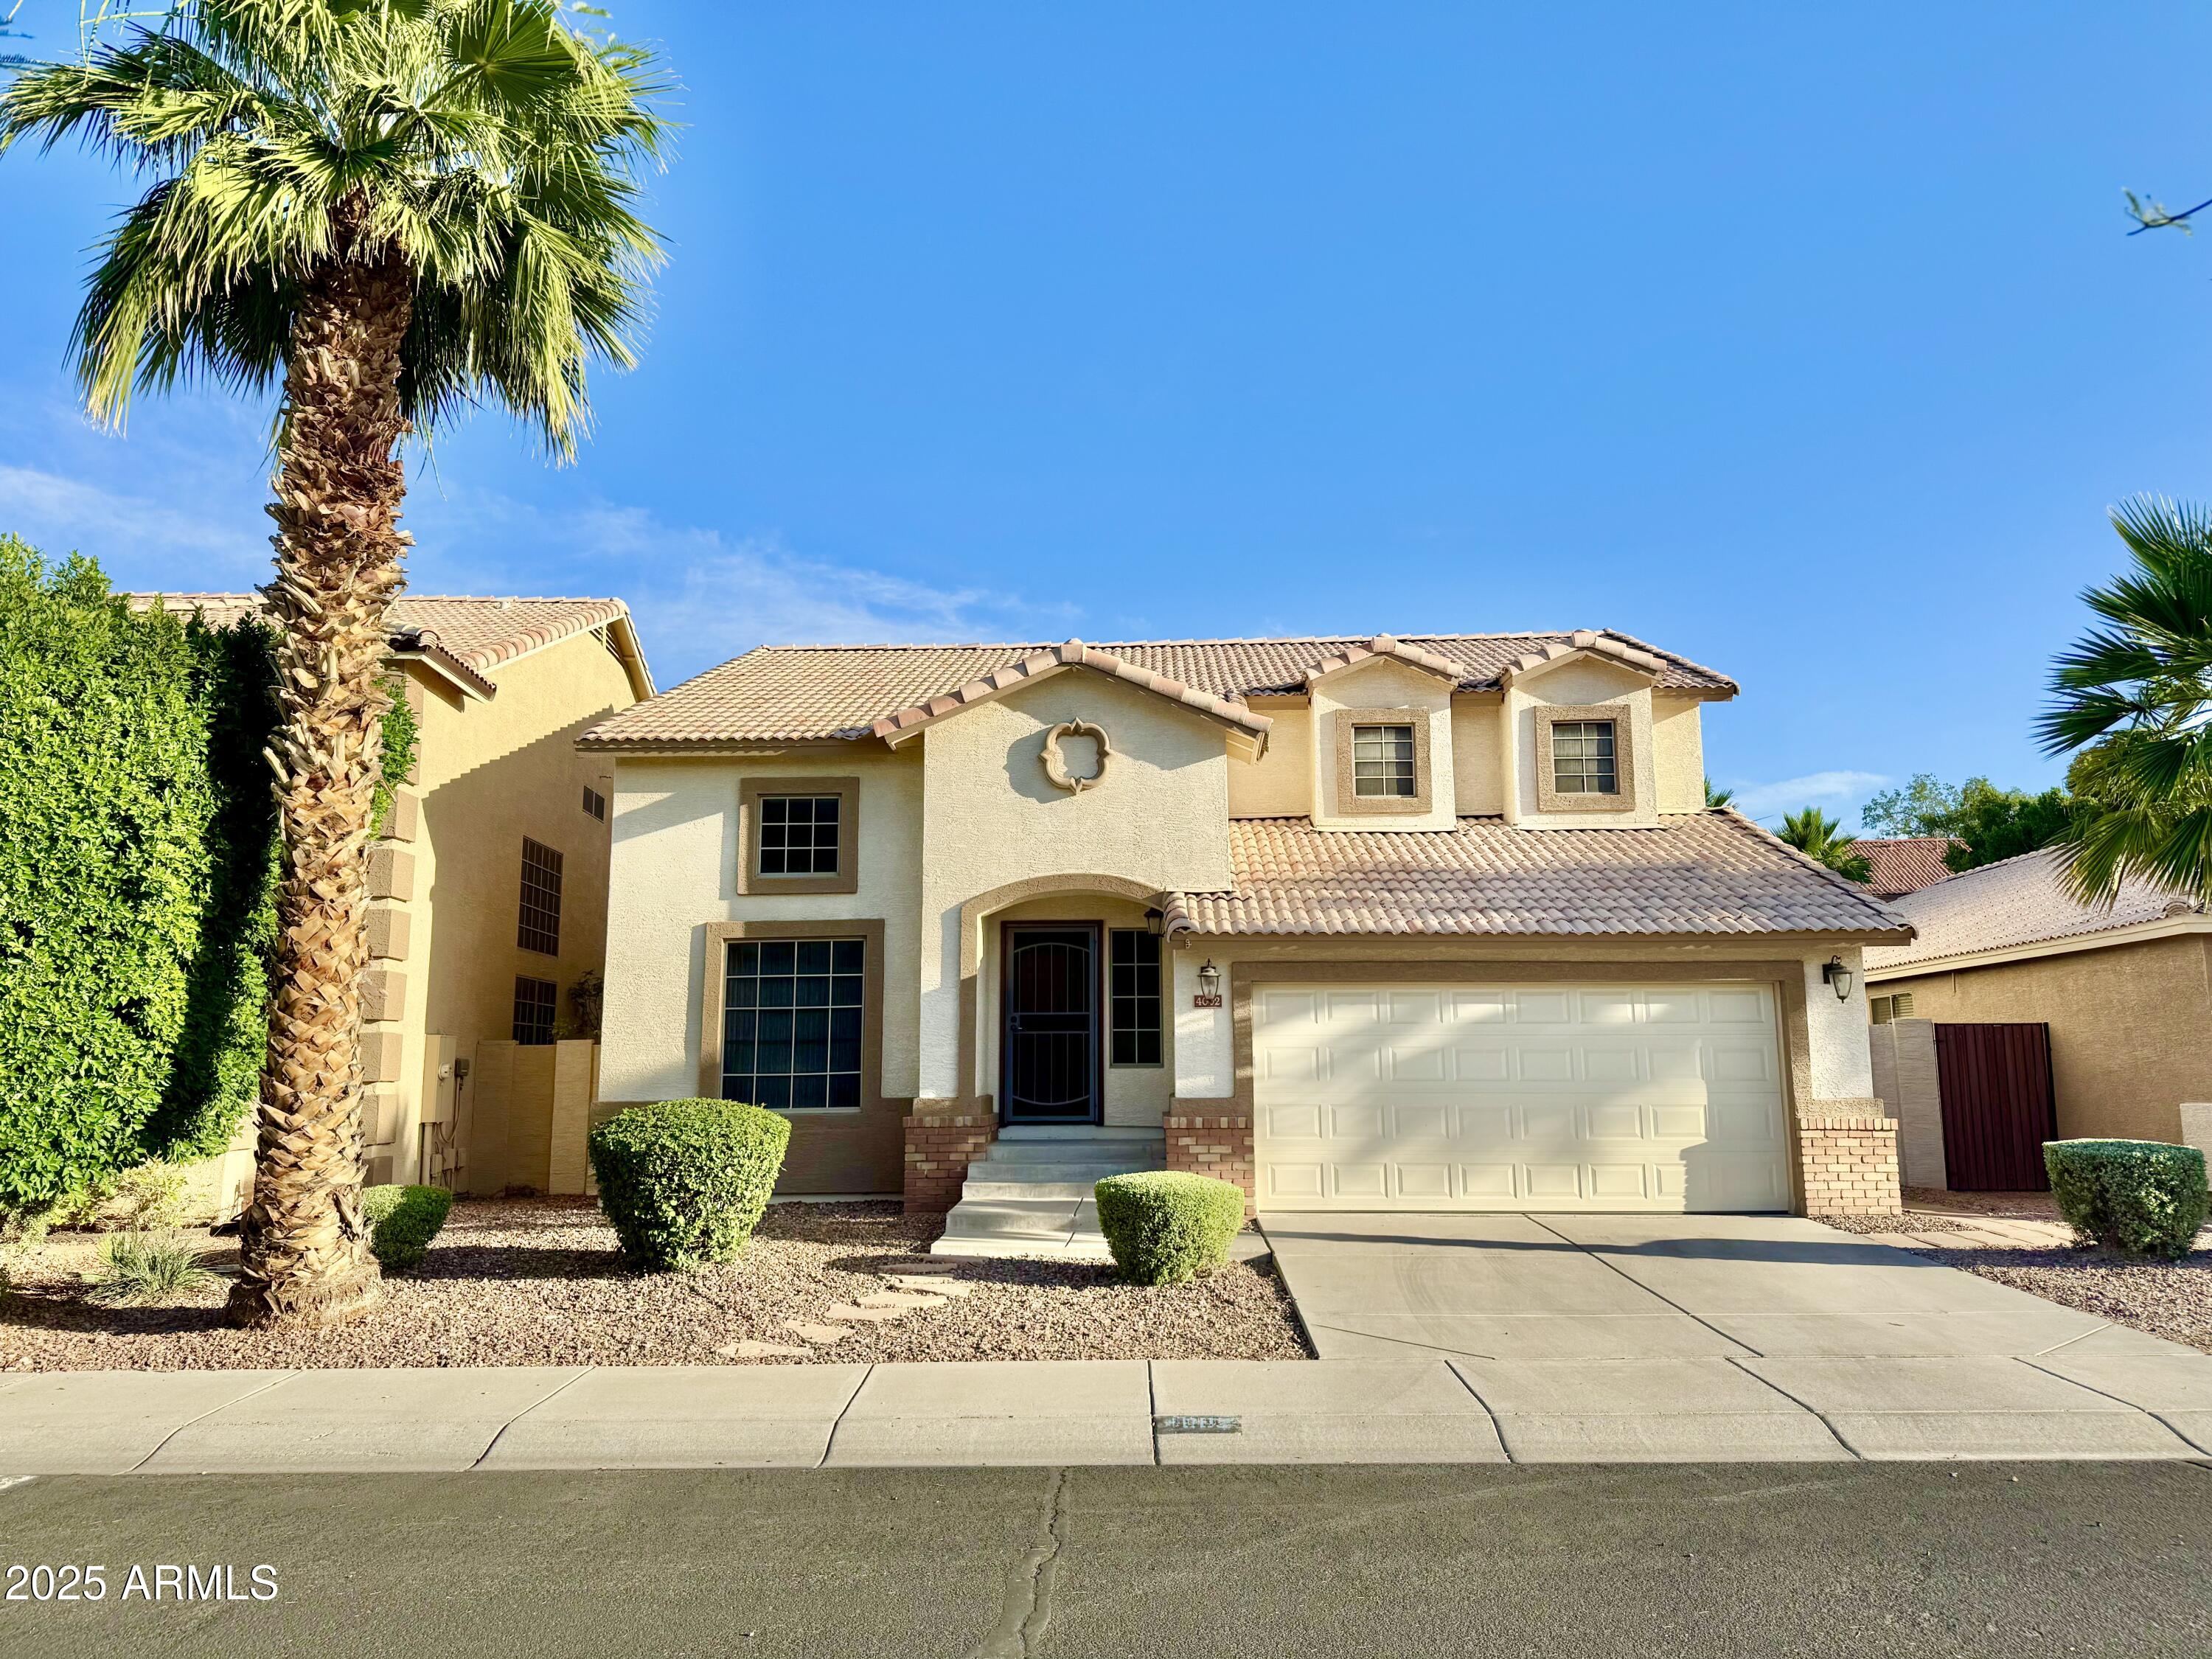
Active
$629,999
4
bds
|
3
ba
|
2,389
sqft
|
built
2001
6847 S 27th Pl, Phoenix, AZ 85042
$-1,593
Cash flow
-13.2%
Cash-on-Cash Return
2.6%
Cap rate
0.4%
Rent to Value Ratio
Active
$600,000
4
bds
|
3
ba
|
2,041
sqft
|
built
1995
16823 S 24th Pl, Phoenix, AZ 85048
$-1,192
Cash flow
-10.4%
Cash-on-Cash Return
3.3%
Cap rate
0.5%
Rent to Value Ratio
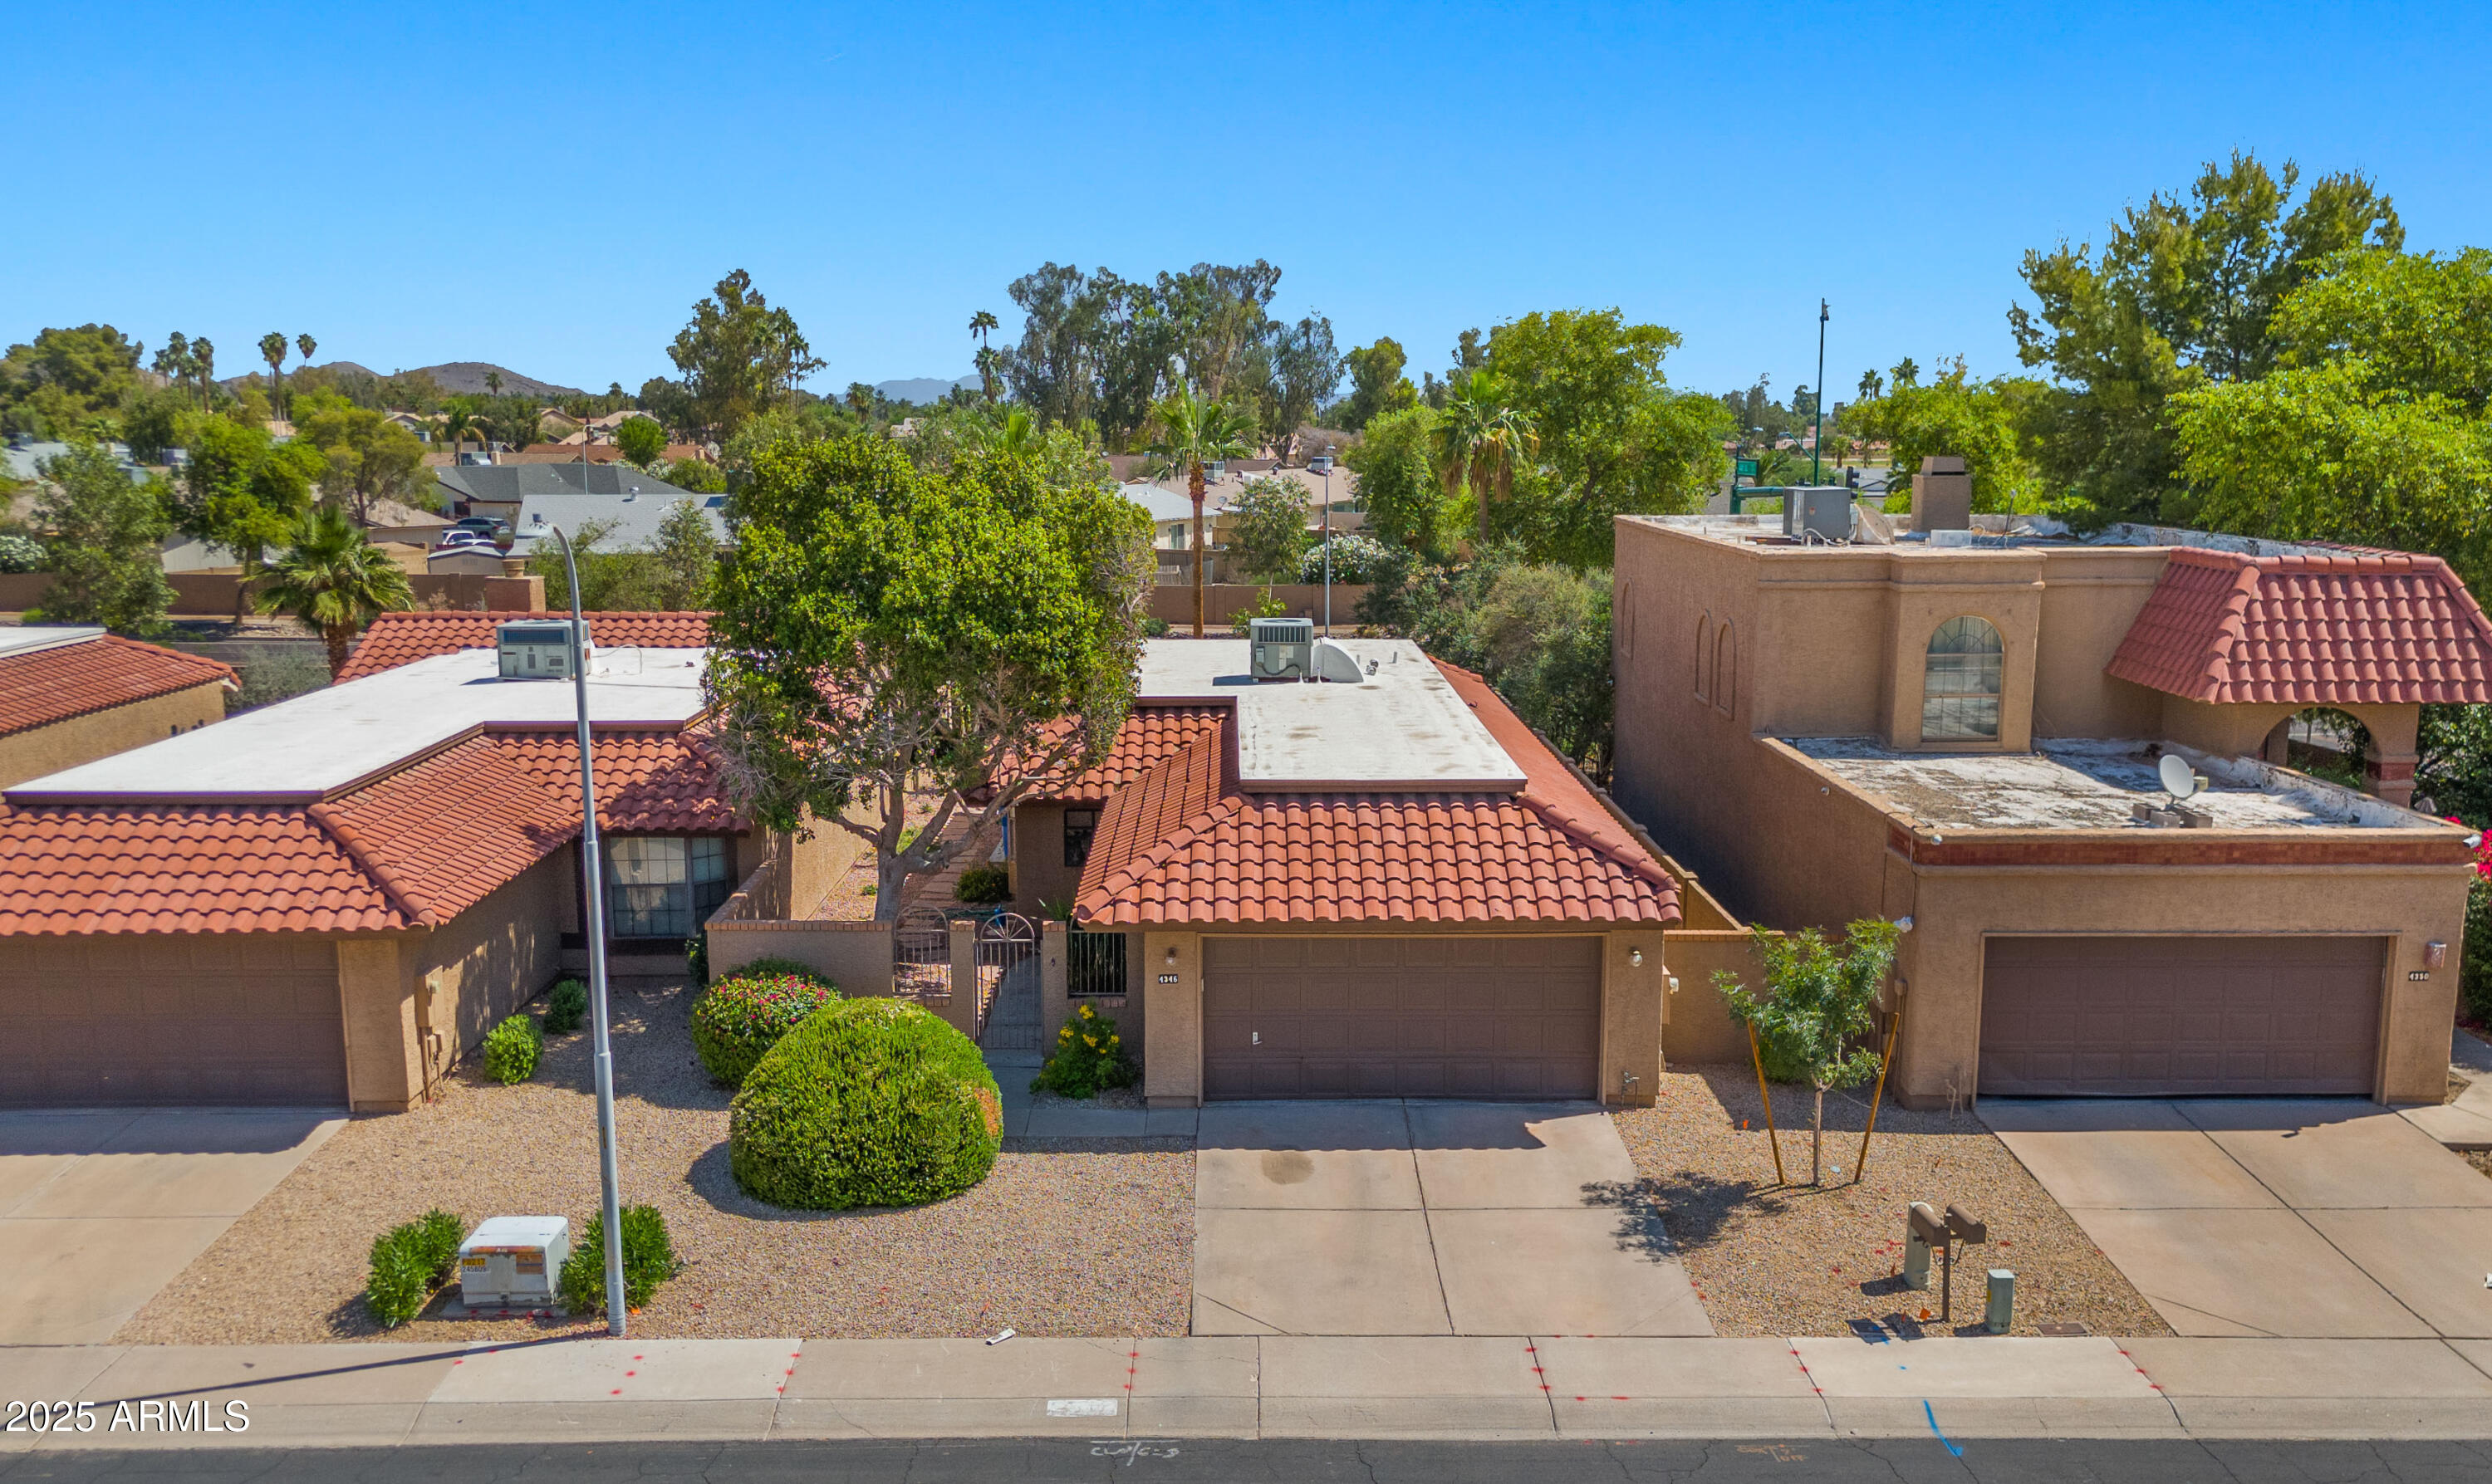
Active
$399,900
2
bds
|
2
ba
|
1,121
sqft
|
built
1985
4346 E Bannock St, Phoenix, AZ 85044
$-784
Cash flow
-10.2%
Cash-on-Cash Return
3.3%
Cap rate
0.5%
Rent to Value Ratio
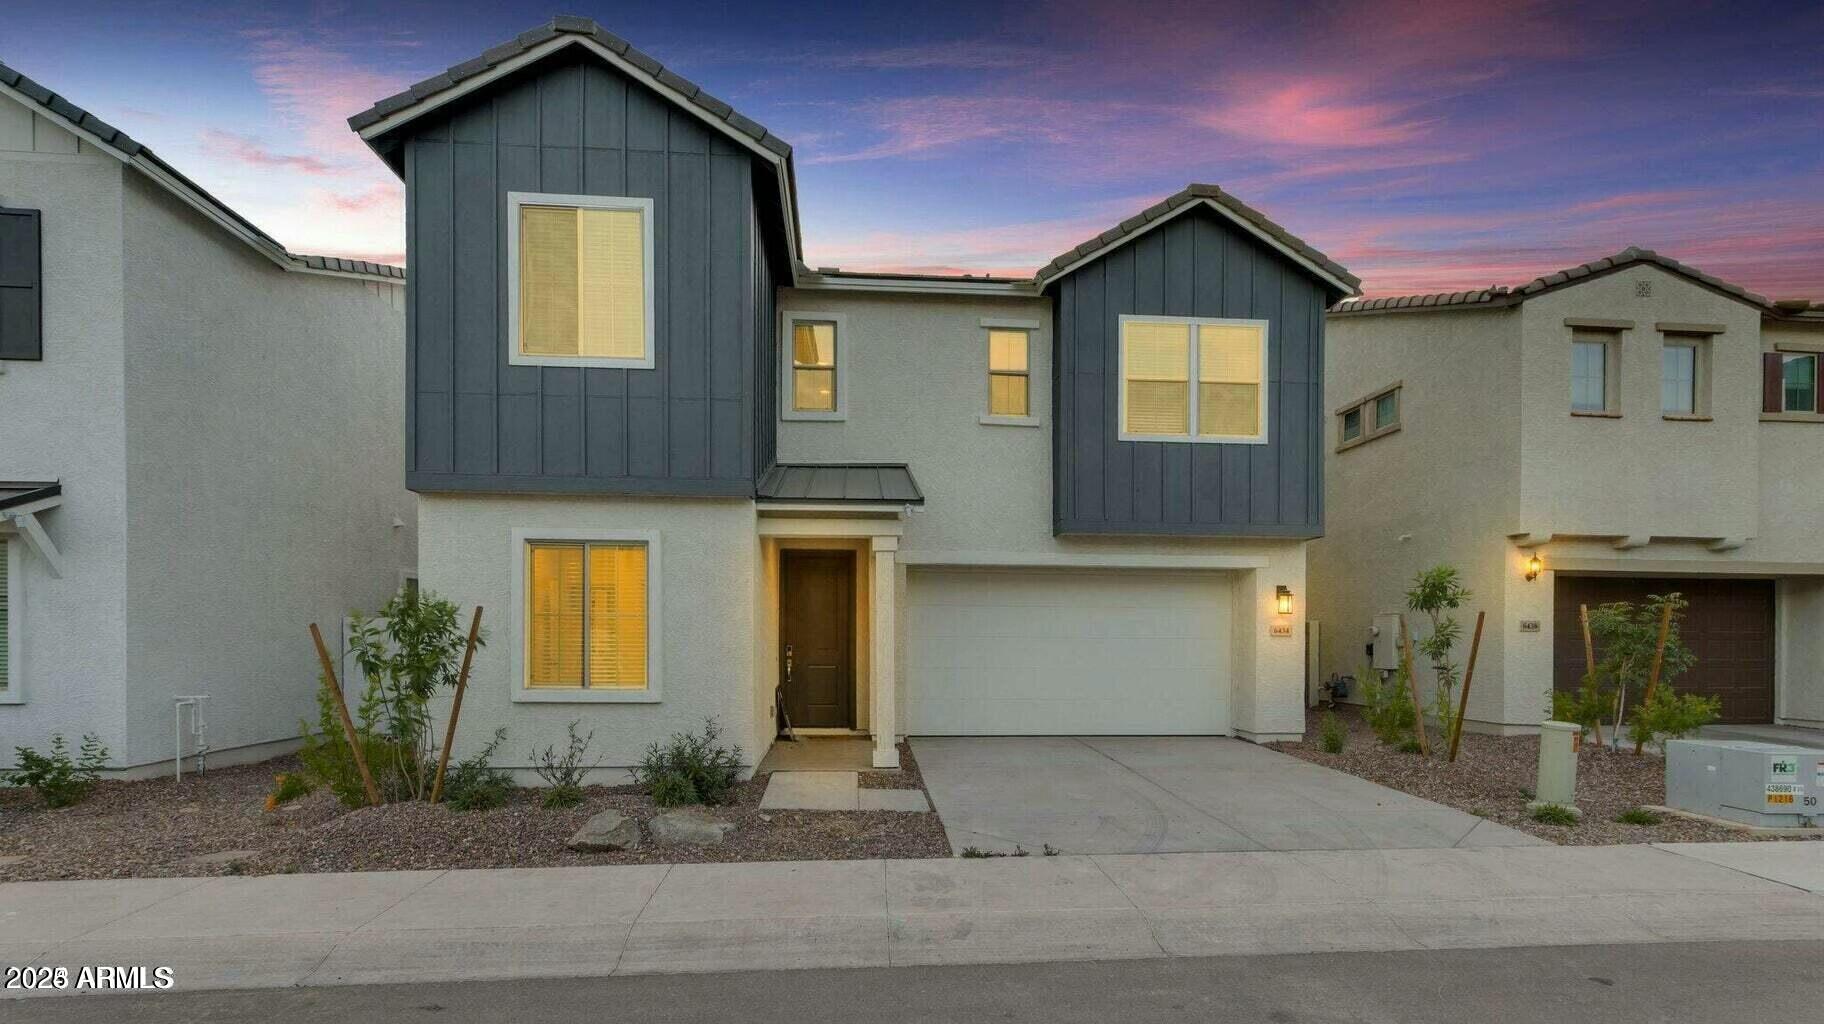
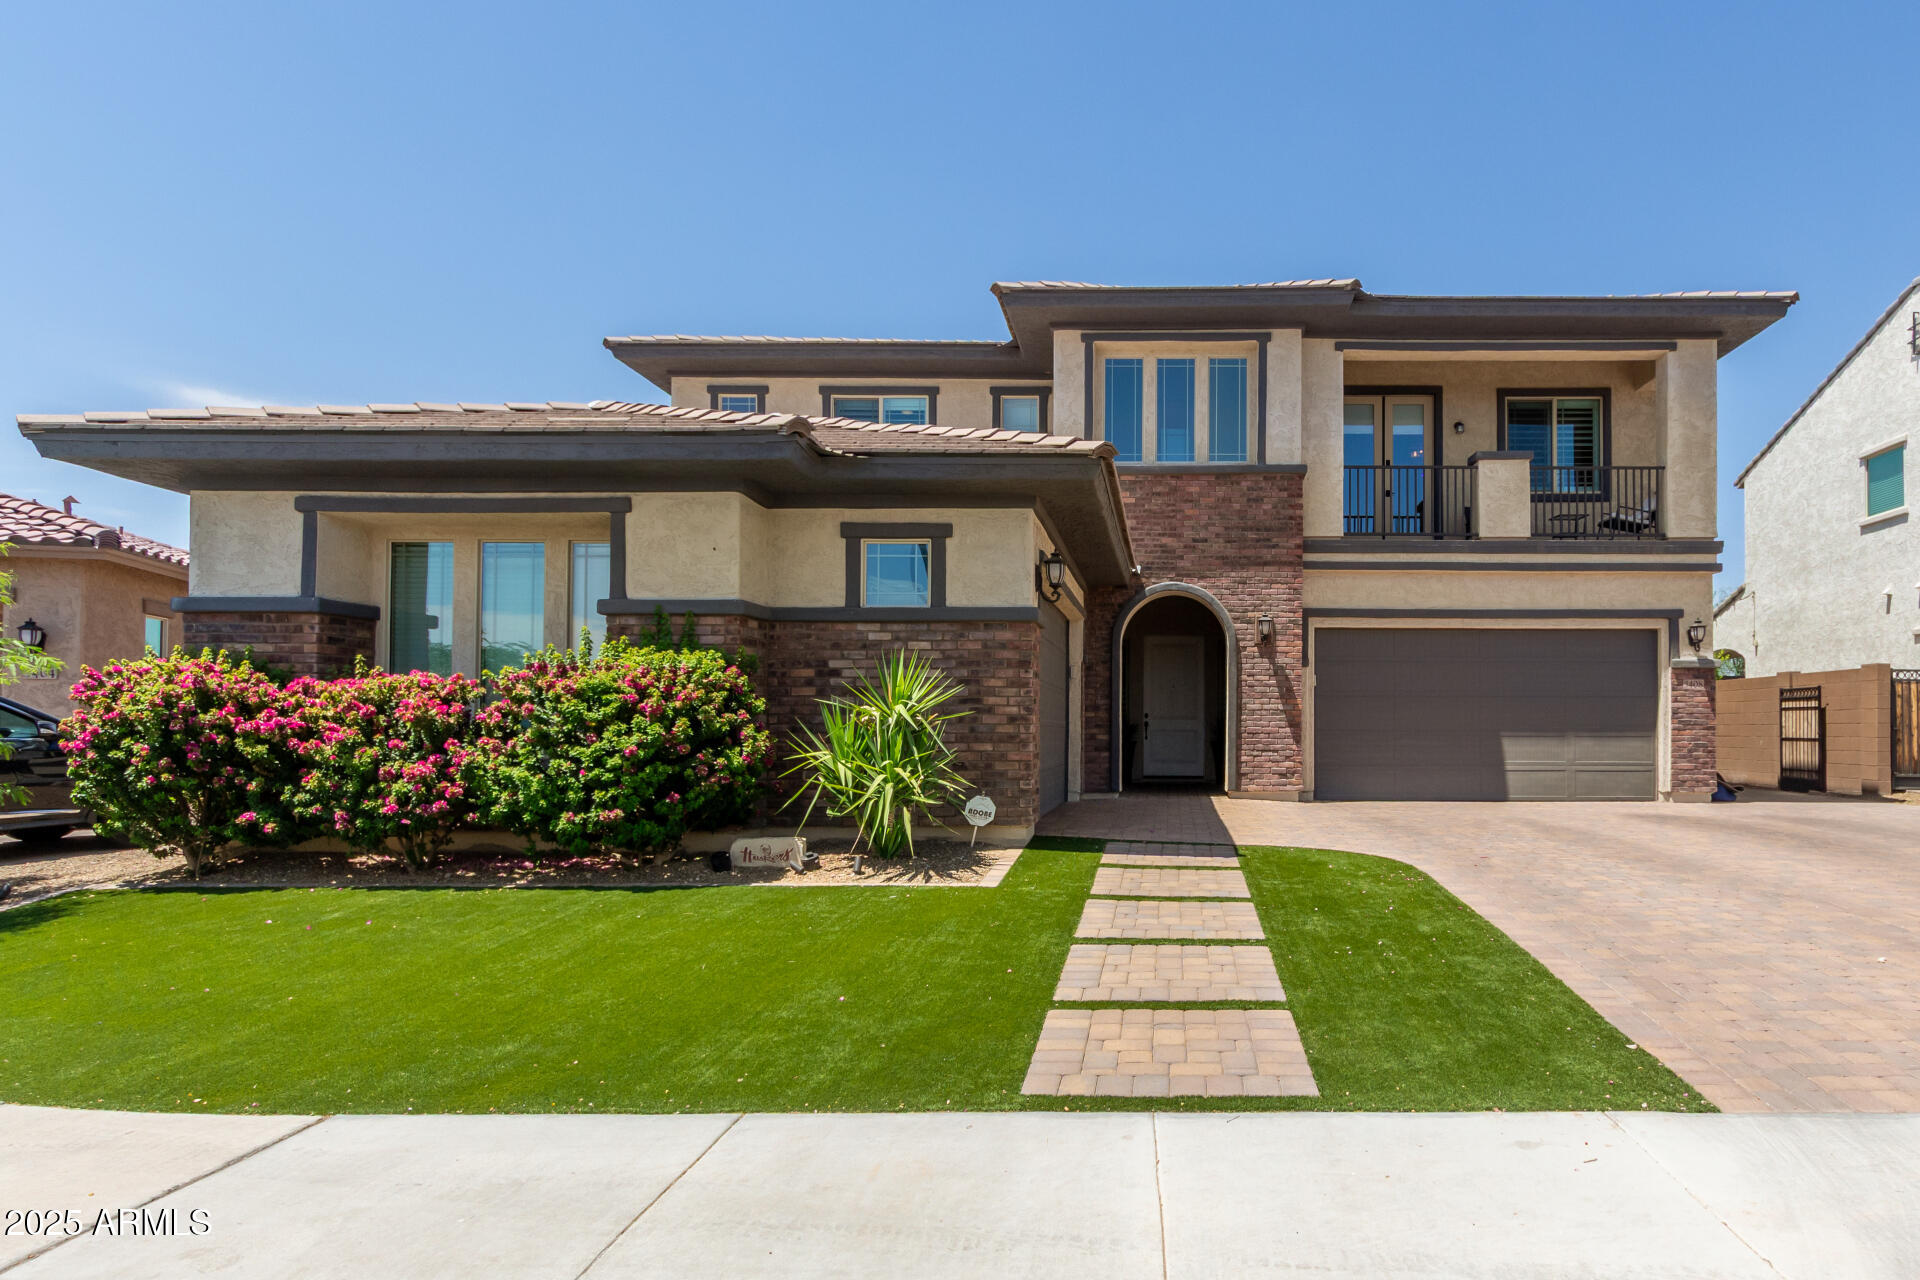
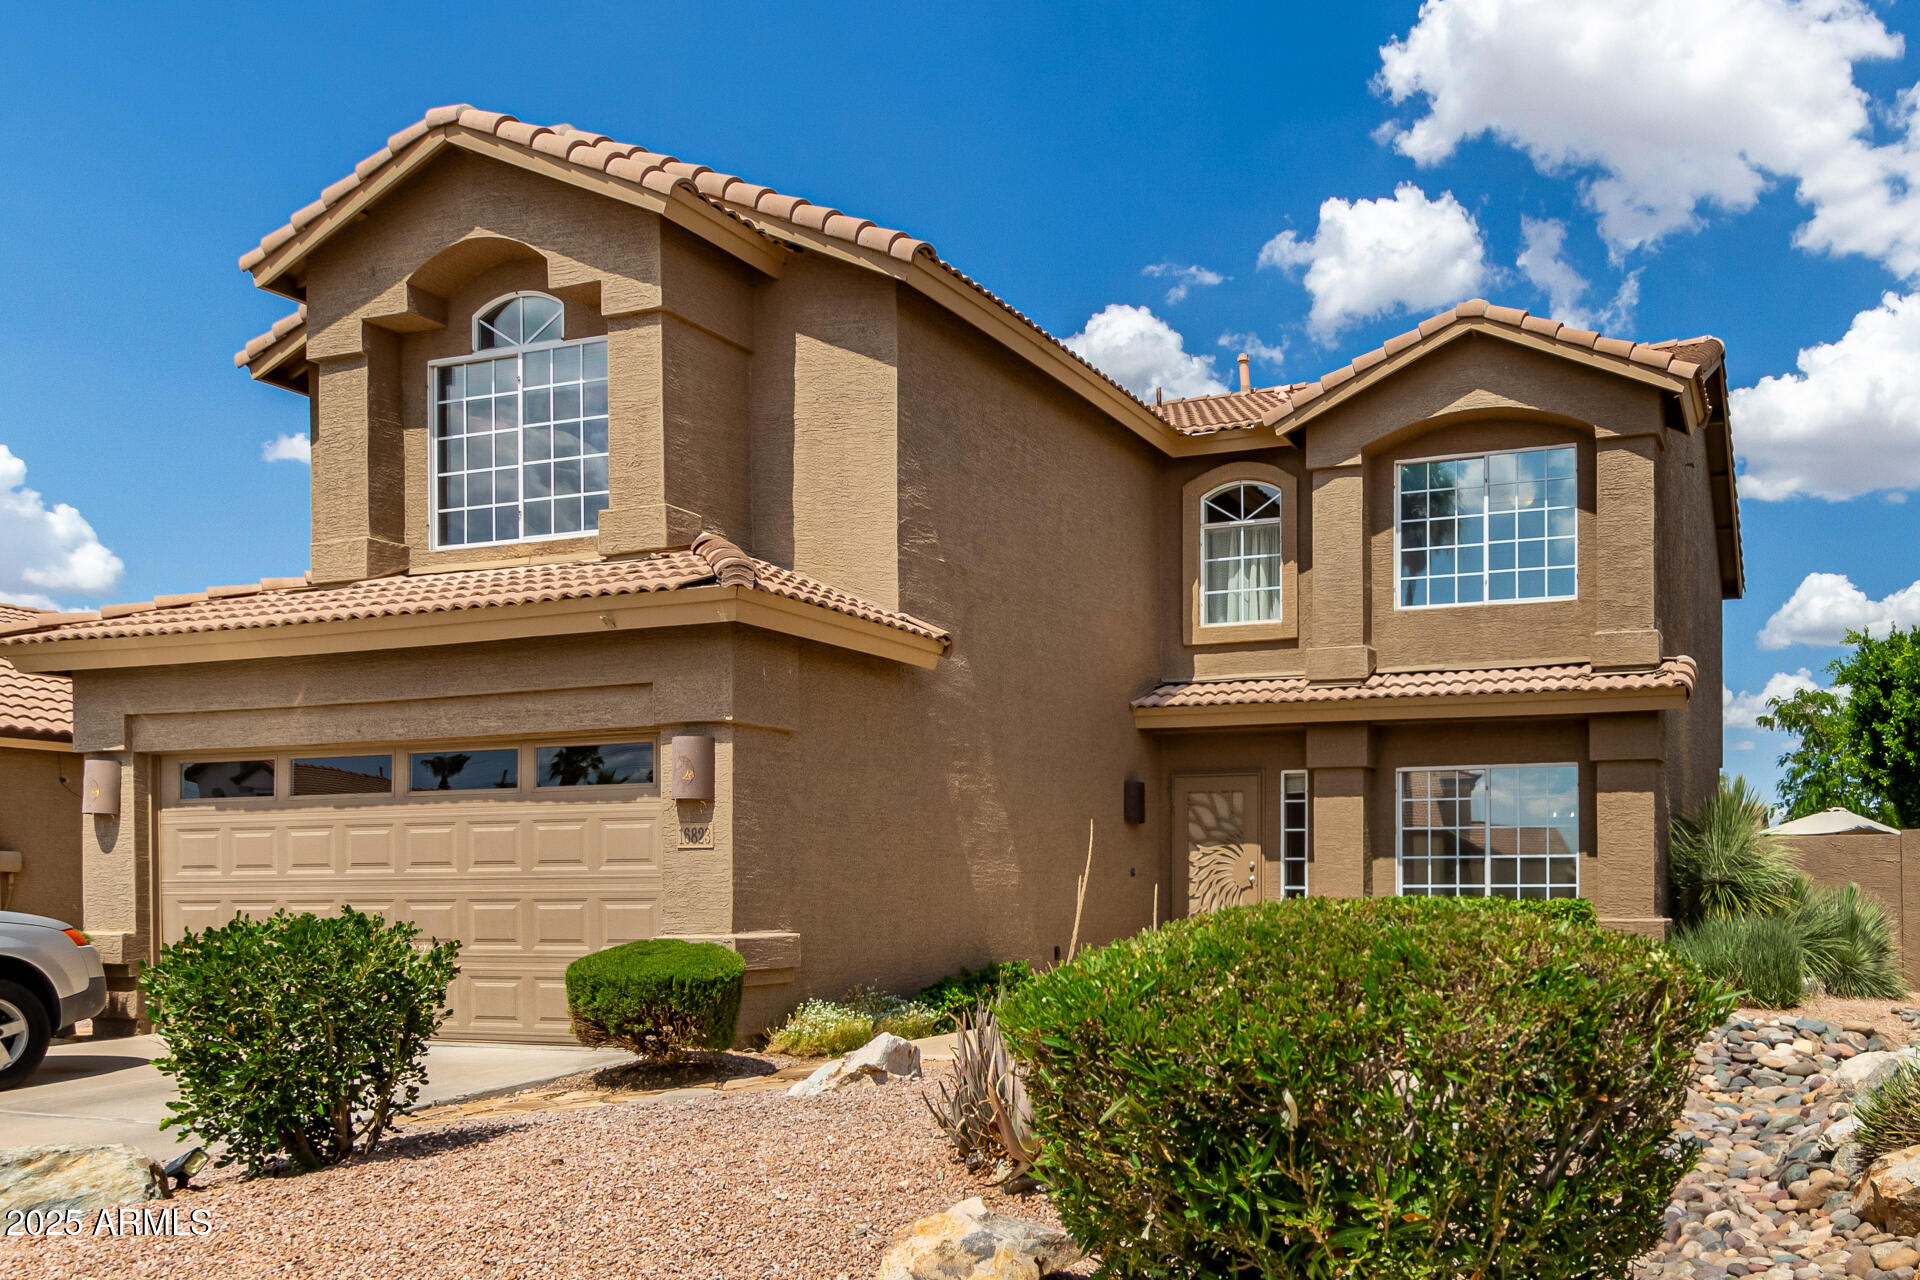
Active
$879,000
5
bds
|
3
ba
|
2,393
sqft
|
built
2022
6434 S 17th St, Phoenix, AZ 85042
$-3,149
Cash flow
-18.7%
Cash-on-Cash Return
1.4%
Cap rate
0.3%
Rent to Value Ratio
Active
$259,999
3
bds
|
1
ba
|
1,241
sqft
|
built
1953
2944 W Northern Ave, Phoenix, AZ 85051
$-169
Cash flow
-3.4%
Cash-on-Cash Return
4.9%
Cap rate
0.6%
Rent to Value Ratio
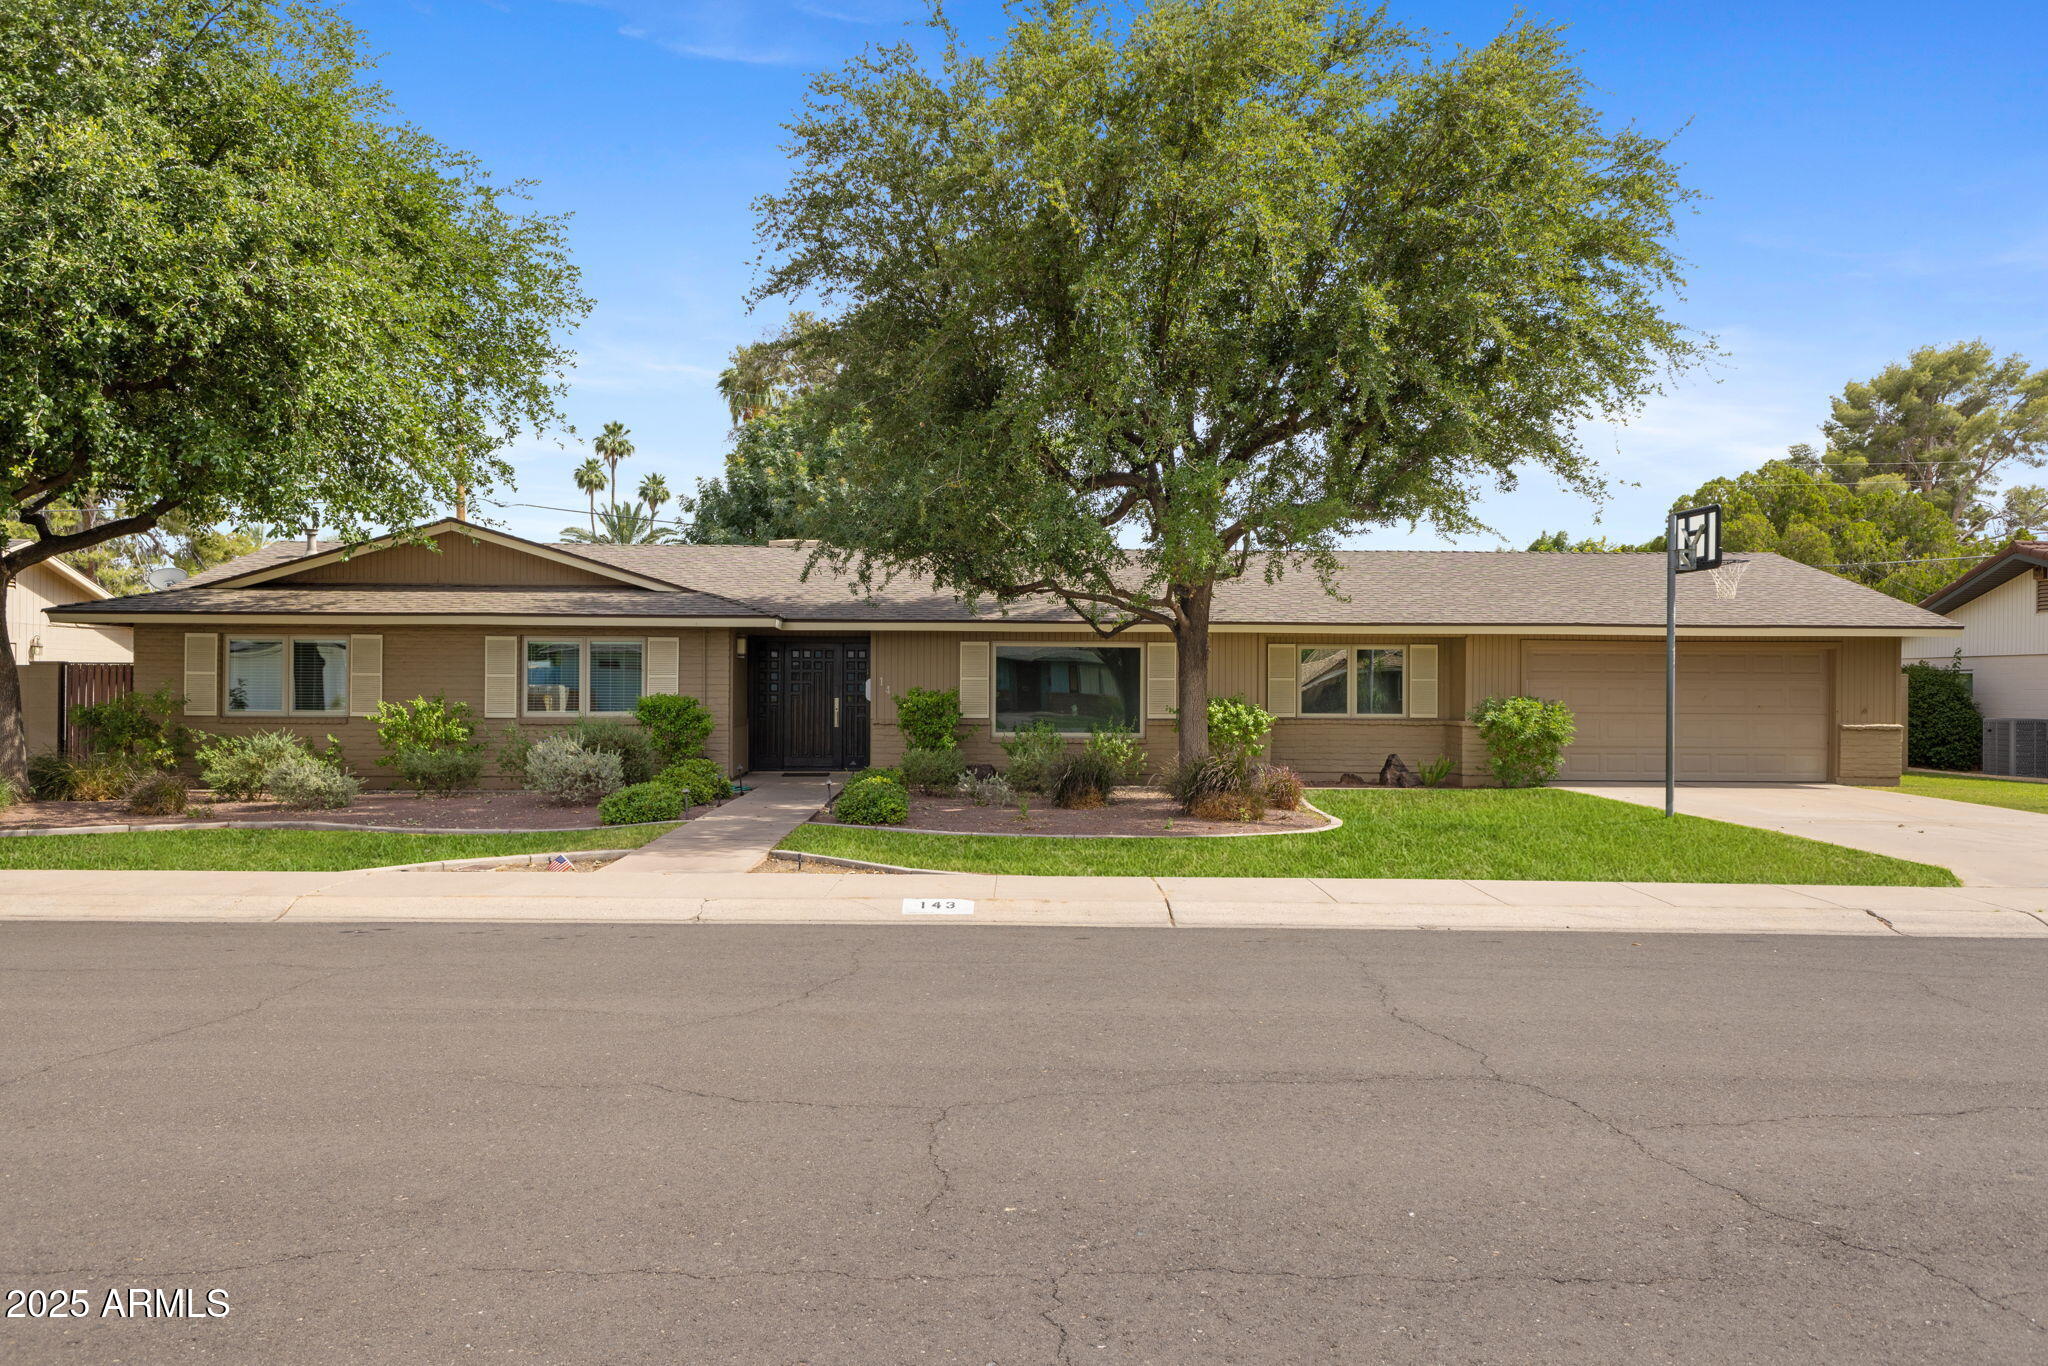
Active
$1,050,000
4
bds
|
3
ba
|
2,704
sqft
|
built
1964
143 E Winter Dr, Phoenix, AZ 85020
$-3,011
Cash flow
-15.0%
Cash-on-Cash Return
2.2%
Cap rate
0.3%
Rent to Value Ratio