Phoenix, AZ Investment Properties for Sale
Browse homes for sale and investment properties in Phoenix, AZ. Refine your search by price, property type, or more.
Best cash flowing properties in Phoenix, AZ
Active
$220,000
3
bds
|
2
ba
|
1,088
sqft
|
built
1984
11666 N 28th Dr, Phoenix, AZ 85029
$-145
Cash flow
-3.4%
Cash-on-Cash Return
4.9%
Cap rate
0.8%
Rent to Value Ratio
Active
$419,999
4
bds
|
2
ba
|
1,777
sqft
|
built
1970
9615 N 34th Ave, Phoenix, AZ 85051
$-296
Cash flow
-3.7%
Cash-on-Cash Return
4.8%
Cap rate
0.6%
Rent to Value Ratio
3,616 out of 3,994 properties for sale in Phoenix, AZ
Limited Results Shown
Create a free account, or log in to reveal all property listings and enjoy the complete experience.
Active
$419,999
4
bds
|
2
ba
|
1,777
sqft
|
built
1970
9615 N 34th Ave, Phoenix, AZ 85051
$-296
Cash flow
-3.7%
Cash-on-Cash Return
4.8%
Cap rate
0.6%
Rent to Value Ratio
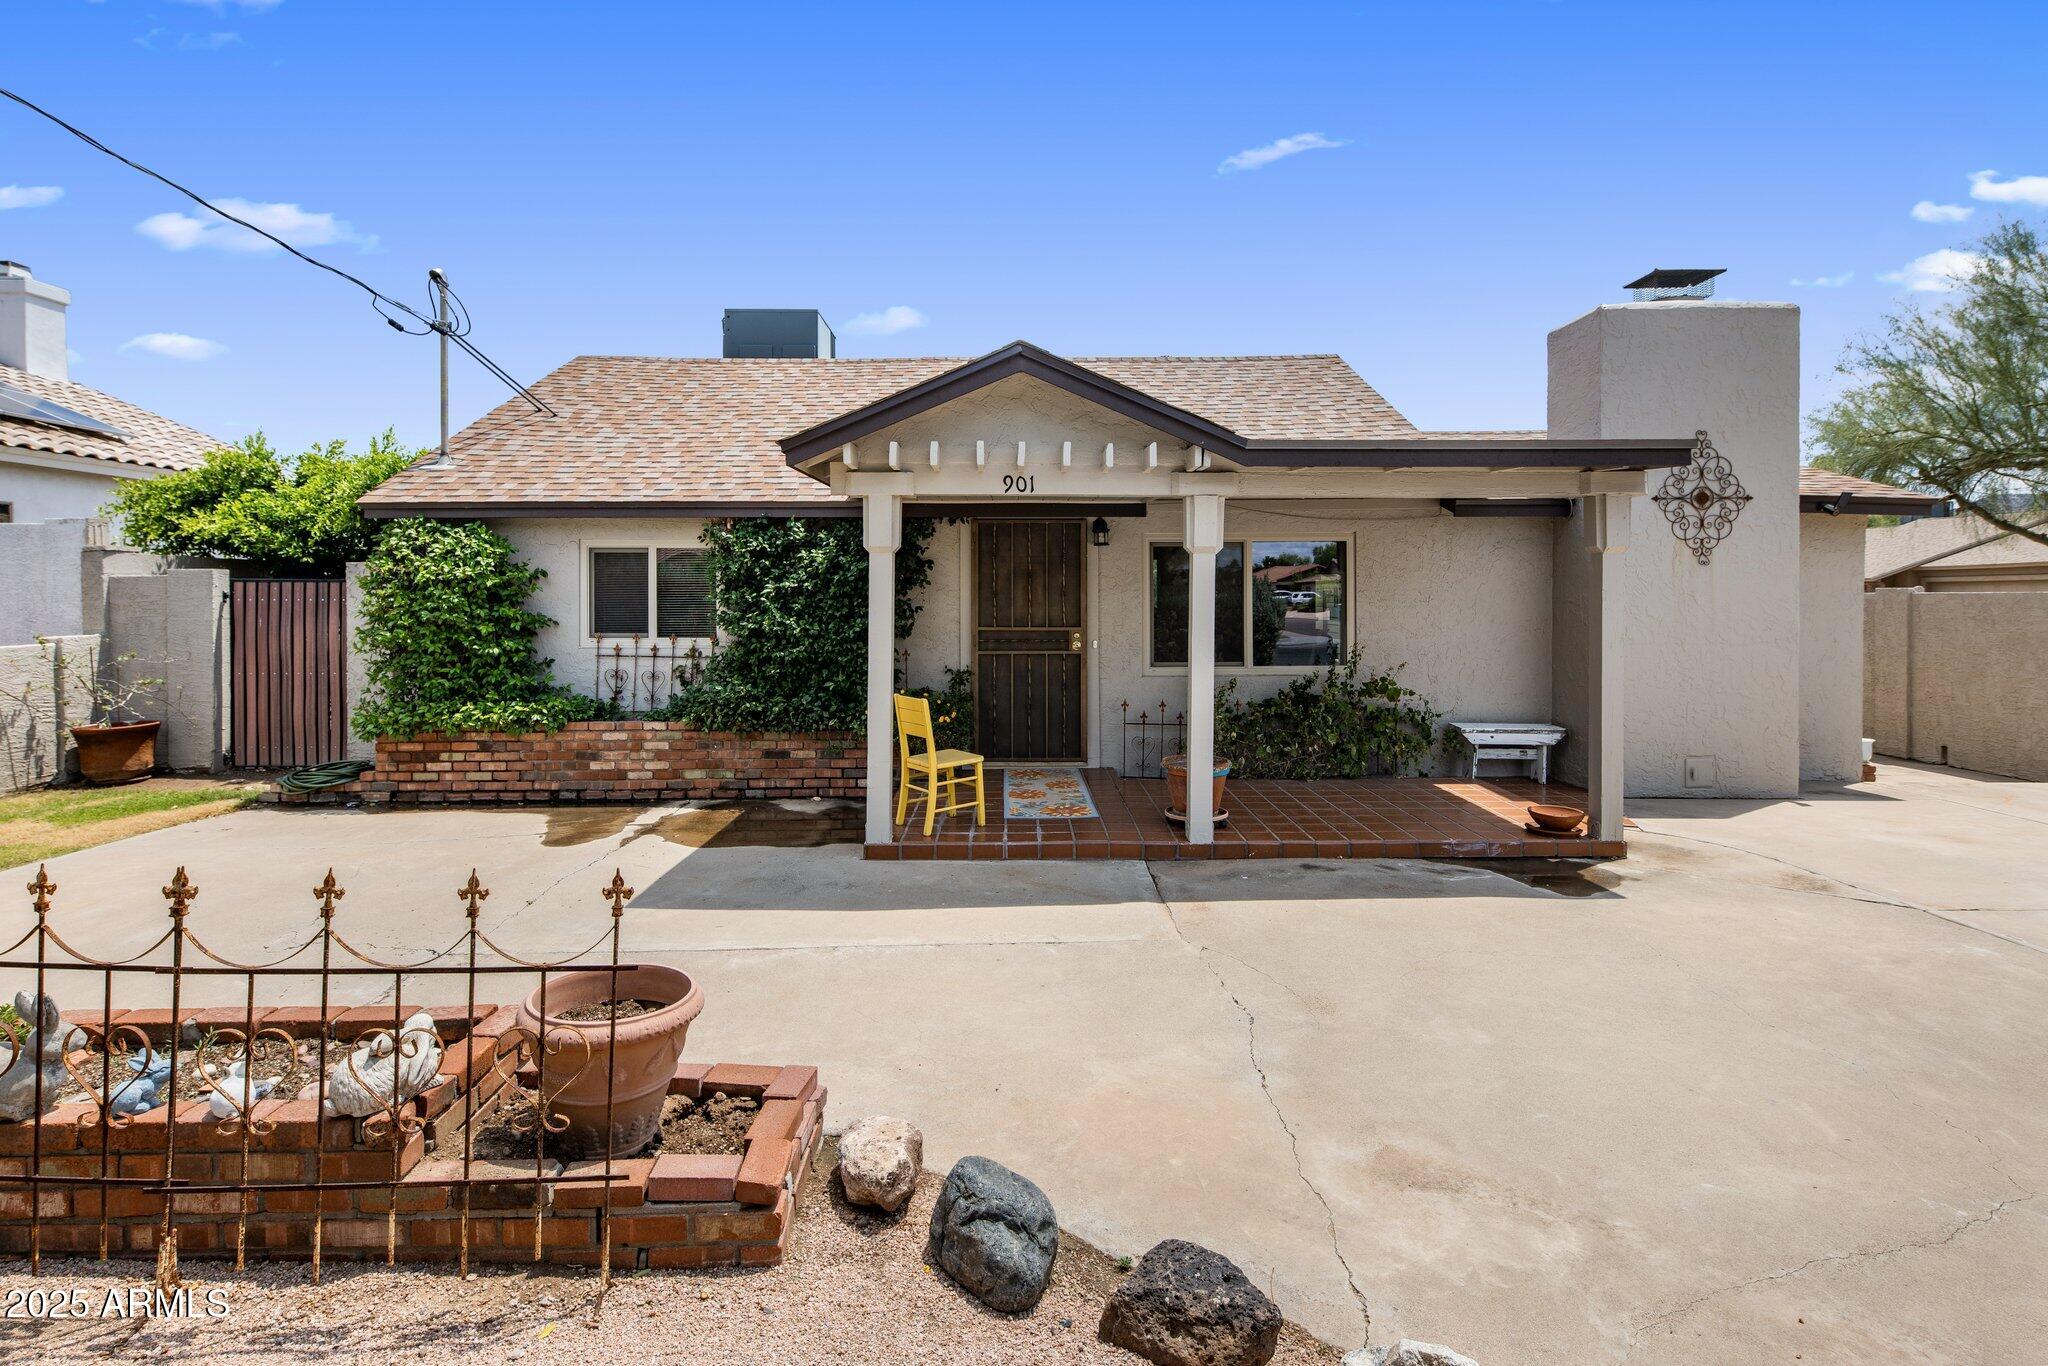
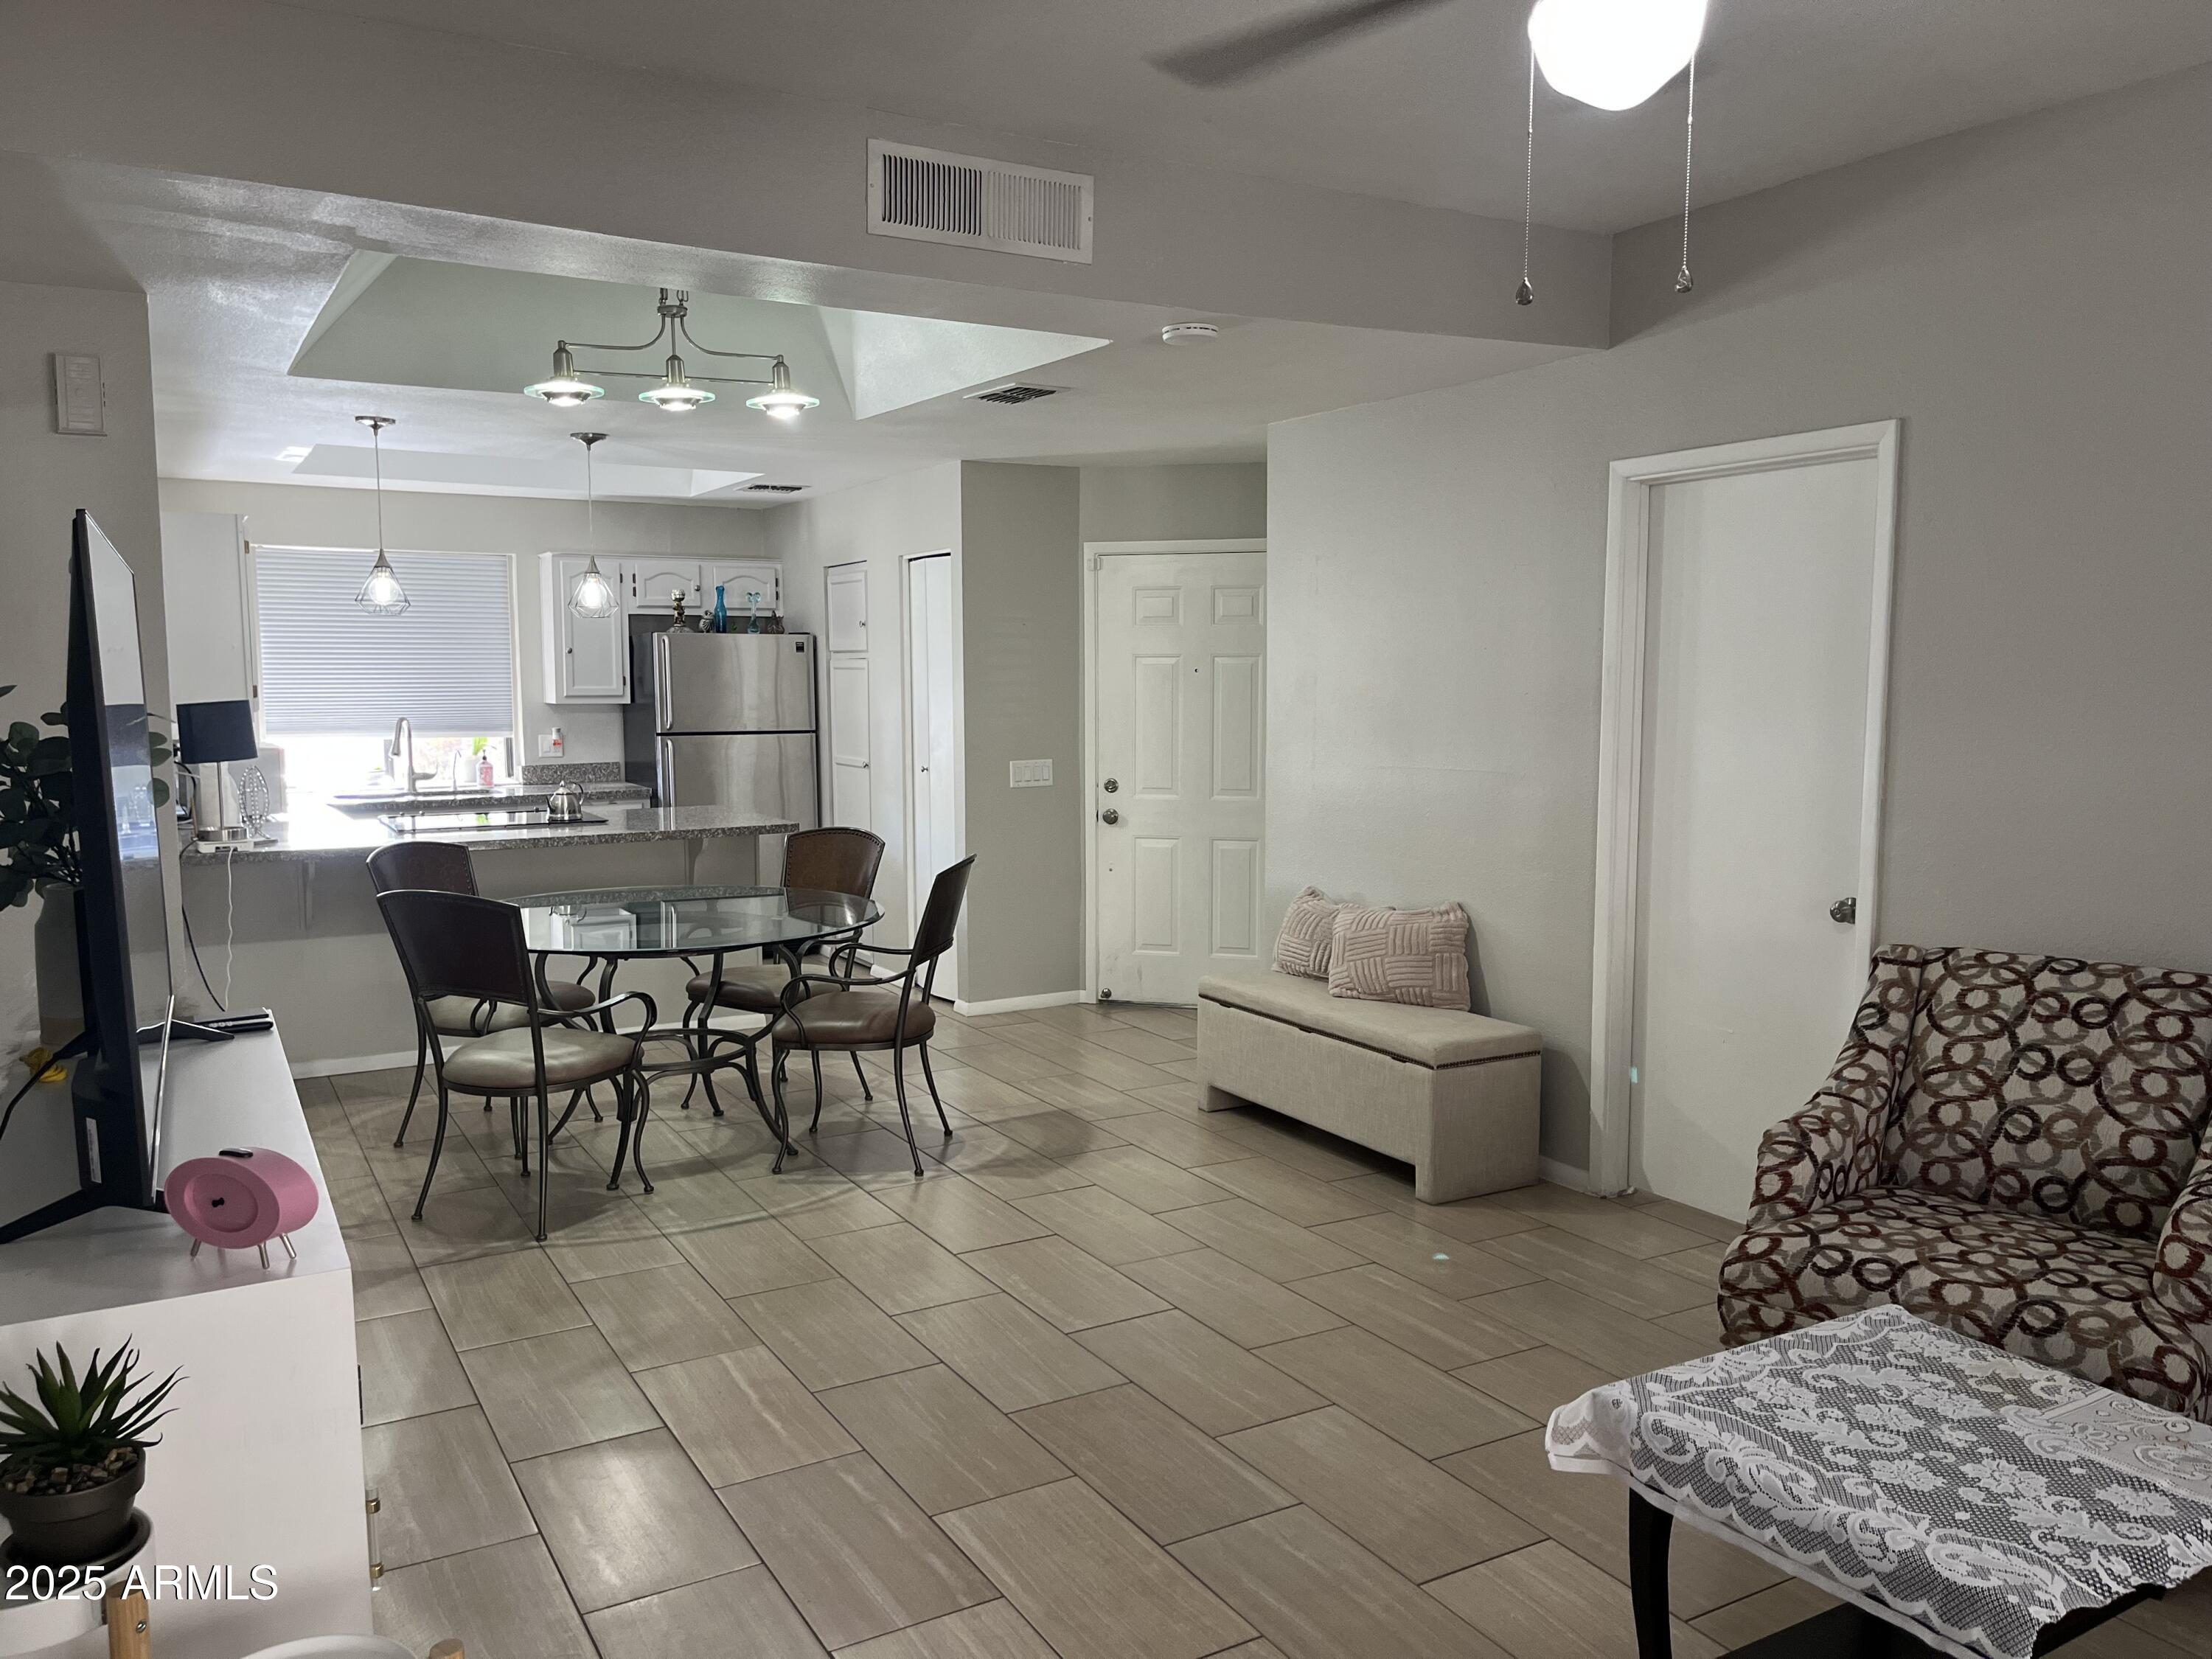
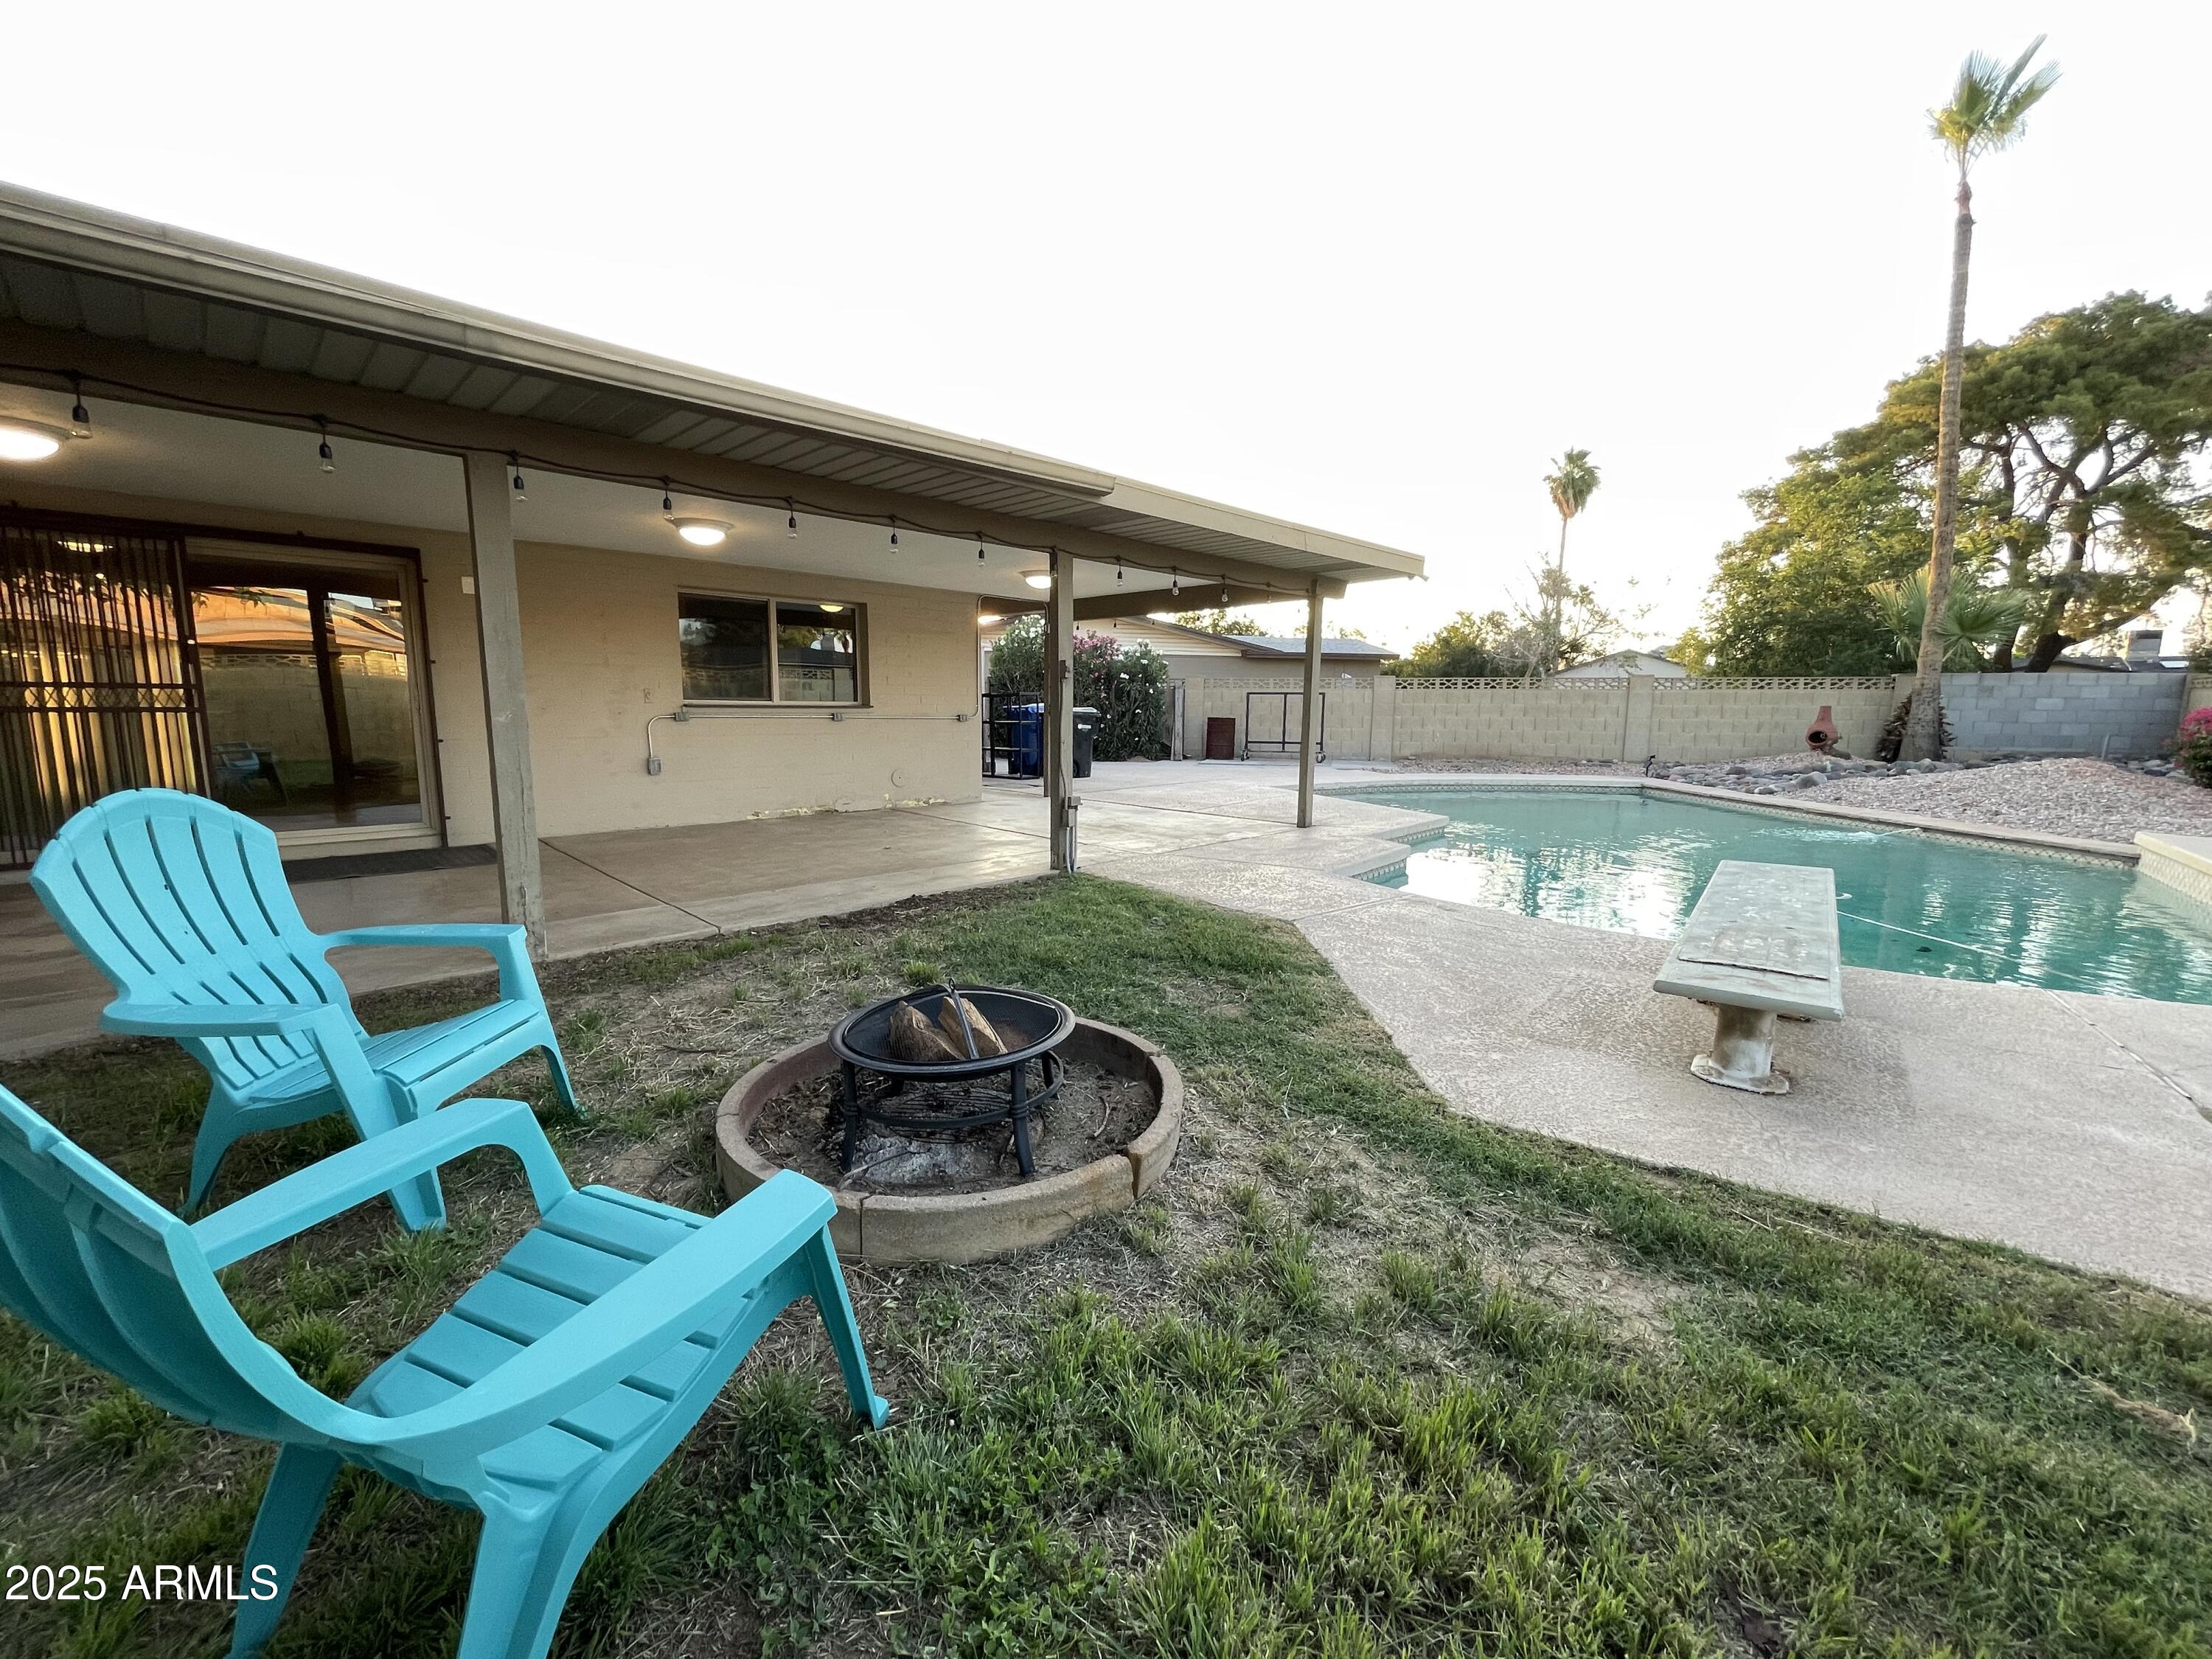
Active
$515,000
3
bds
|
2
ba
|
1,520
sqft
|
built
1957
901 E Hearn Rd, Phoenix, AZ 85022
$-1,053
Cash flow
-10.7%
Cash-on-Cash Return
3.2%
Cap rate
0.4%
Rent to Value Ratio
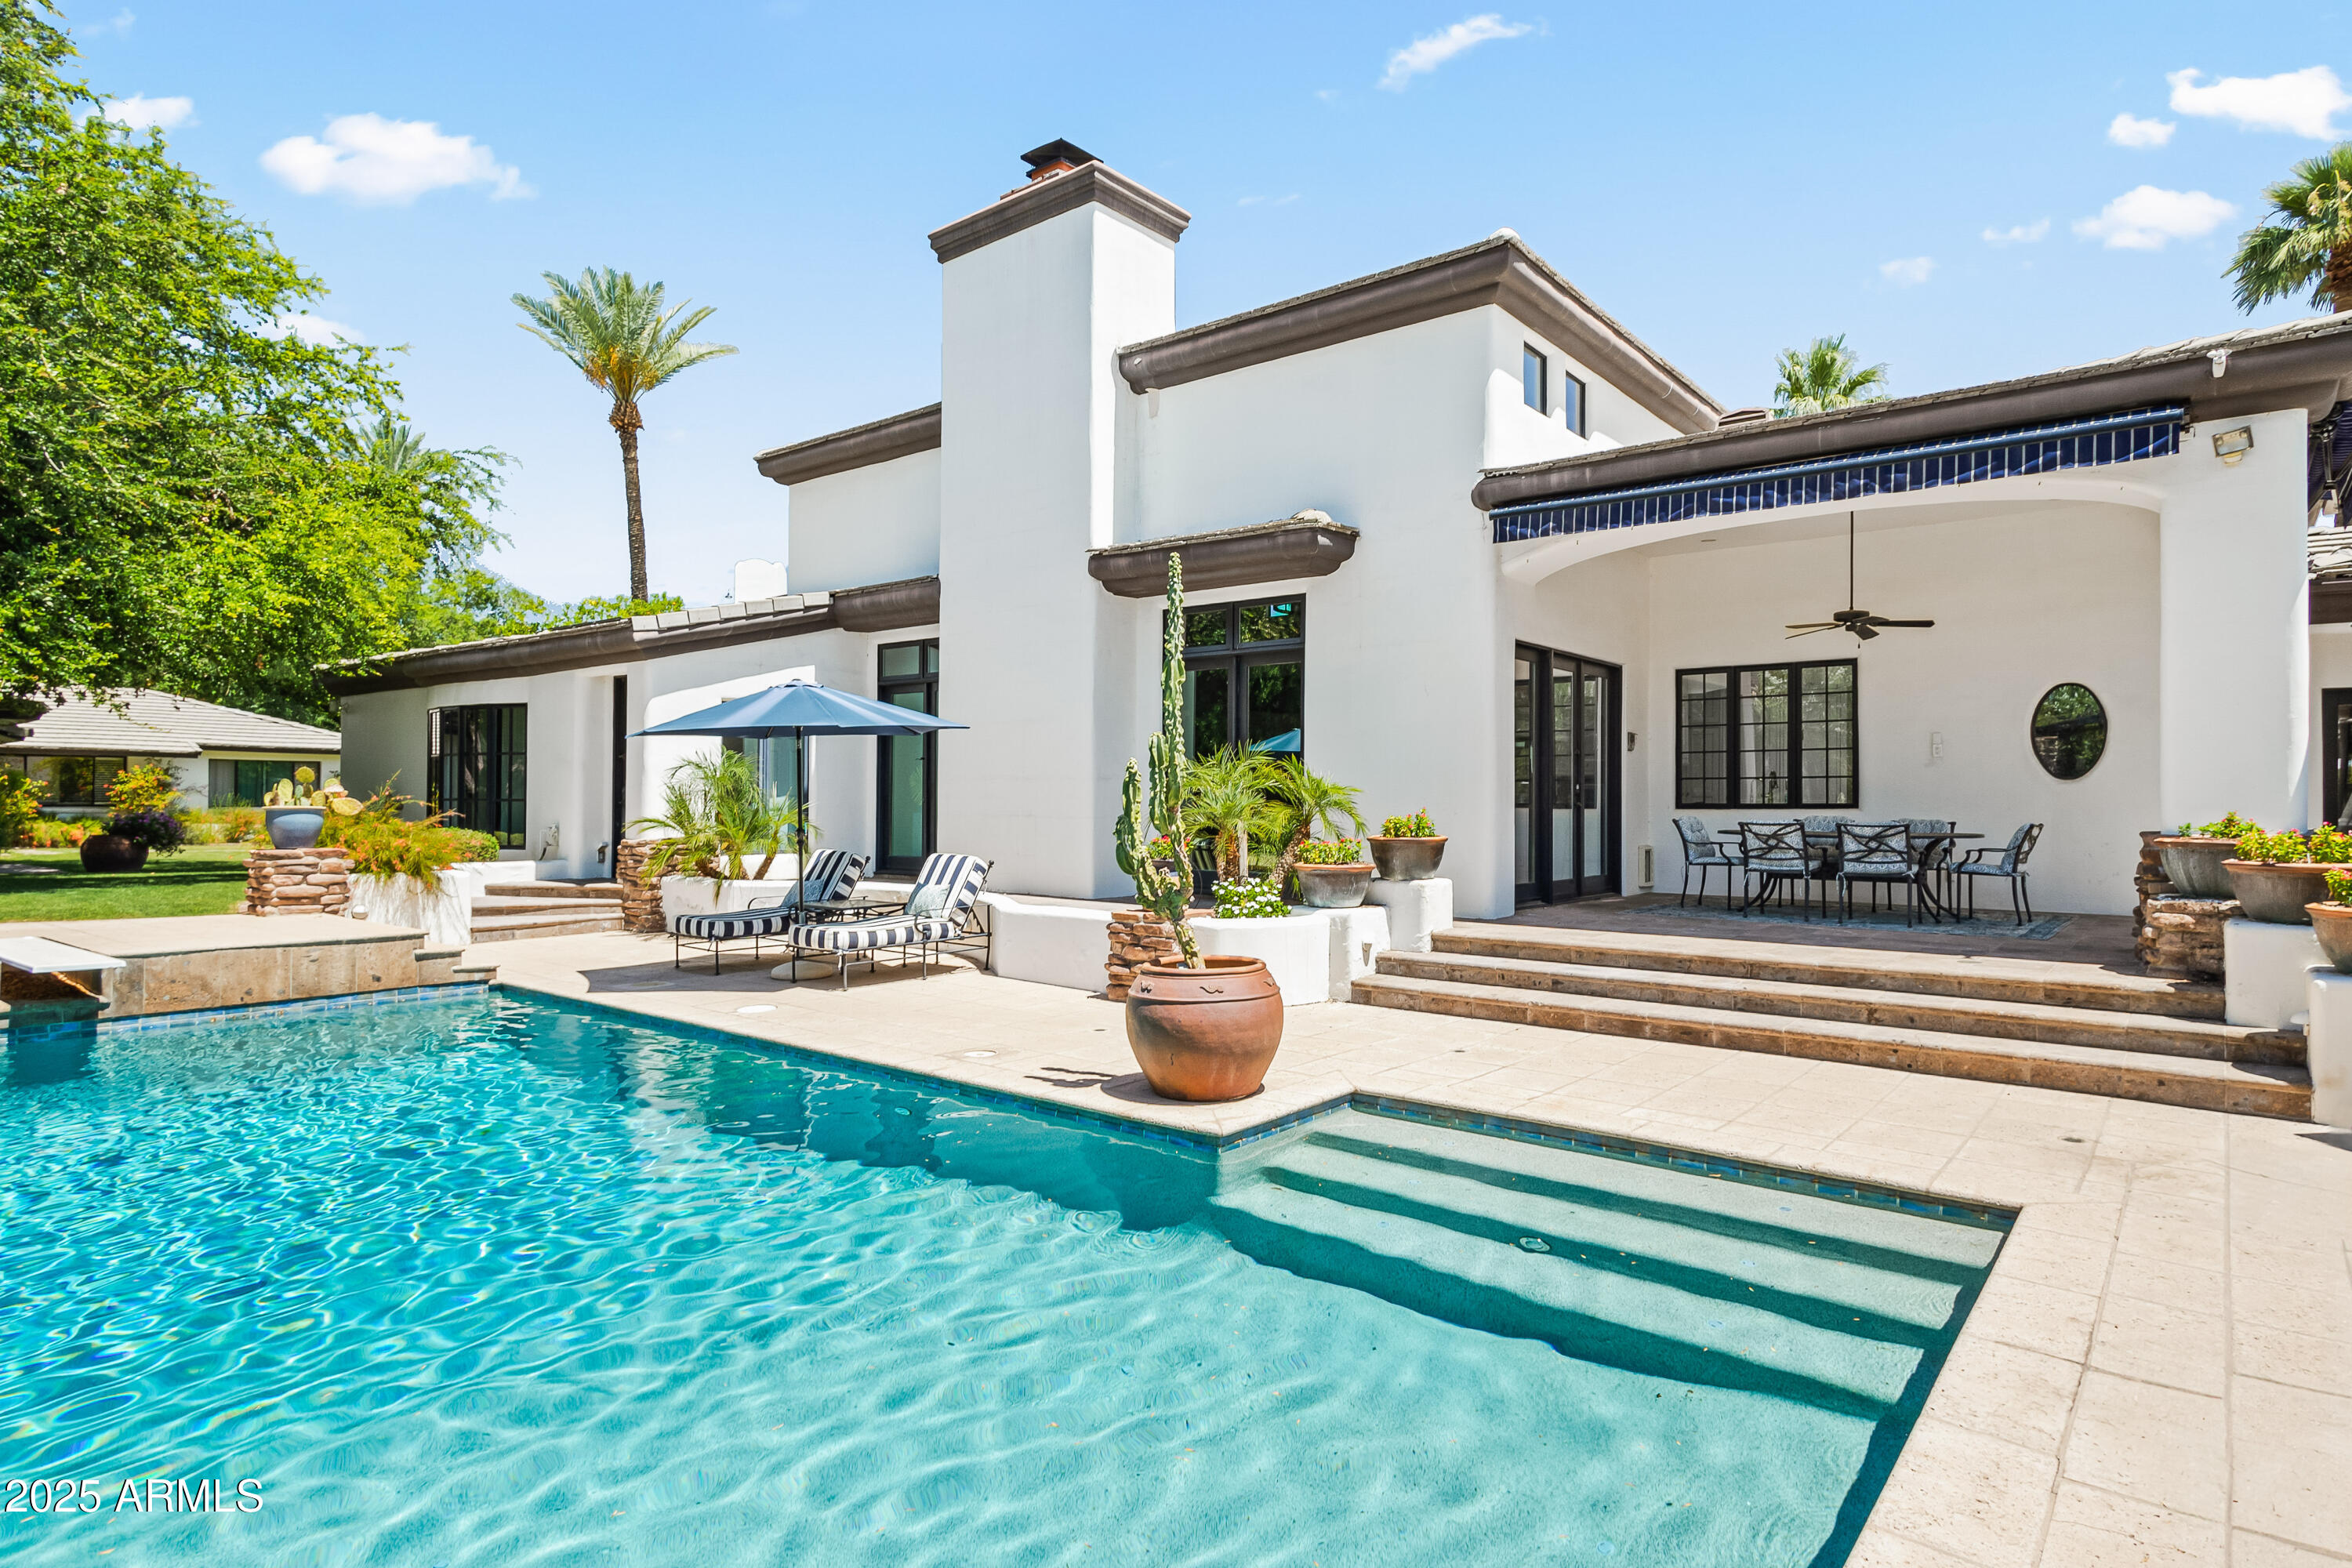
Active
$4,895,000
7
bds
|
8
ba
|
6,916
sqft
|
built
1992
5051 E Lafayette Blvd, Phoenix, AZ 85018
$-18,841
Cash flow
-20.1%
Cash-on-Cash Return
1.1%
Cap rate
0.2%
Rent to Value Ratio

Active
$1,650,000
4
bds
|
4
ba
|
2,798
sqft
|
built
2020
3808 E Fairmount Ave, Phoenix, AZ 85018
$-1,482
Cash flow
-4.7%
Cash-on-Cash Return
4.6%
Cap rate
0.6%
Rent to Value Ratio

Active
$895,000
4
bds
|
2
ba
|
2,172
sqft
|
built
2004
37918 N 21st Ave, Phoenix, AZ 85086
$-2,055
Cash flow
-12.0%
Cash-on-Cash Return
2.9%
Cap rate
0.4%
Rent to Value Ratio
Active
$549,000
3
bds
|
2
ba
|
1,851
sqft
|
built
1970
3444 E Paradise Dr, Phoenix, AZ 85028
$-1,155
Cash flow
-11.0%
Cash-on-Cash Return
3.2%
Cap rate
0.4%
Rent to Value Ratio
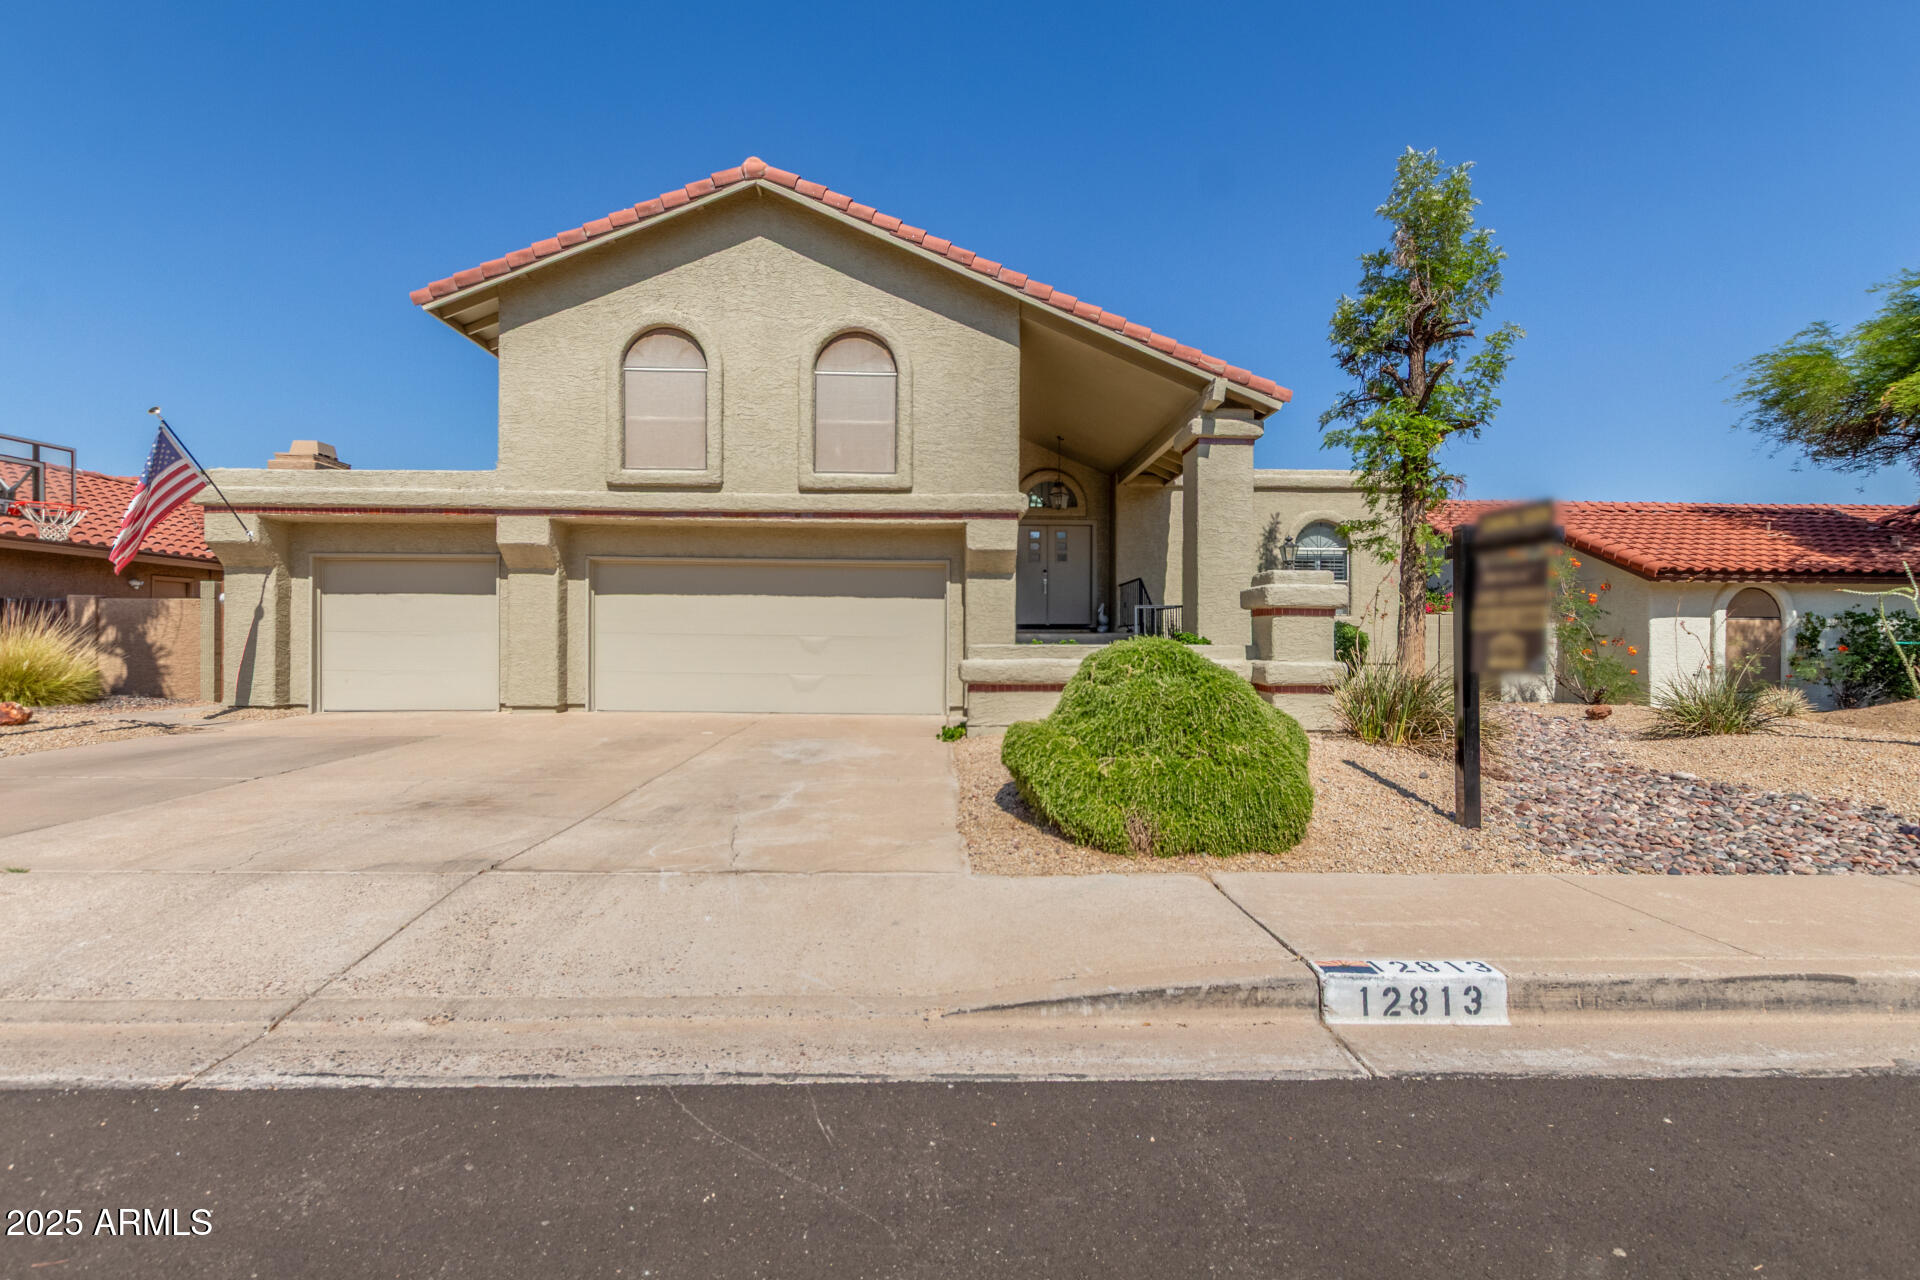
Active
$620,000
4
bds
|
3
ba
|
2,264
sqft
|
built
1986
12813 S 38th St, Phoenix, AZ 85044
$-1,059
Cash flow
-8.9%
Cash-on-Cash Return
3.6%
Cap rate
0.5%
Rent to Value Ratio
Active
$685,000
3
bds
|
2
ba
|
1,603
sqft
|
built
1957
125 E Loma Ln, Phoenix, AZ 85020
$-1,561
Cash flow
-11.9%
Cash-on-Cash Return
2.9%
Cap rate
0.4%
Rent to Value Ratio

Active
$700,000
4
bds
|
2
ba
|
2,204
sqft
|
built
1978
14830 N 28th Pl, Phoenix, AZ 85032
$-1,619
Cash flow
-12.1%
Cash-on-Cash Return
2.9%
Cap rate
0.4%
Rent to Value Ratio
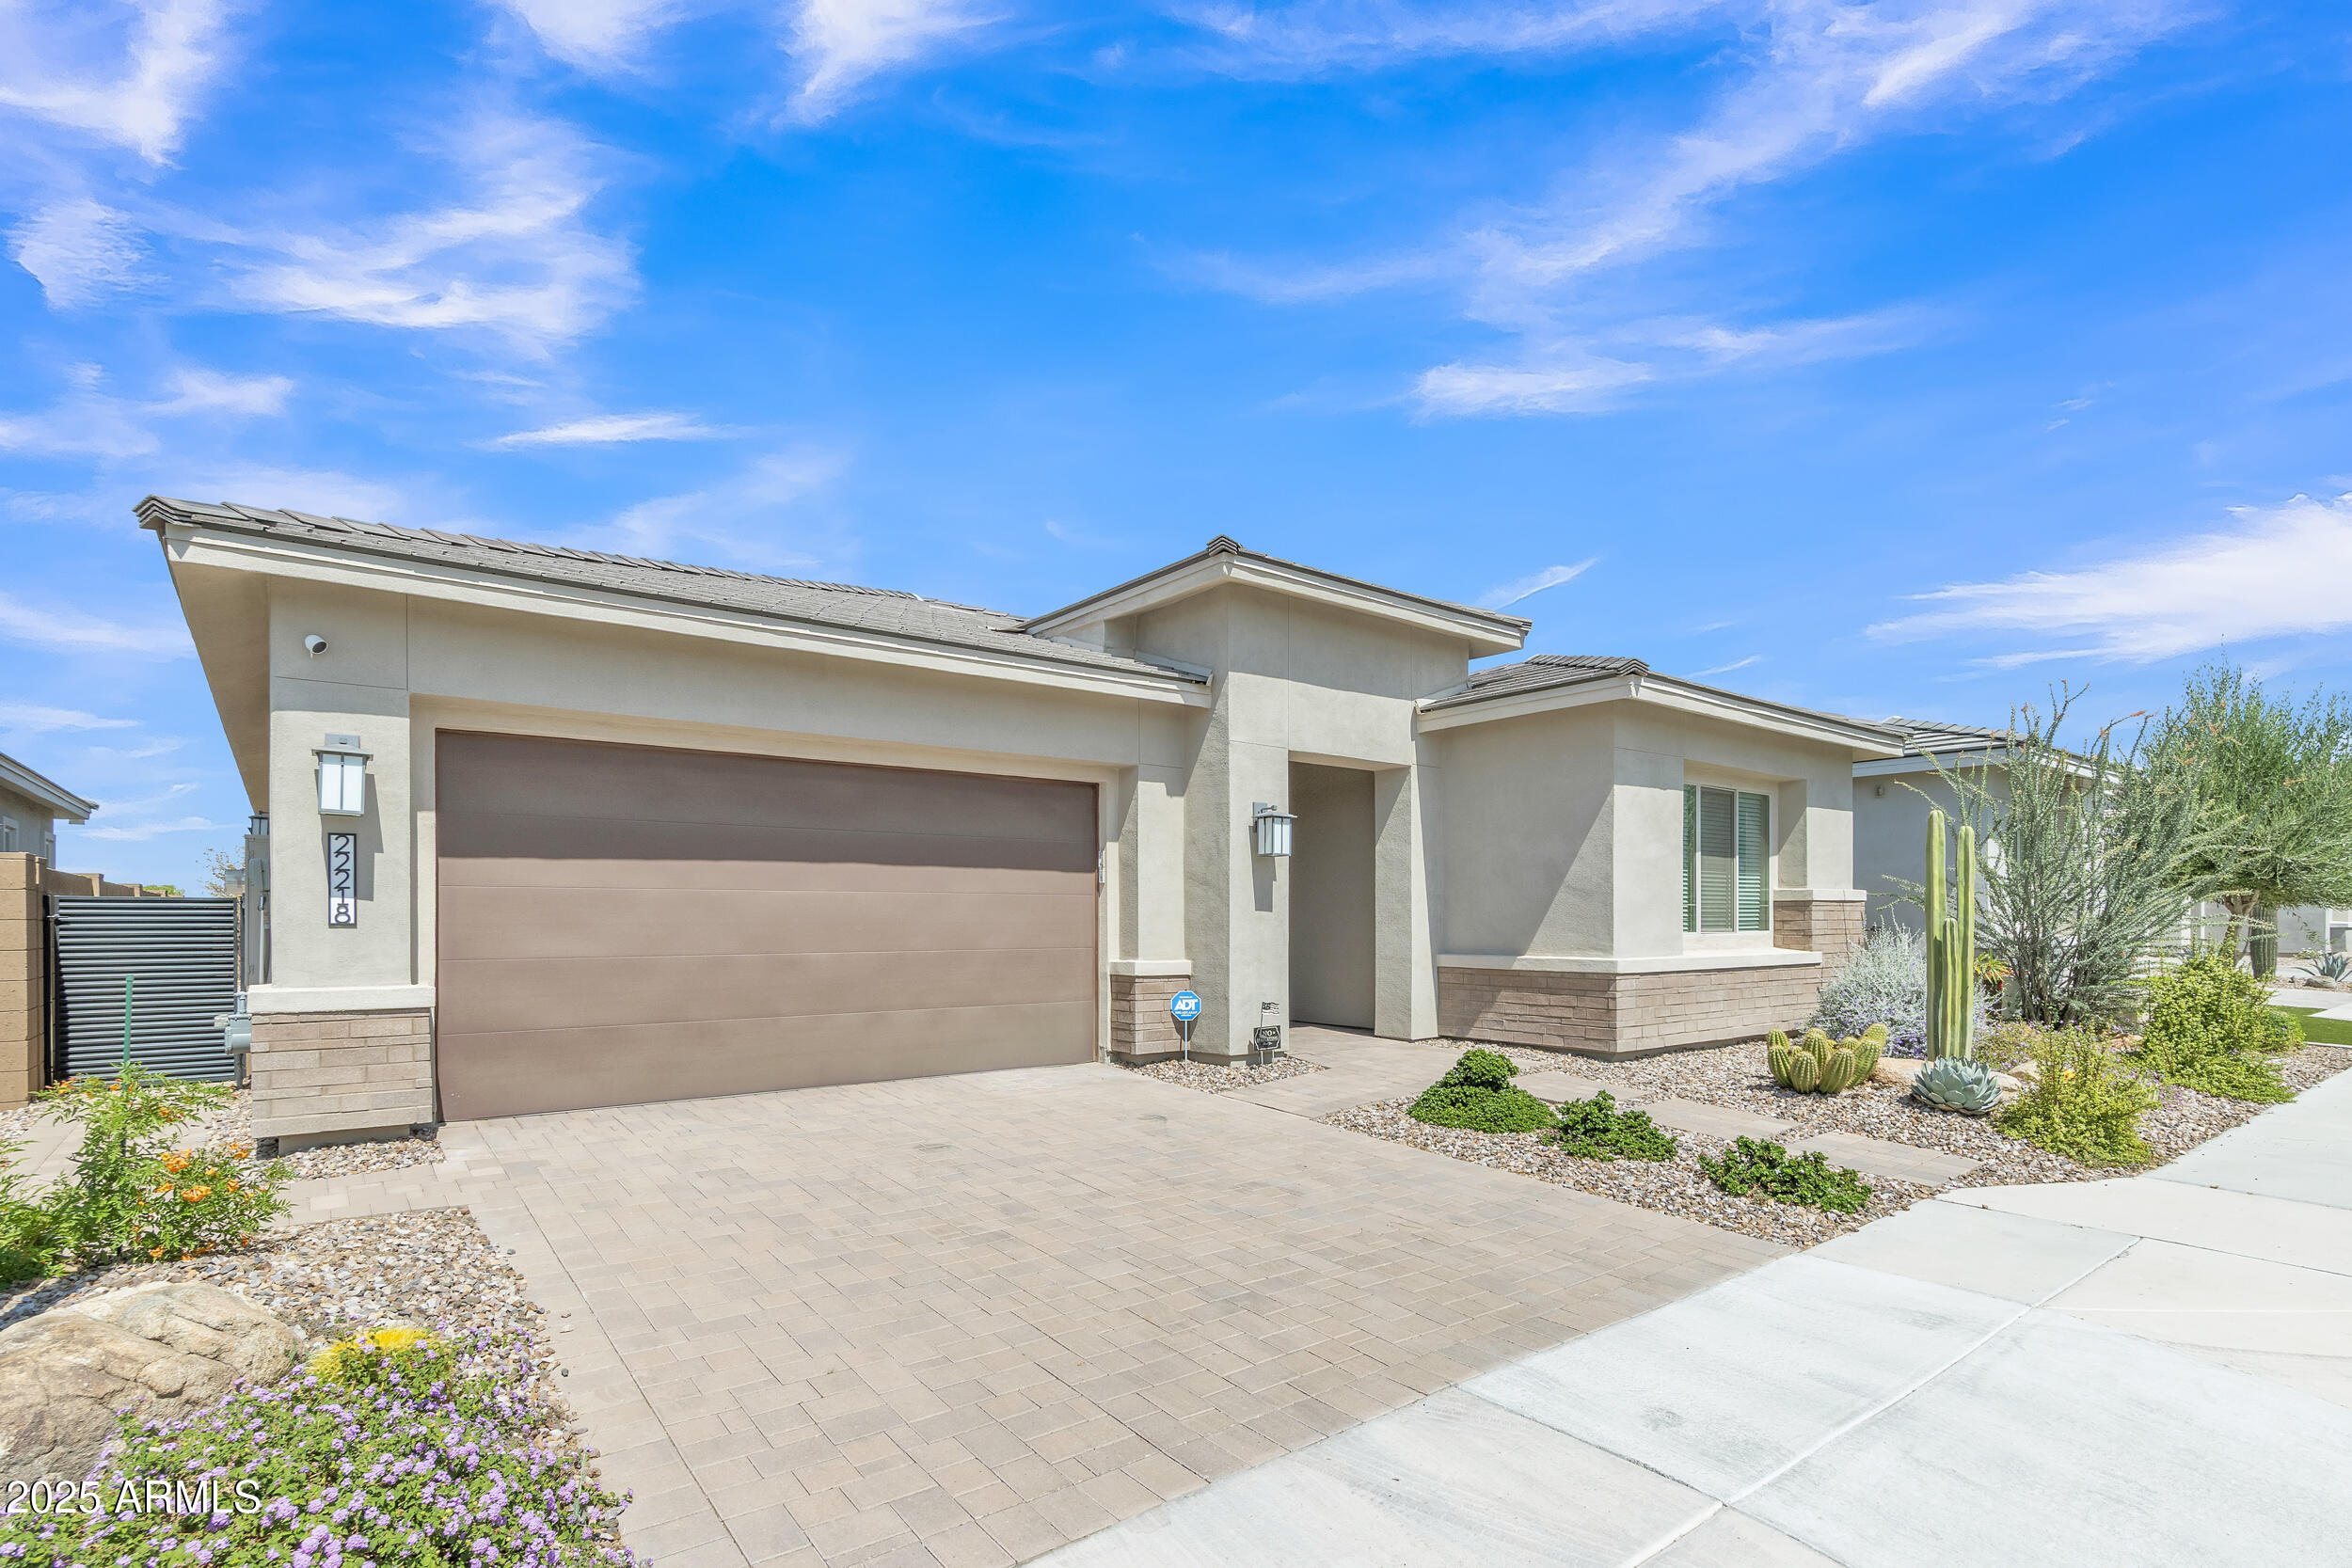
Active
$974,999
3
bds
|
3
ba
|
2,380
sqft
|
built
2020
22218 N 28th St, Phoenix, AZ 85050
$-2,768
Cash flow
-14.8%
Cash-on-Cash Return
2.3%
Cap rate
0.4%
Rent to Value Ratio
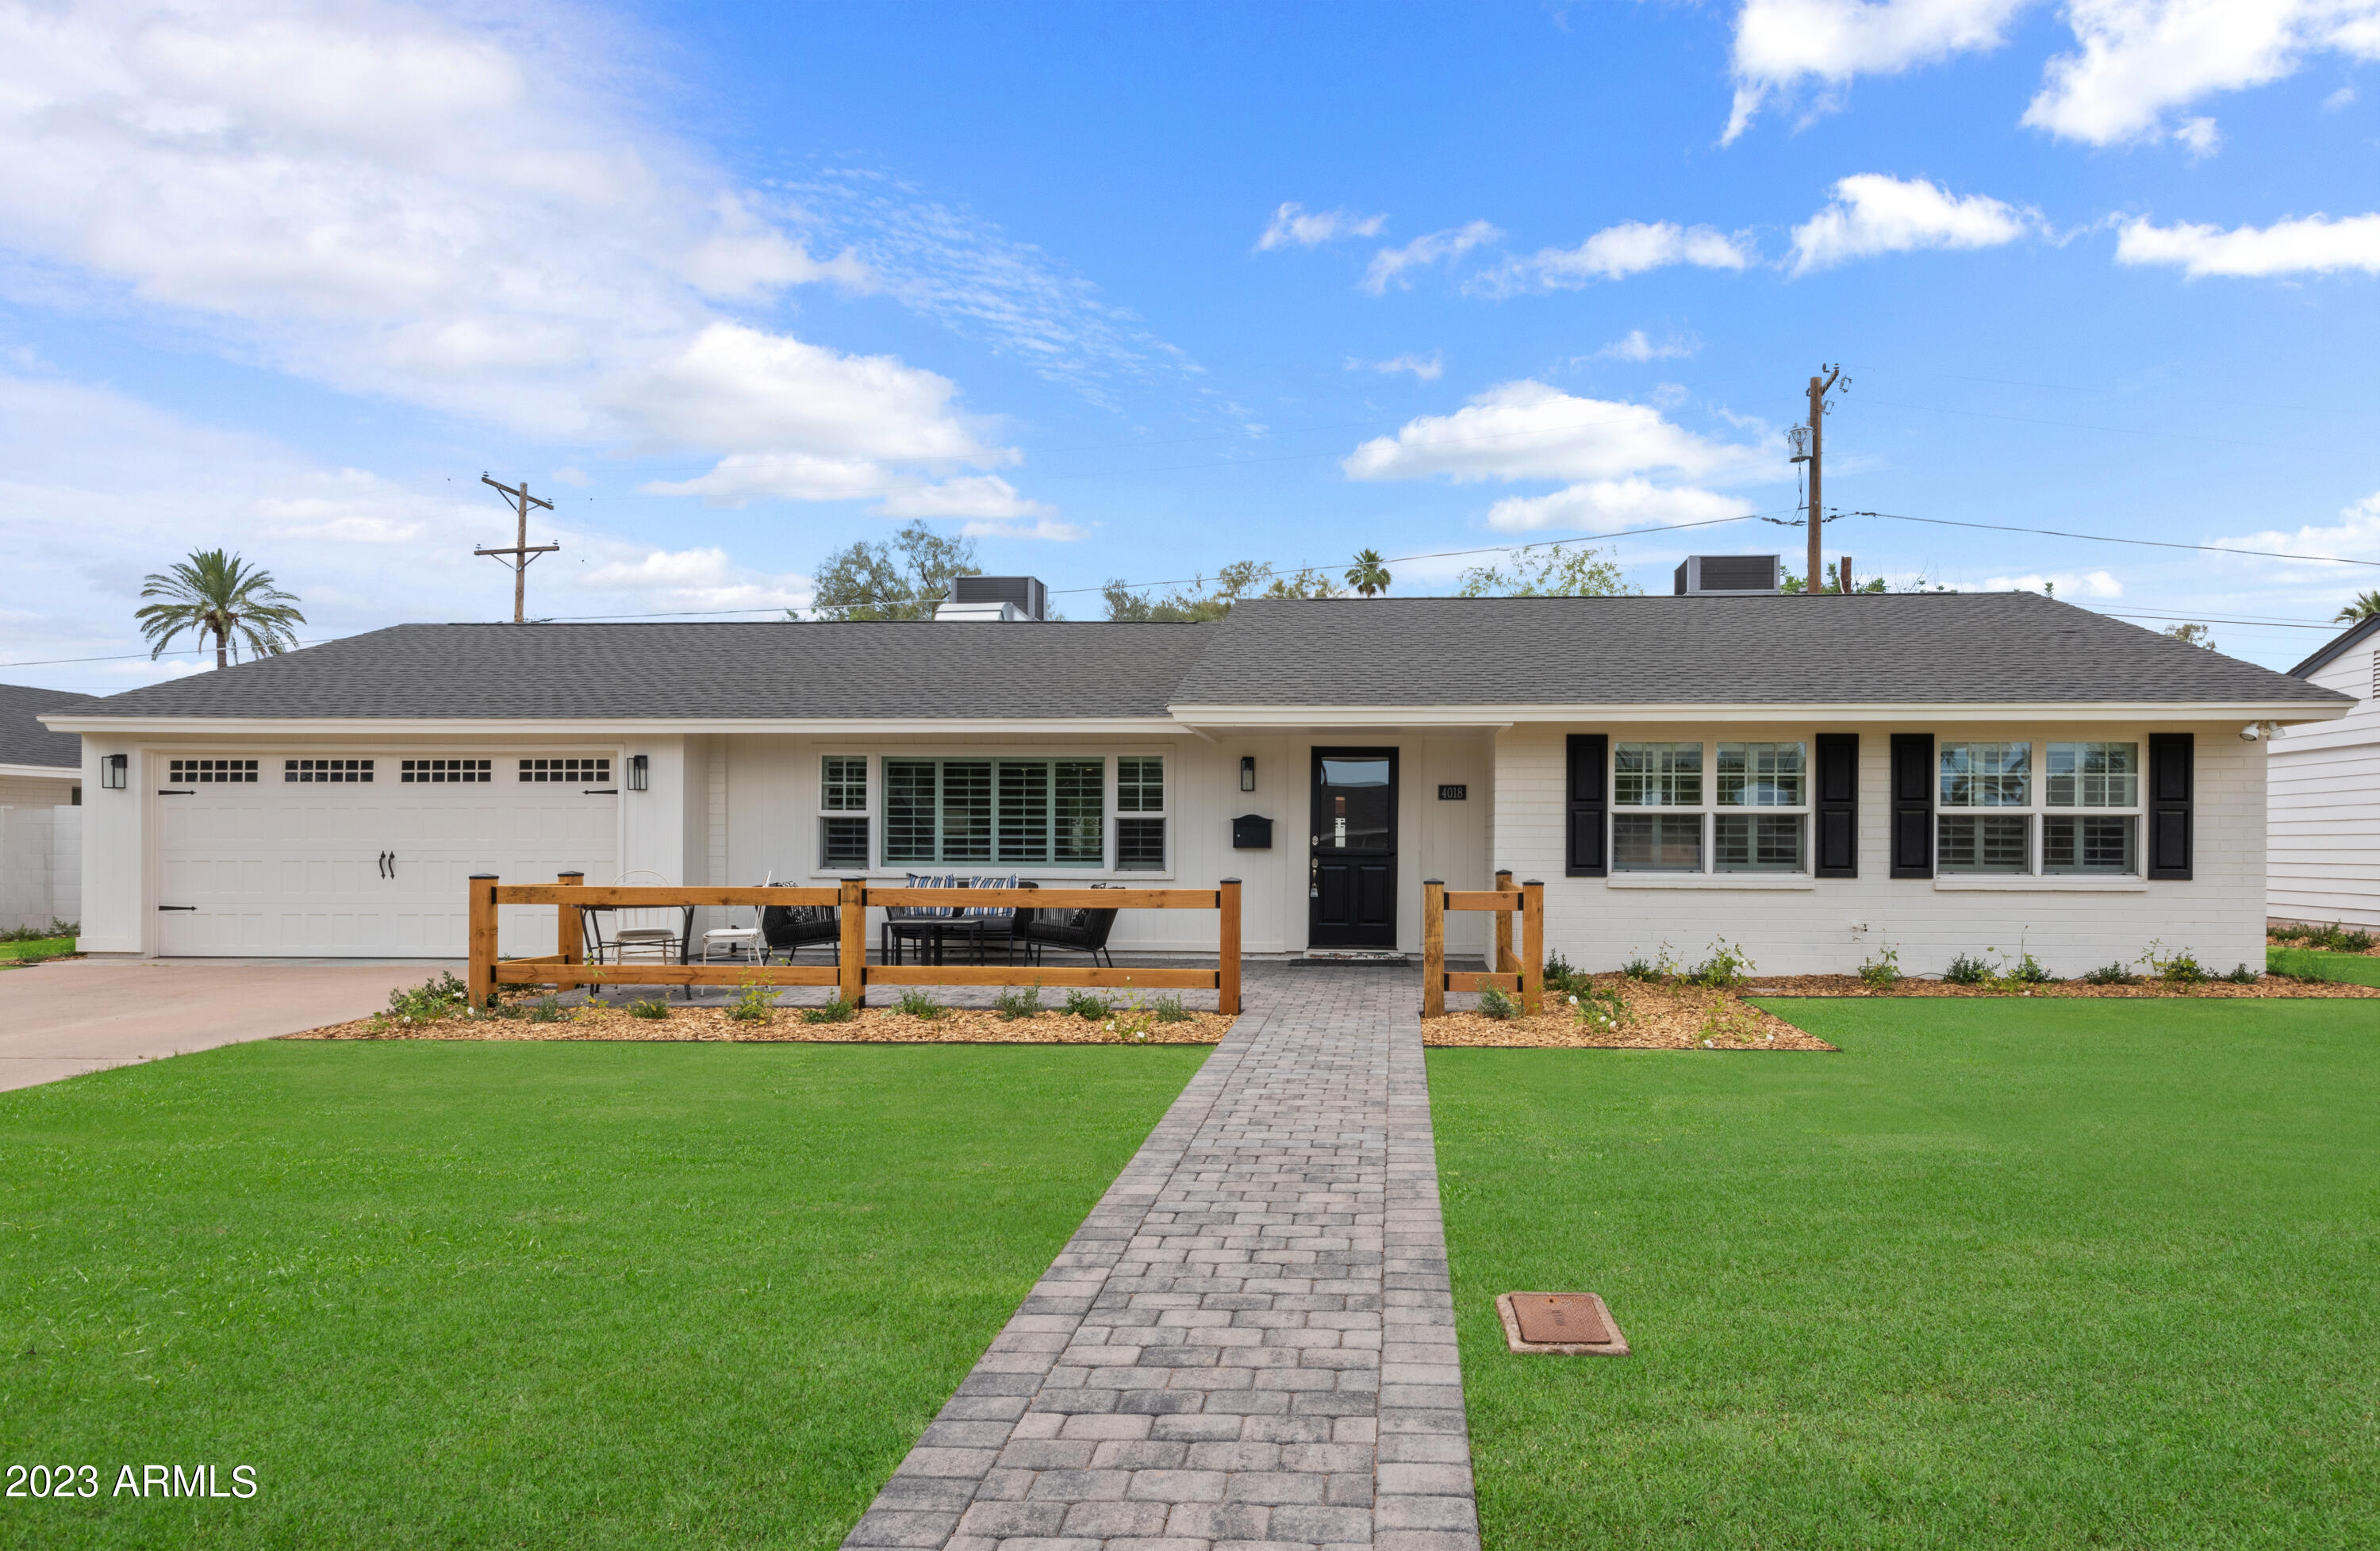
Active
$1,685,000
4
bds
|
2
ba
|
2,548
sqft
|
built
1958
4018 E Coolidge St, Phoenix, AZ 85018
$-4,352
Cash flow
-13.5%
Cash-on-Cash Return
2.6%
Cap rate
0.3%
Rent to Value Ratio
Active
$599,800
4
bds
|
2
ba
|
1,773
sqft
|
built
1954
7719 N 17th Ave, Phoenix, AZ 85021
$-1,194
Cash flow
-10.4%
Cash-on-Cash Return
3.3%
Cap rate
0.4%
Rent to Value Ratio
Active
$579,900
3
bds
|
2
ba
|
1,827
sqft
|
built
1995
4513 E Grovers Ave, Phoenix, AZ 85032
$-1,041
Cash flow
-9.4%
Cash-on-Cash Return
3.5%
Cap rate
0.5%
Rent to Value Ratio

Active
$650,000
2
bds
|
2
ba
|
1,605
sqft
|
built
1964
6302 N 13th Pl, Phoenix, AZ 85014
$-1,343
Cash flow
-10.8%
Cash-on-Cash Return
3.2%
Cap rate
0.4%
Rent to Value Ratio
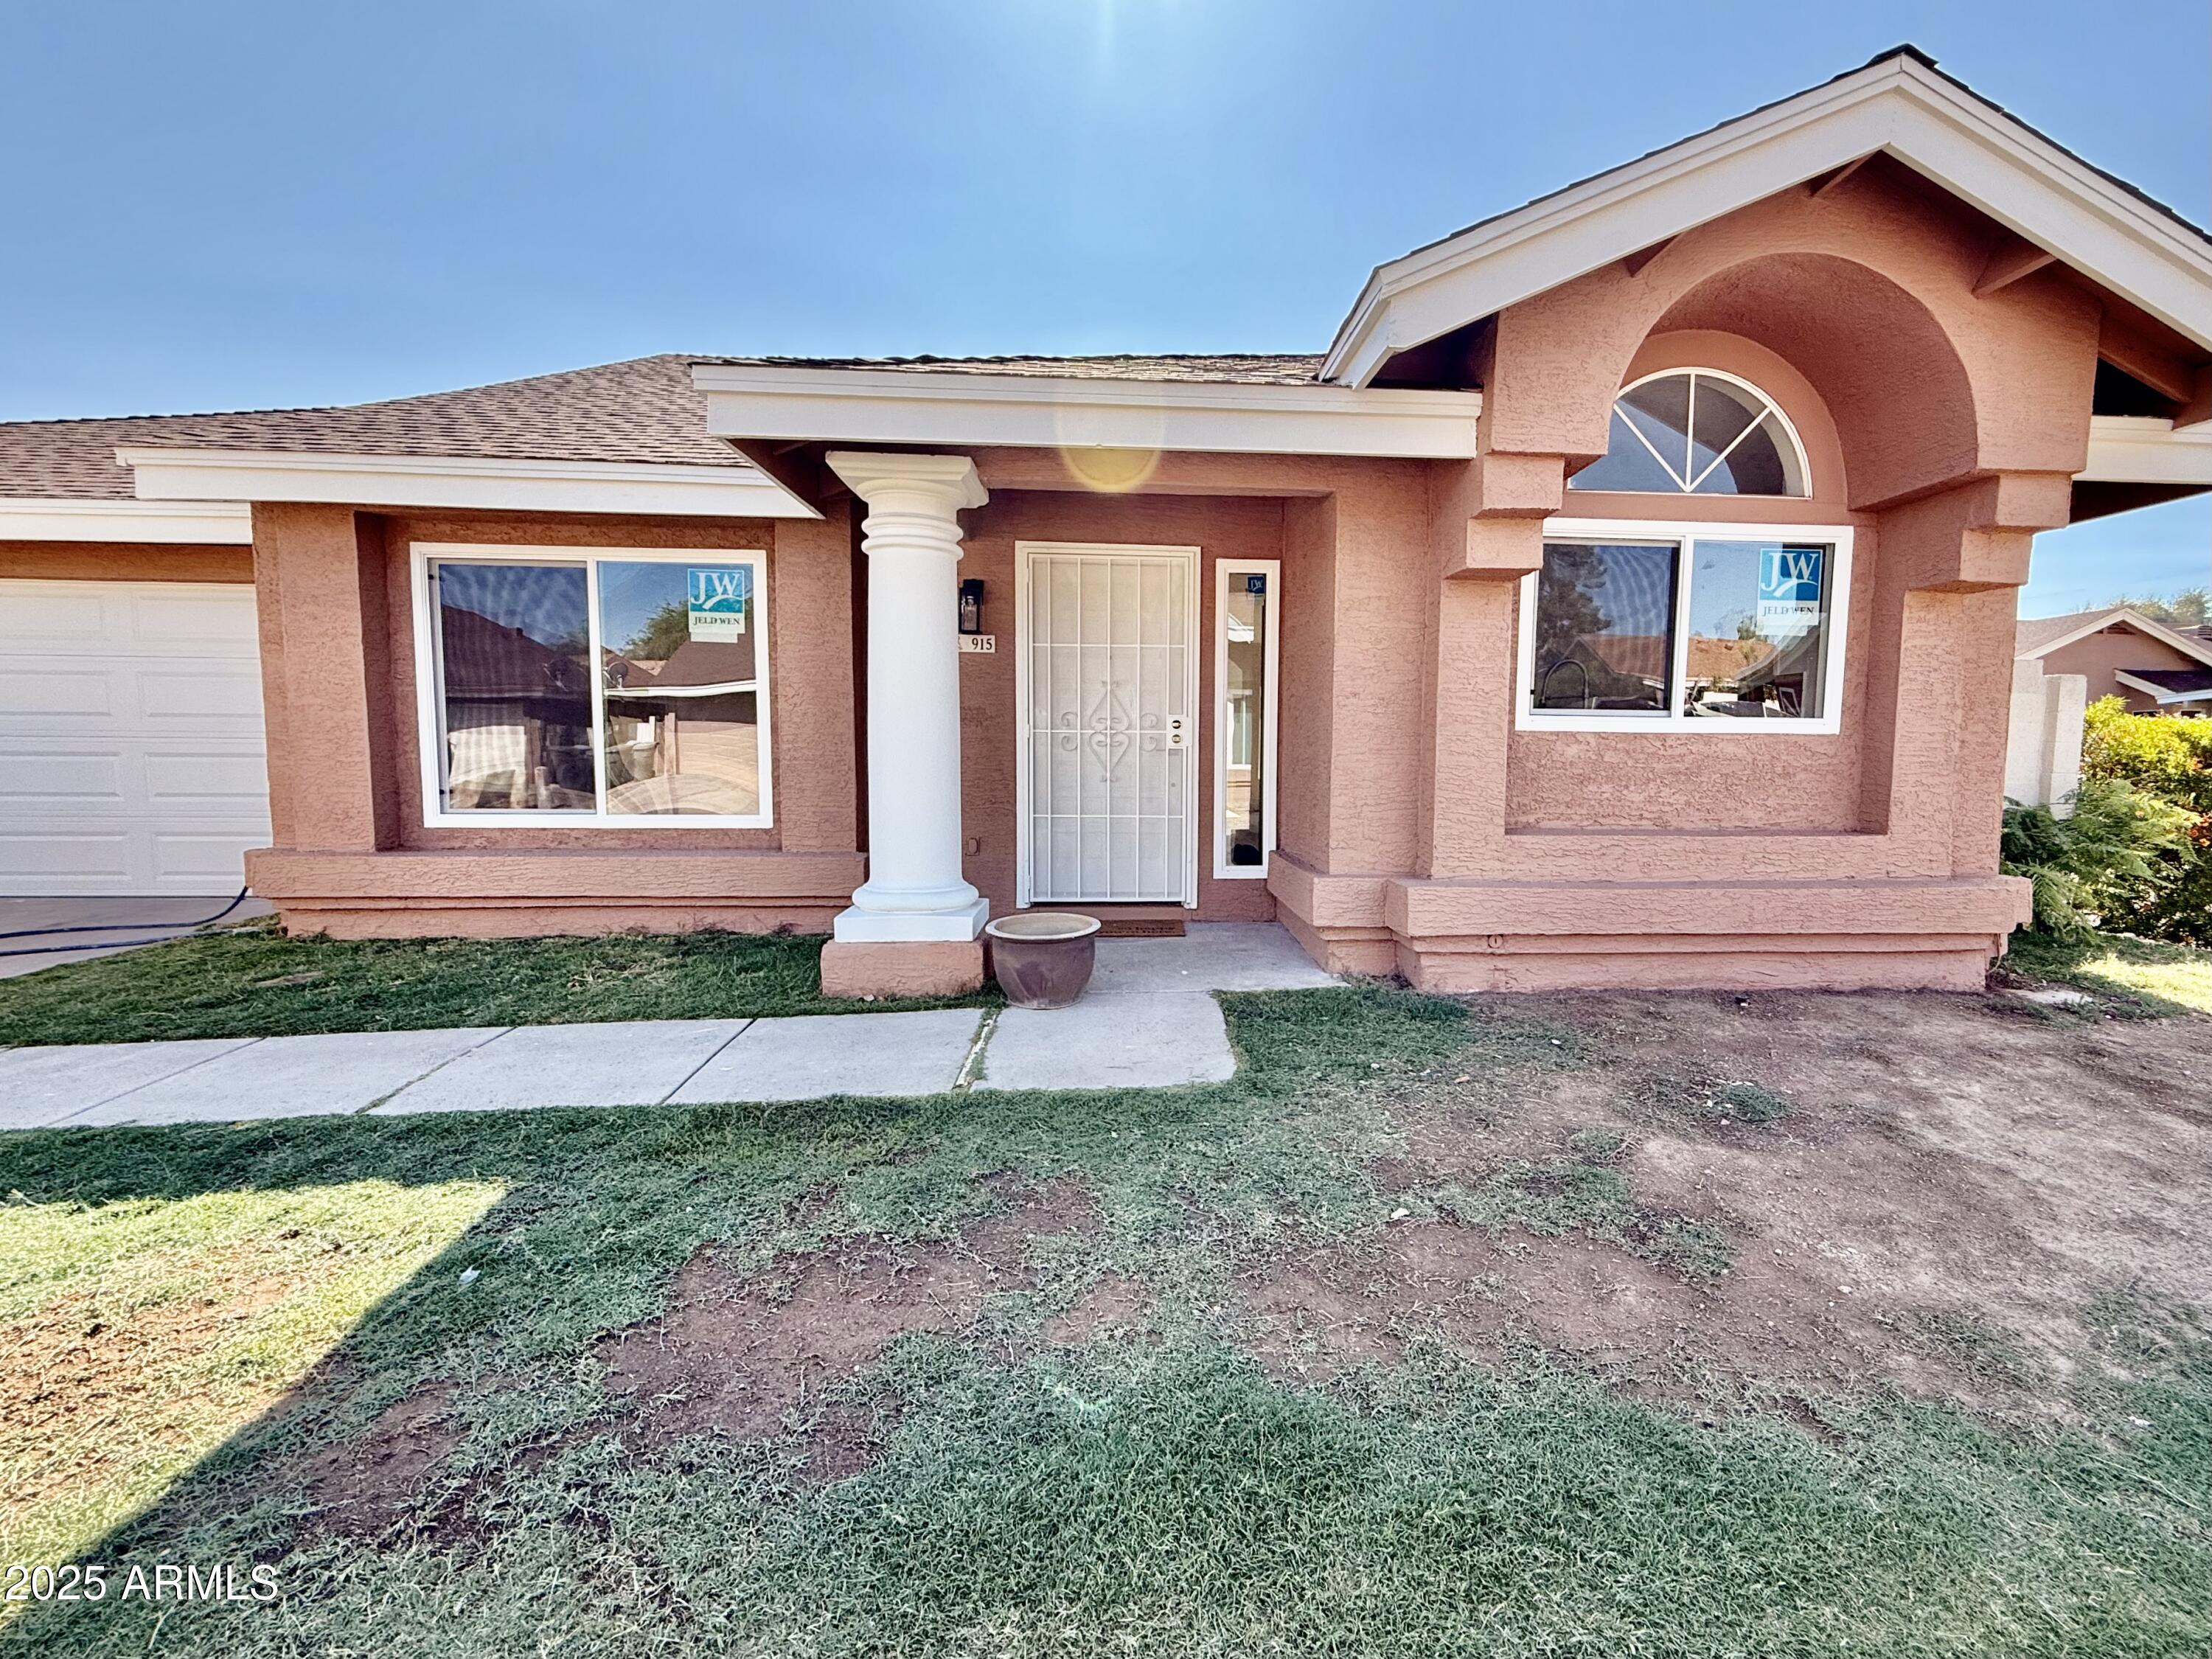
Active
$415,000
2
bds
|
2
ba
|
1,195
sqft
|
built
1990
915 E Annette Dr, Phoenix, AZ 85022
$-722
Cash flow
-9.1%
Cash-on-Cash Return
3.6%
Cap rate
0.5%
Rent to Value Ratio
Active
$489,999
4
bds
|
3
ba
|
2,029
sqft
|
built
1958
121 E Monte Way, Phoenix, AZ 85042
$-601
Cash flow
-6.4%
Cash-on-Cash Return
4.2%
Cap rate
0.6%
Rent to Value Ratio
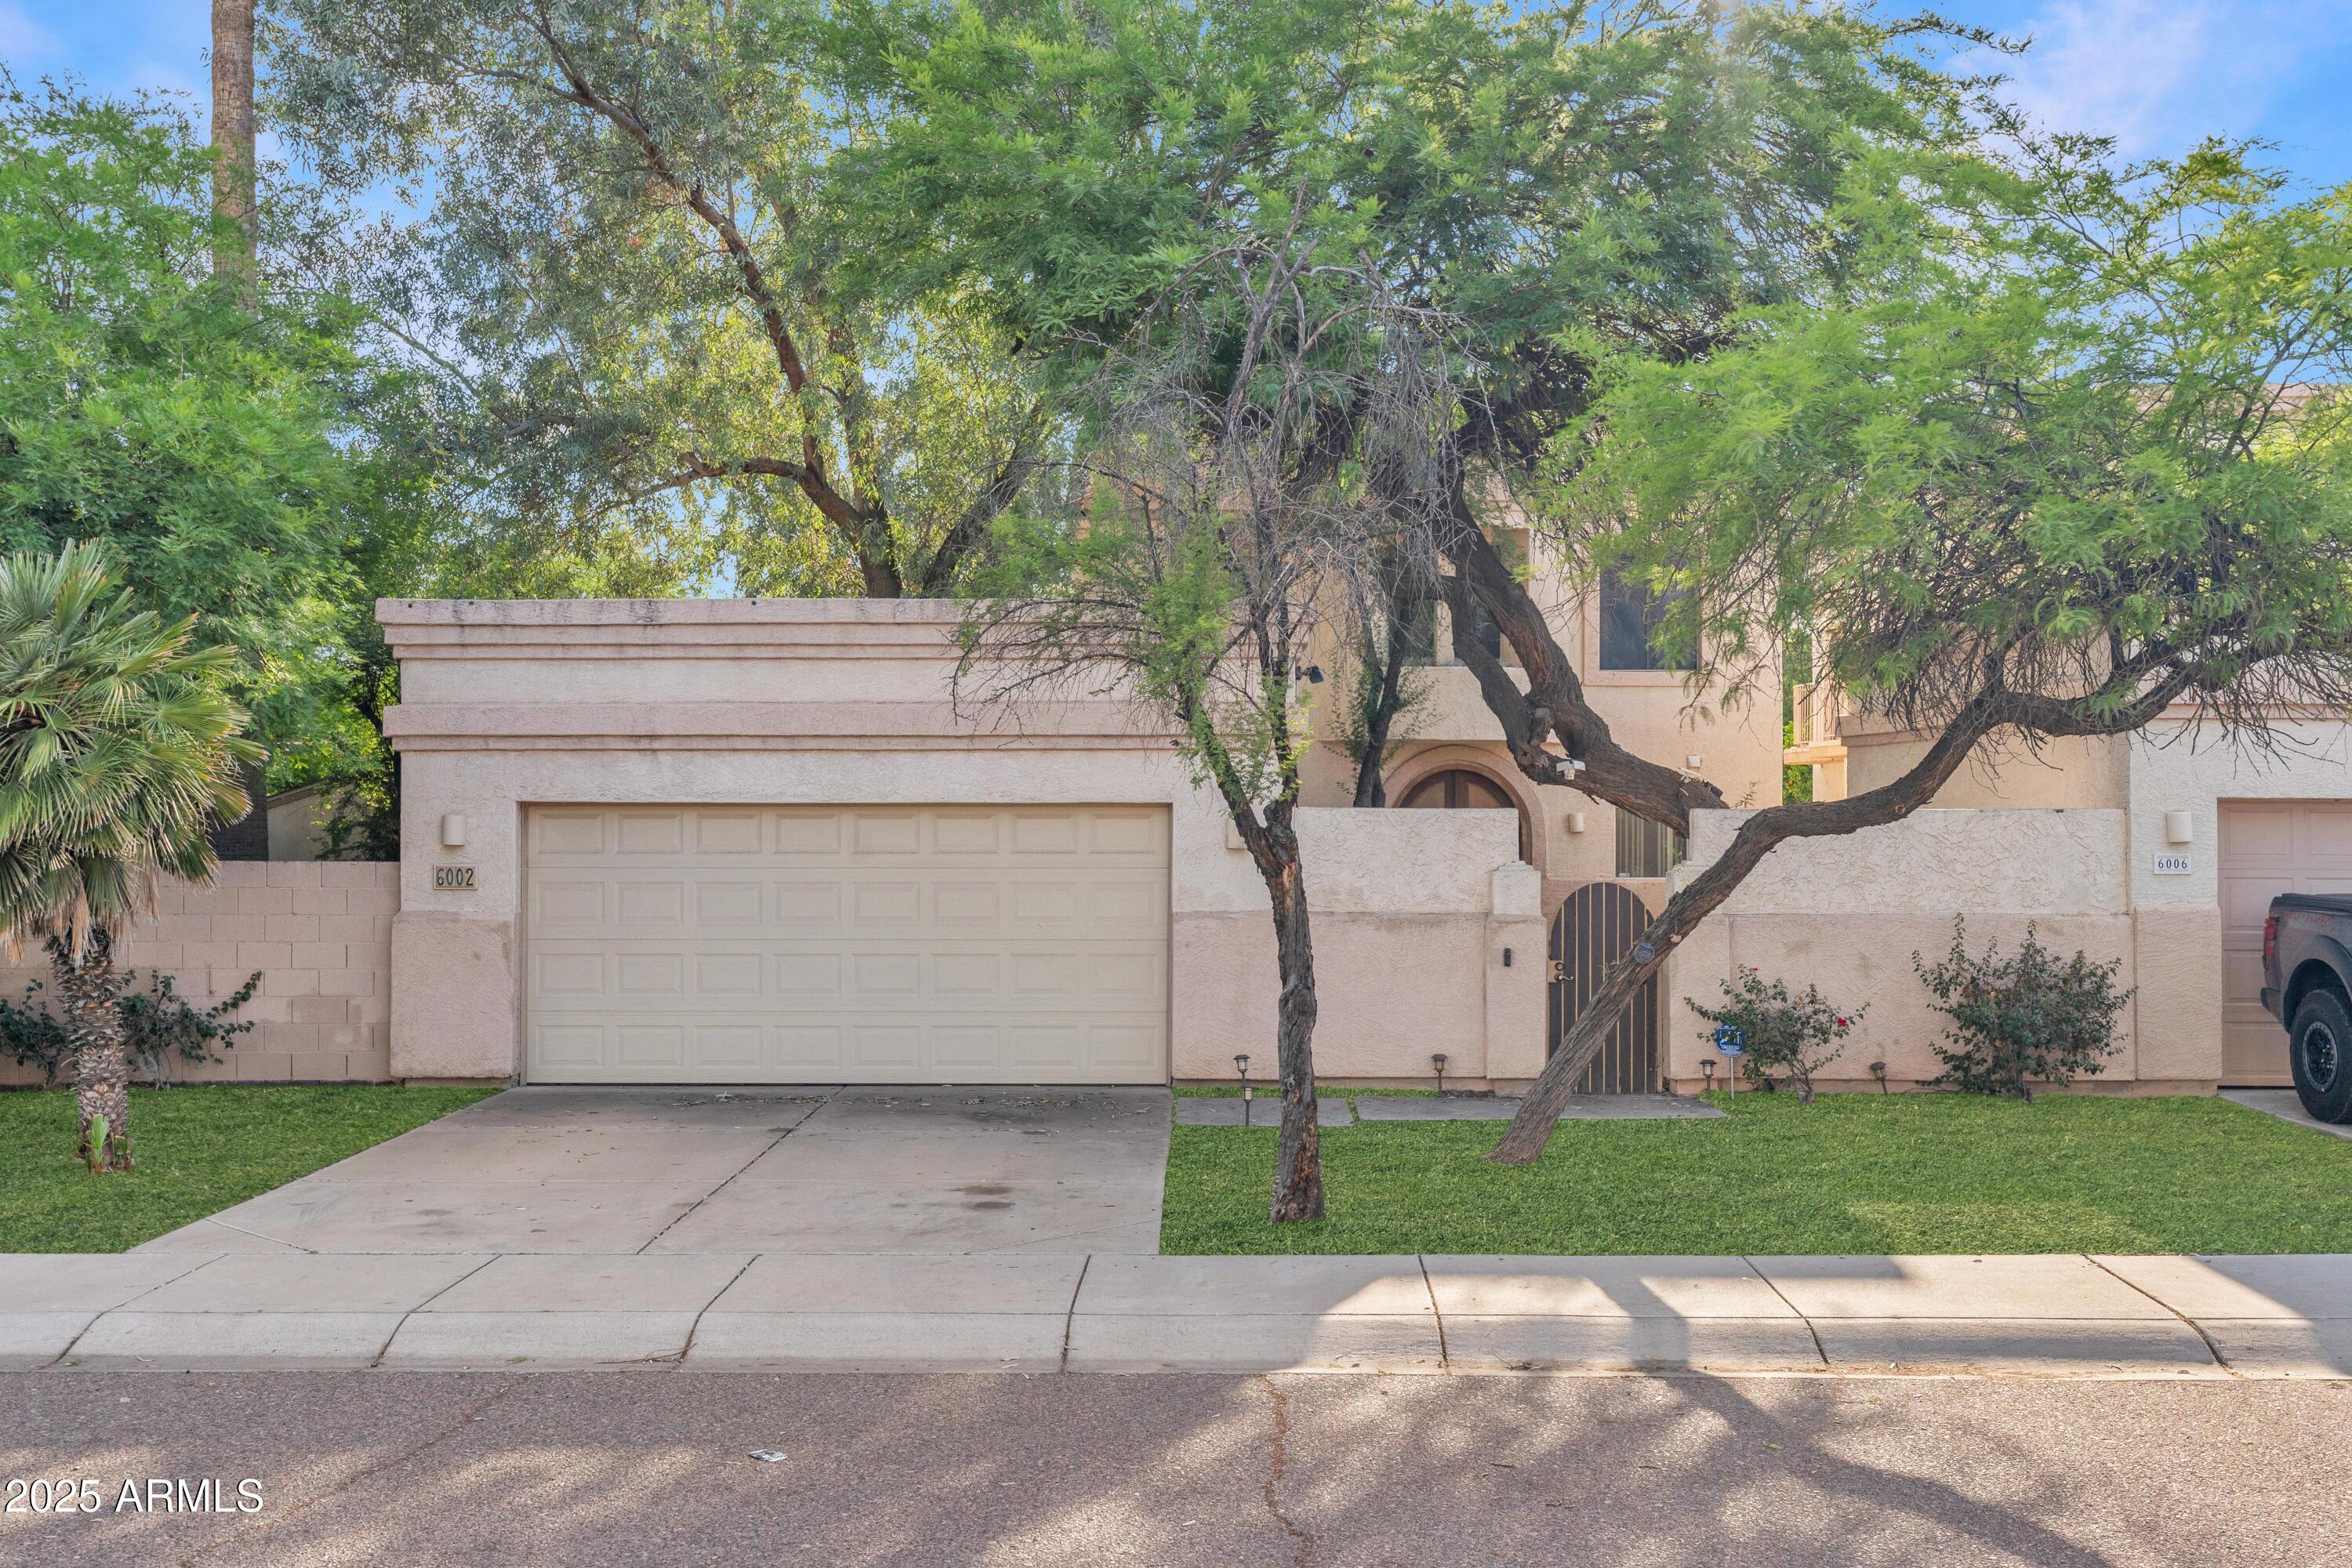
Active
$750,000
3
bds
|
3
ba
|
2,349
sqft
|
built
1999
6002 N 5th Pl, Phoenix, AZ 85012
$-1,688
Cash flow
-11.7%
Cash-on-Cash Return
3.0%
Cap rate
0.4%
Rent to Value Ratio

Active
$374,900
3
bds
|
1
ba
|
1,547
sqft
|
built
1943
1622 E Granada Rd, Phoenix, AZ 85006
$-368
Cash flow
-5.1%
Cash-on-Cash Return
4.5%
Cap rate
0.6%
Rent to Value Ratio

Active
$675,000
3
bds
|
3
ba
|
1,900
sqft
|
built
1997
9932 N 16th Pl E, Phoenix, AZ 85020
$-1,450
Cash flow
-11.2%
Cash-on-Cash Return
3.1%
Cap rate
0.4%
Rent to Value Ratio
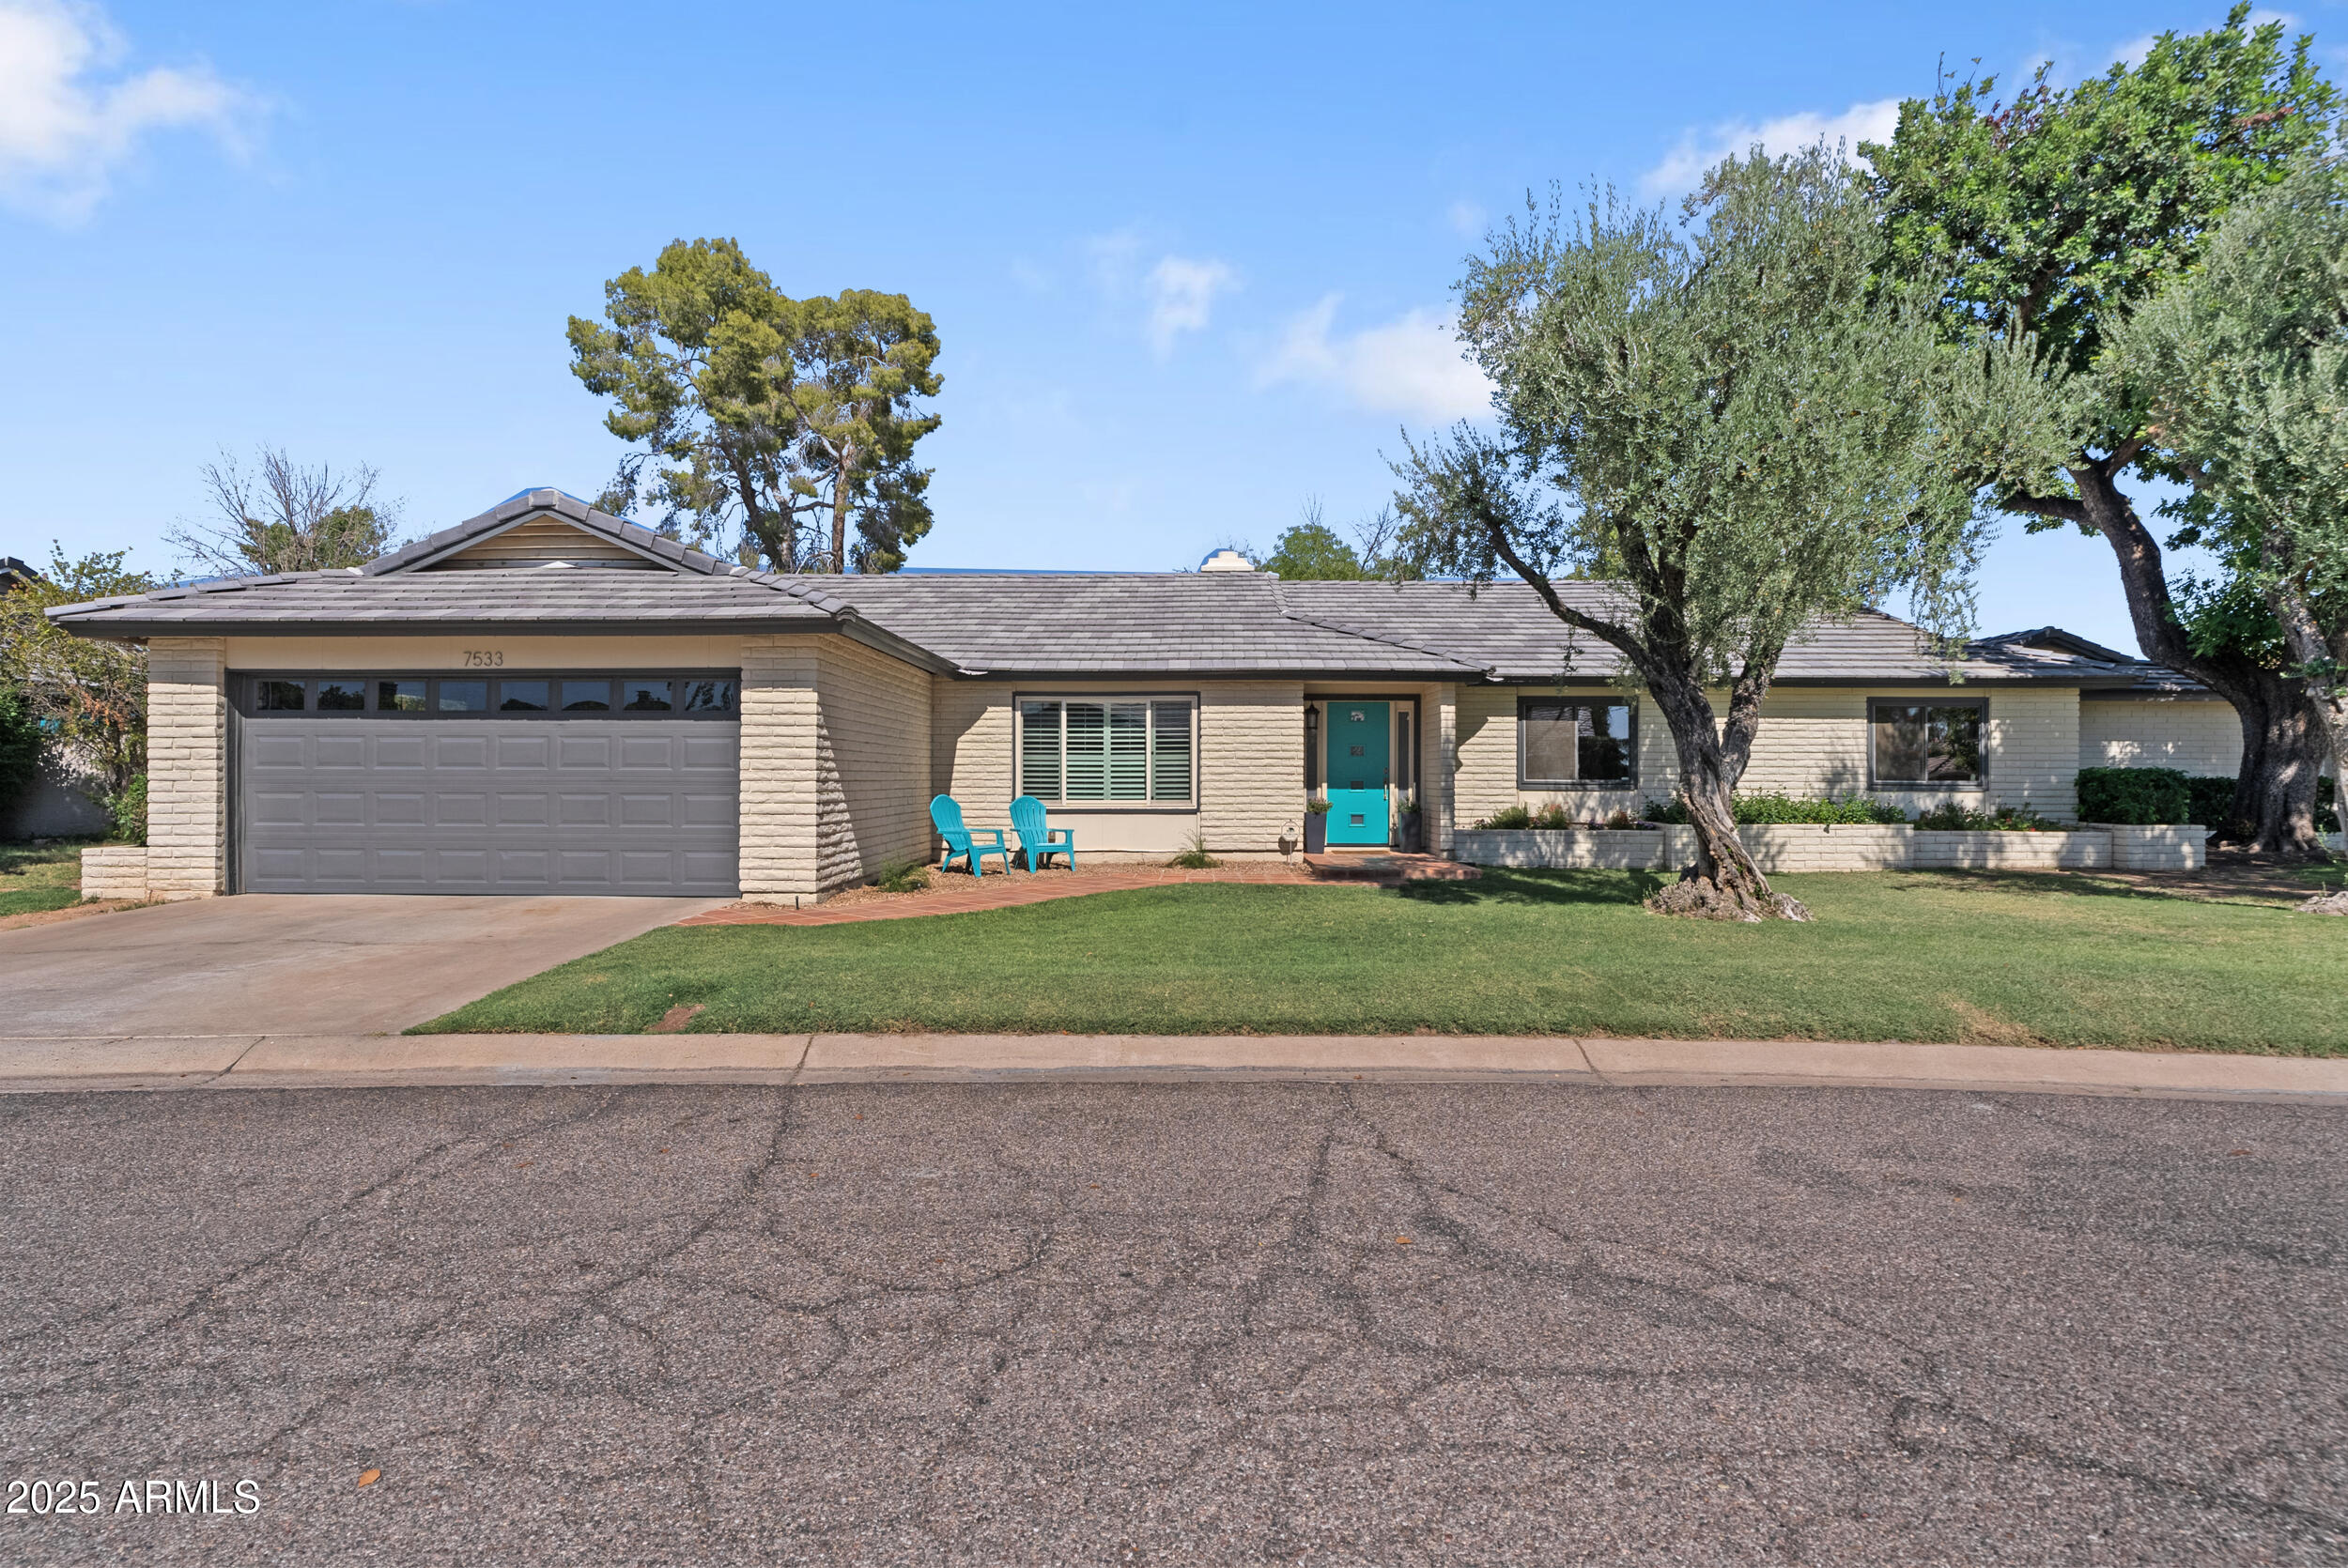
Active
$1,100,000
5
bds
|
3
ba
|
2,731
sqft
|
built
1973
7533 N 8th St, Phoenix, AZ 85020
$-3,060
Cash flow
-14.5%
Cash-on-Cash Return
2.3%
Cap rate
0.4%
Rent to Value Ratio
Active
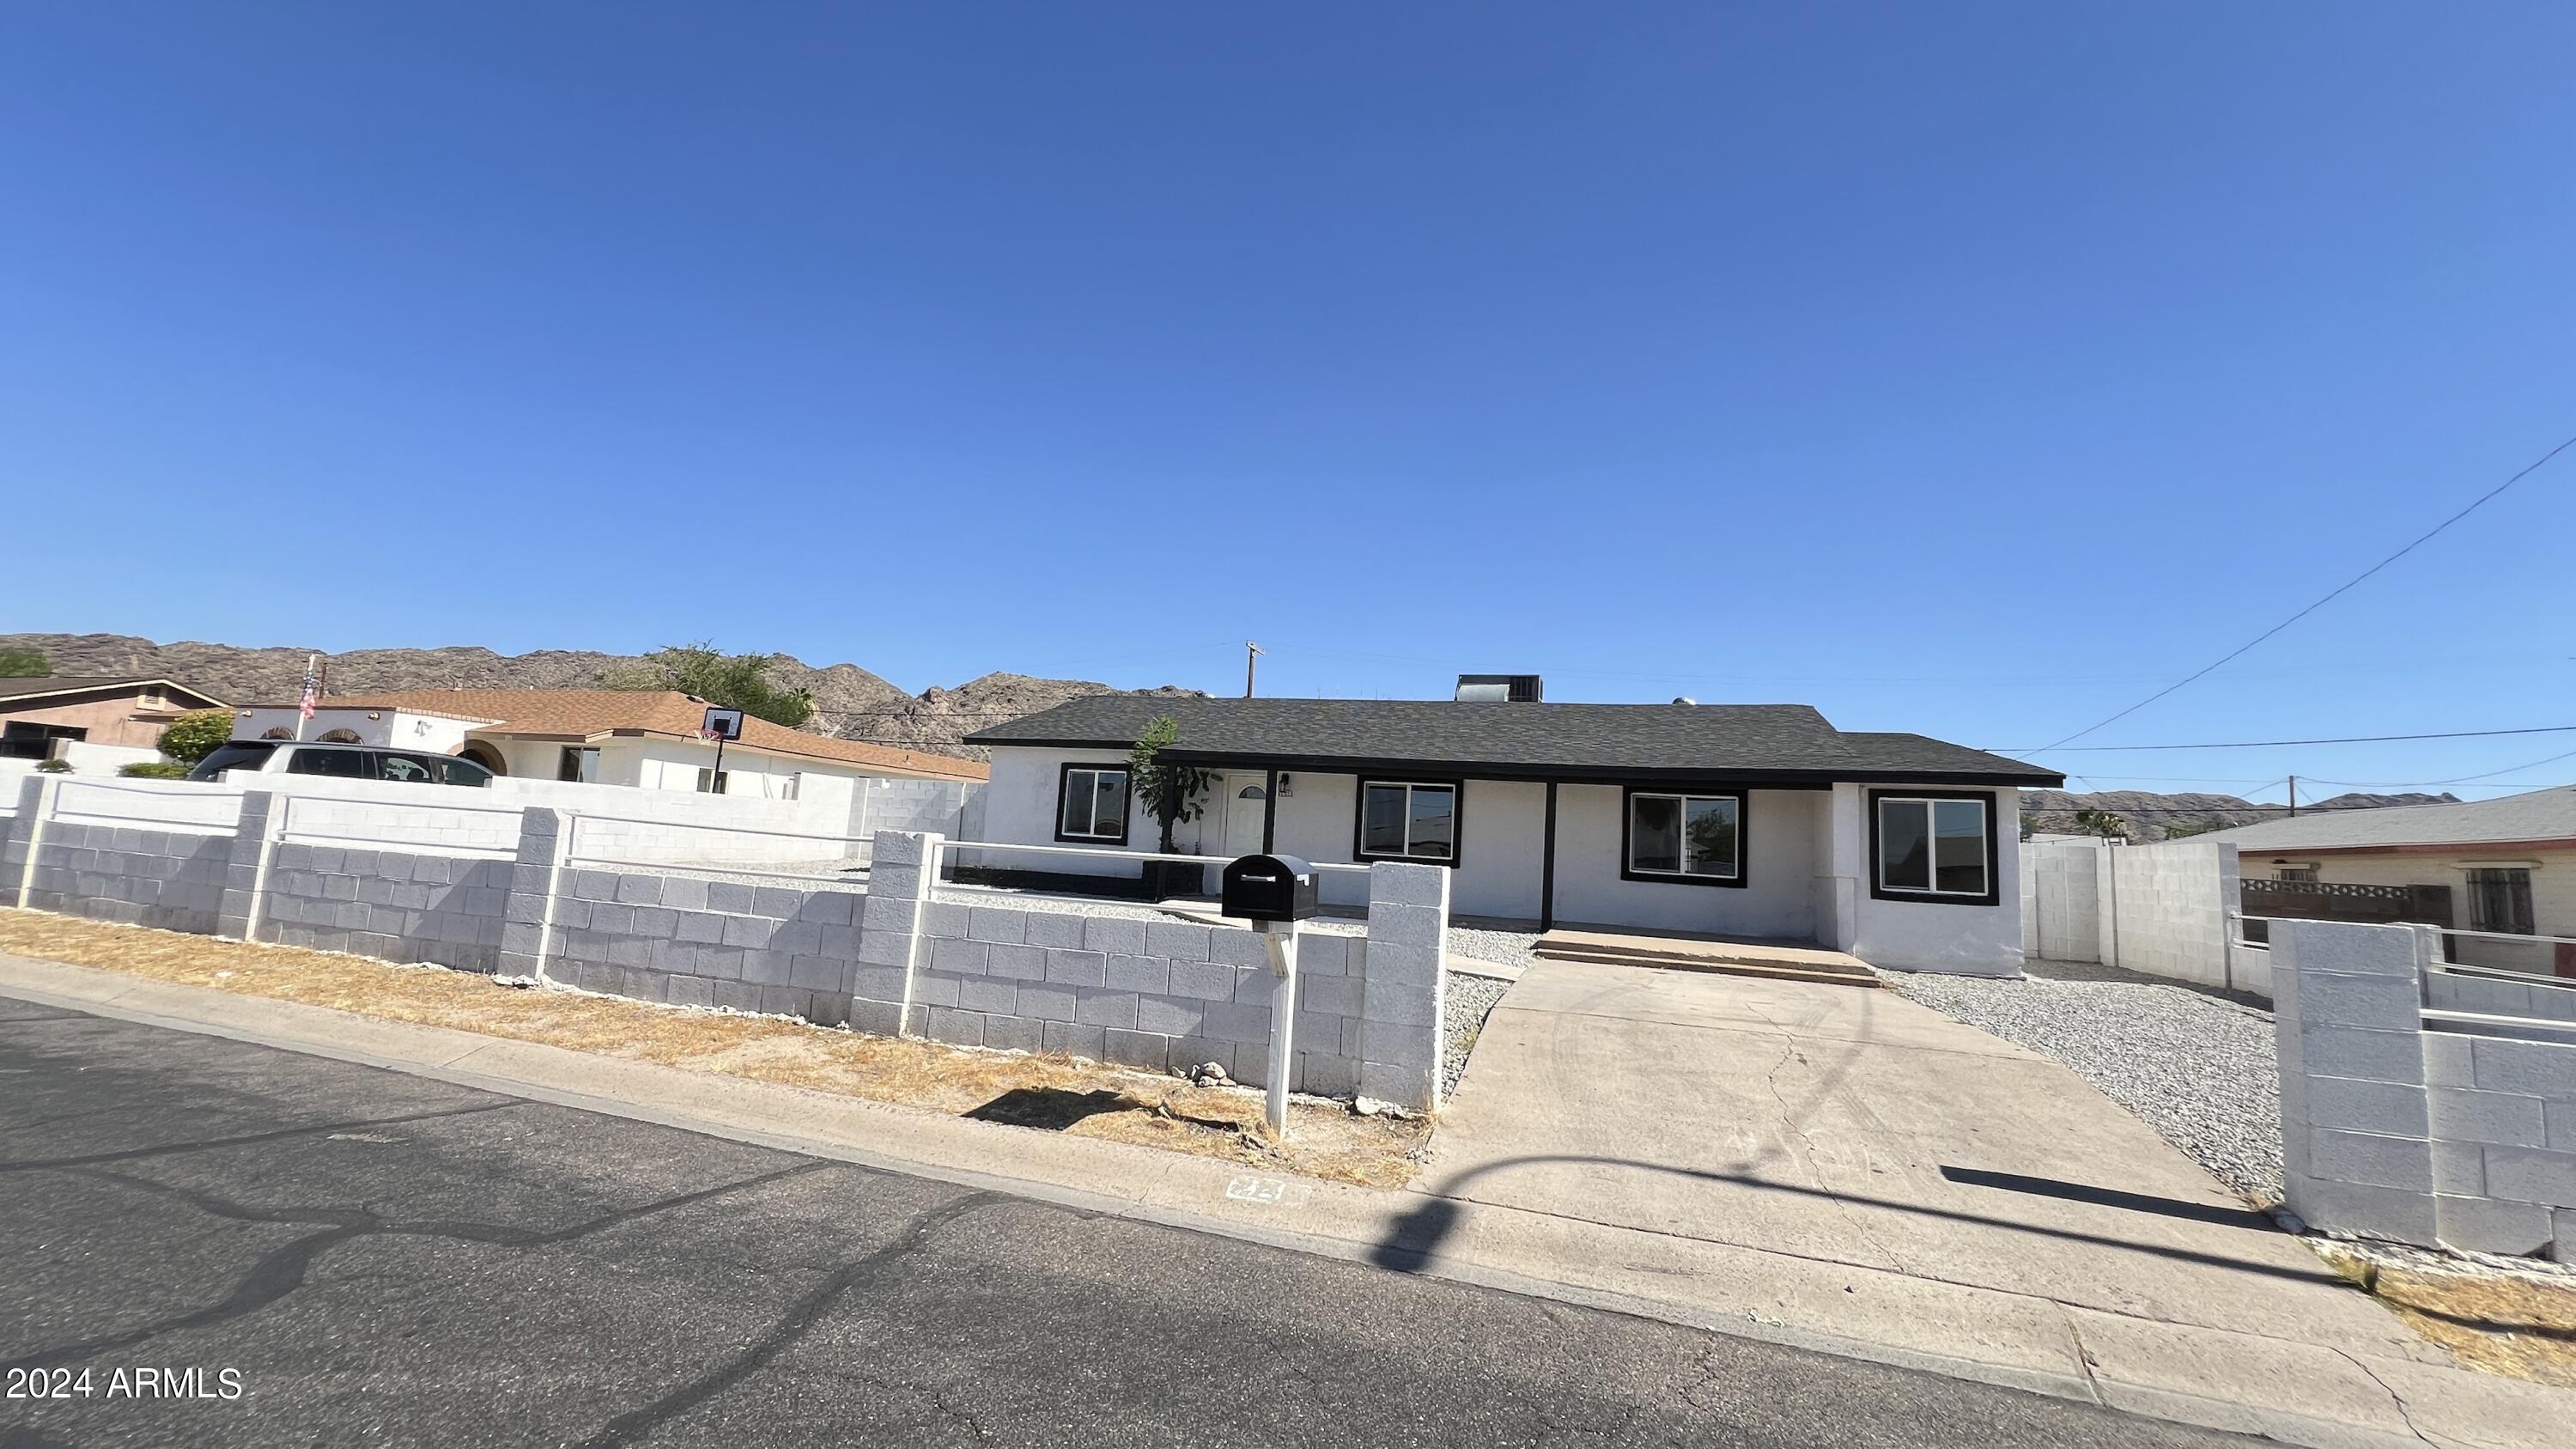
$220,000
3
bds
|
2
ba
|
1,088
sqft
|
built
1984
11666 N 28th Dr, Phoenix, AZ 85029
$-145
Cash flow
-3.4%
Cash-on-Cash Return
4.9%
Cap rate
0.8%
Rent to Value Ratio
Active
$340,000
1
bds
|
1
ba
|
850
sqft
|
built
1983
12222 N Paradise Village Pkwy S, Phoenix, AZ 85032
$-1,224
Cash flow
-18.8%
Cash-on-Cash Return
1.4%
Cap rate
0.4%
Rent to Value Ratio
Active
$205,000
2
bds
|
2
ba
|
1,016
sqft
|
built
1984
4416 E Riverside St, Phoenix, AZ 85040
$-321
Cash flow
-8.2%
Cash-on-Cash Return
3.8%
Cap rate
0.7%
Rent to Value Ratio
Active
$949,000
3
bds
|
3
ba
|
1,961
sqft
|
built
1962
2802 E Mercer Ln, Phoenix, AZ 85028
$-2,570
Cash flow
-14.1%
Cash-on-Cash Return
2.4%
Cap rate
0.3%
Rent to Value Ratio
Active
$349,000
3
bds
|
2
ba
|
1,416
sqft
|
built
1959
3644 W Maryland Ave, Phoenix, AZ 85019
$-431
Cash flow
-6.4%
Cash-on-Cash Return
4.2%
Cap rate
0.5%
Rent to Value Ratio
Active
$1,999,000
6
bds
|
5
ba
|
4,971
sqft
|
built
2000
402 E Windmere Dr, Phoenix, AZ 85048
$-4,657
Cash flow
-12.2%
Cash-on-Cash Return
2.9%
Cap rate
0.4%
Rent to Value Ratio
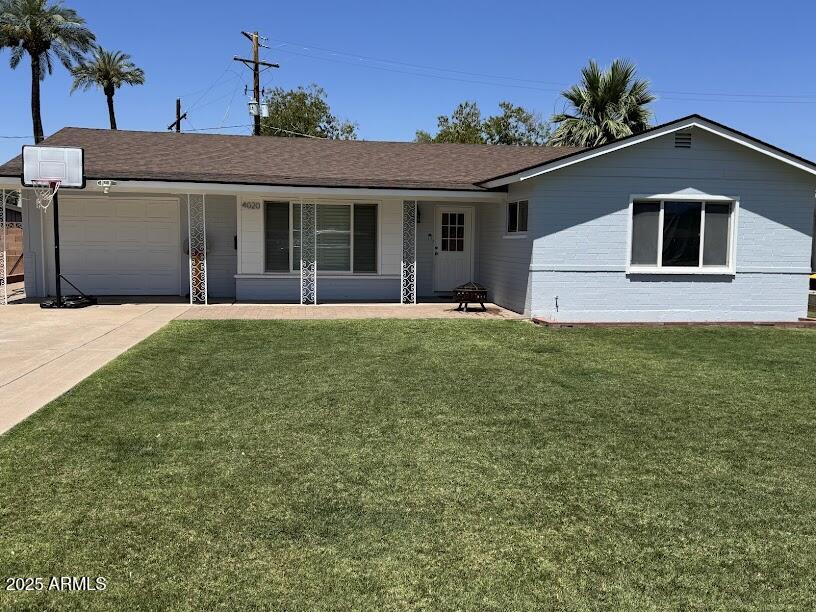
Active
$900,000
3
bds
|
2
ba
|
1,717
sqft
|
built
1955
4020 N 44th Pl, Phoenix, AZ 85018
$-1,961
Cash flow
-11.4%
Cash-on-Cash Return
3.1%
Cap rate
0.4%
Rent to Value Ratio

Active
$595,000
3
bds
|
2
ba
|
1,782
sqft
|
built
1977
842 E Village Circle Dr N, Phoenix, AZ 85022
$-1,375
Cash flow
-12.1%
Cash-on-Cash Return
2.9%
Cap rate
0.4%
Rent to Value Ratio

Active
$1,100,000
4
bds
|
3
ba
|
3,034
sqft
|
built
1994
3102 E Desert Broom Way, Phoenix, AZ 85048
$-3,189
Cash flow
-15.1%
Cash-on-Cash Return
2.2%
Cap rate
0.3%
Rent to Value Ratio
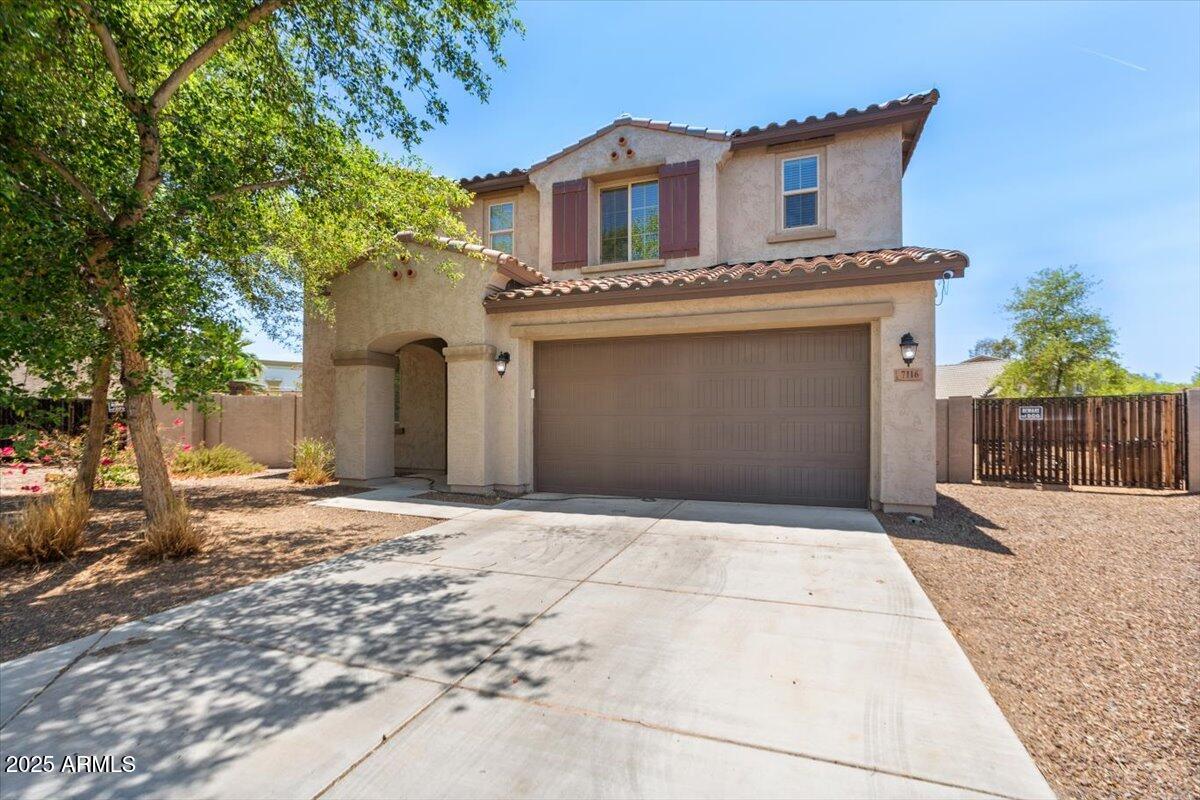
Active
$480,000
4
bds
|
3
ba
|
2,666
sqft
|
built
2015
7116 S 19th Ln, Phoenix, AZ 85041
$-873
Cash flow
-9.5%
Cash-on-Cash Return
3.5%
Cap rate
0.5%
Rent to Value Ratio
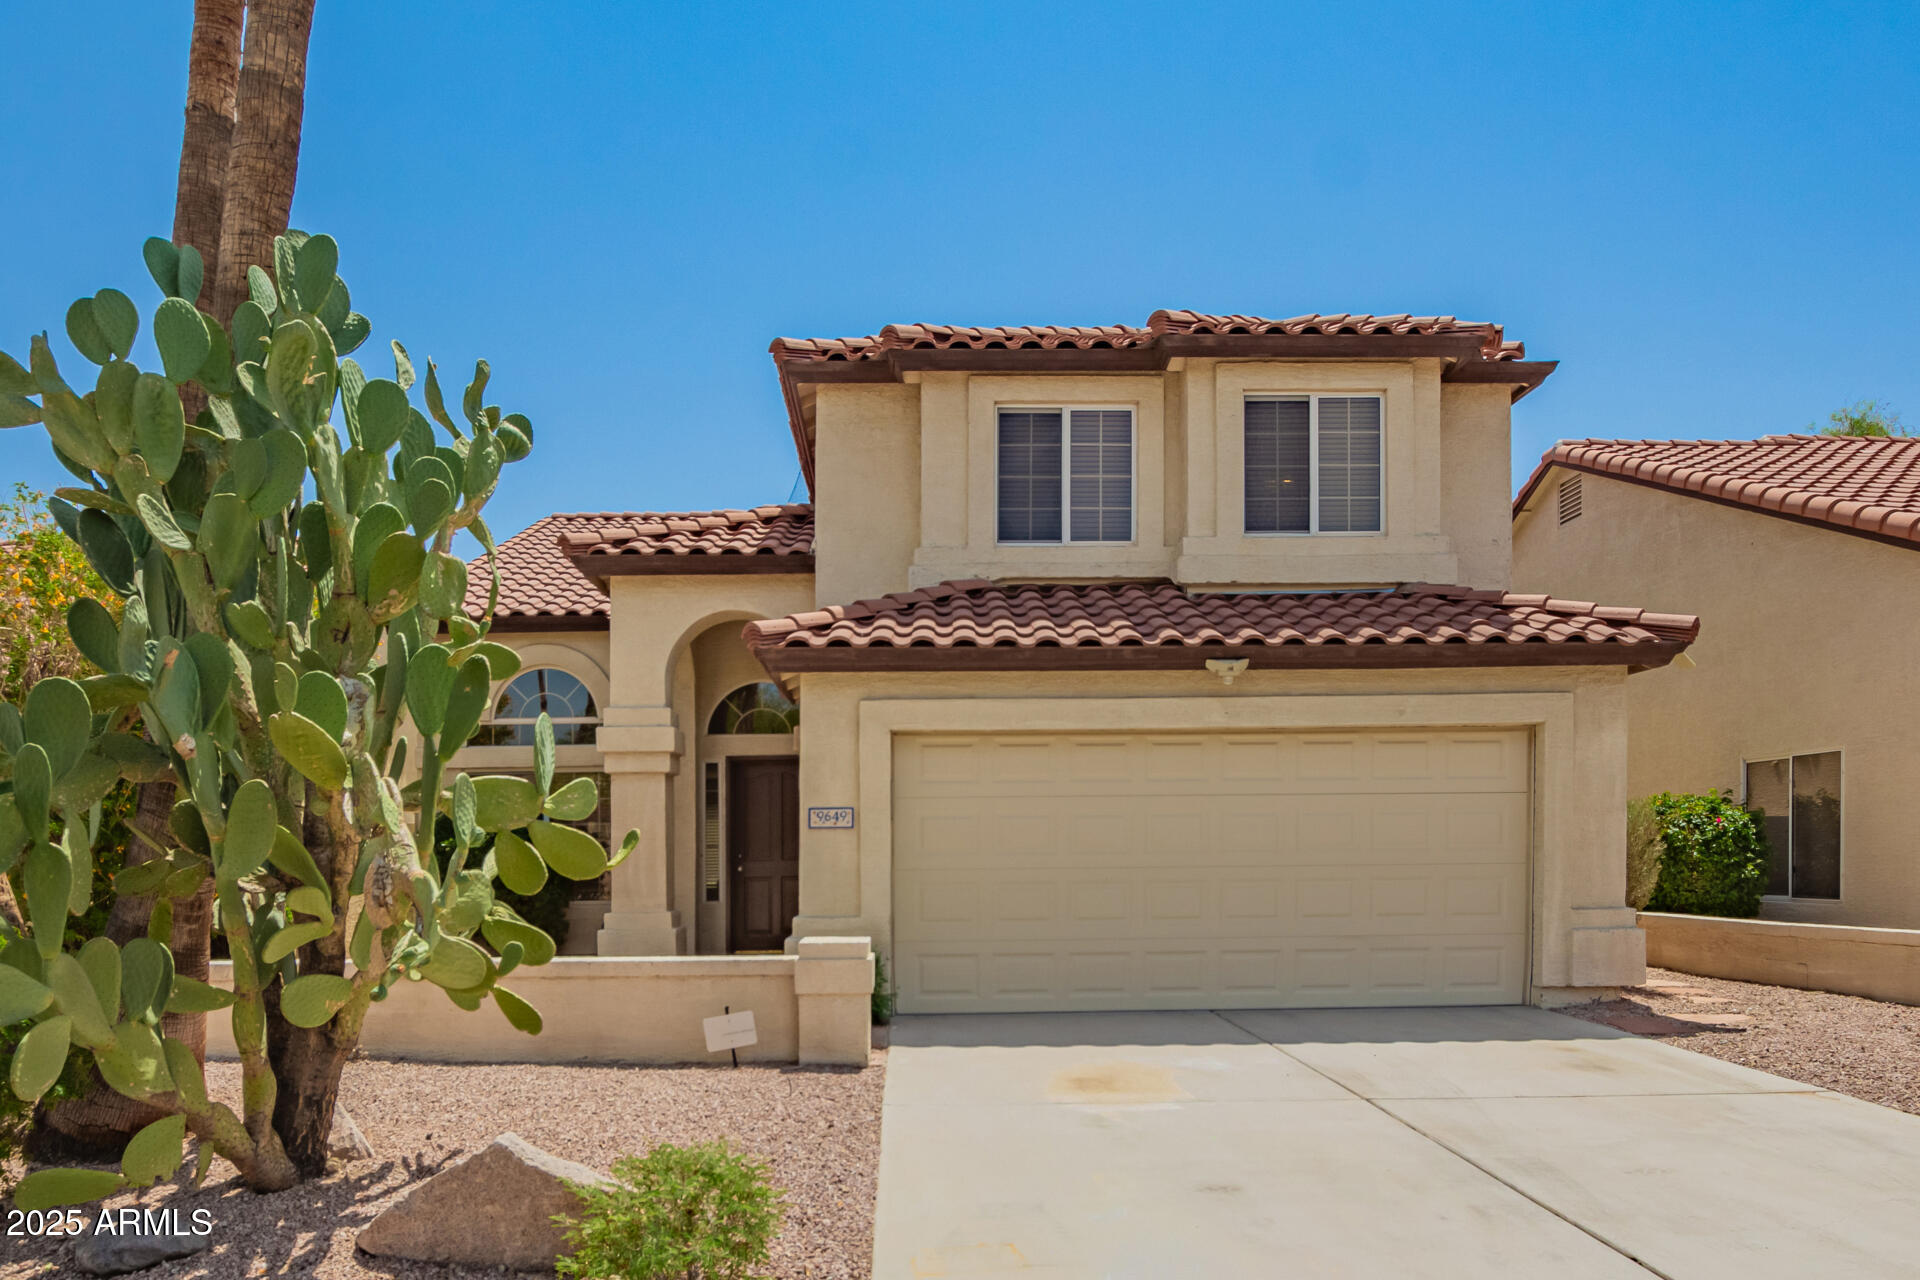
Active
$635,000
3
bds
|
3
ba
|
2,056
sqft
|
built
1992
9649 S 51st St, Phoenix, AZ 85044
$-1,746
Cash flow
-14.3%
Cash-on-Cash Return
2.4%
Cap rate
0.4%
Rent to Value Ratio
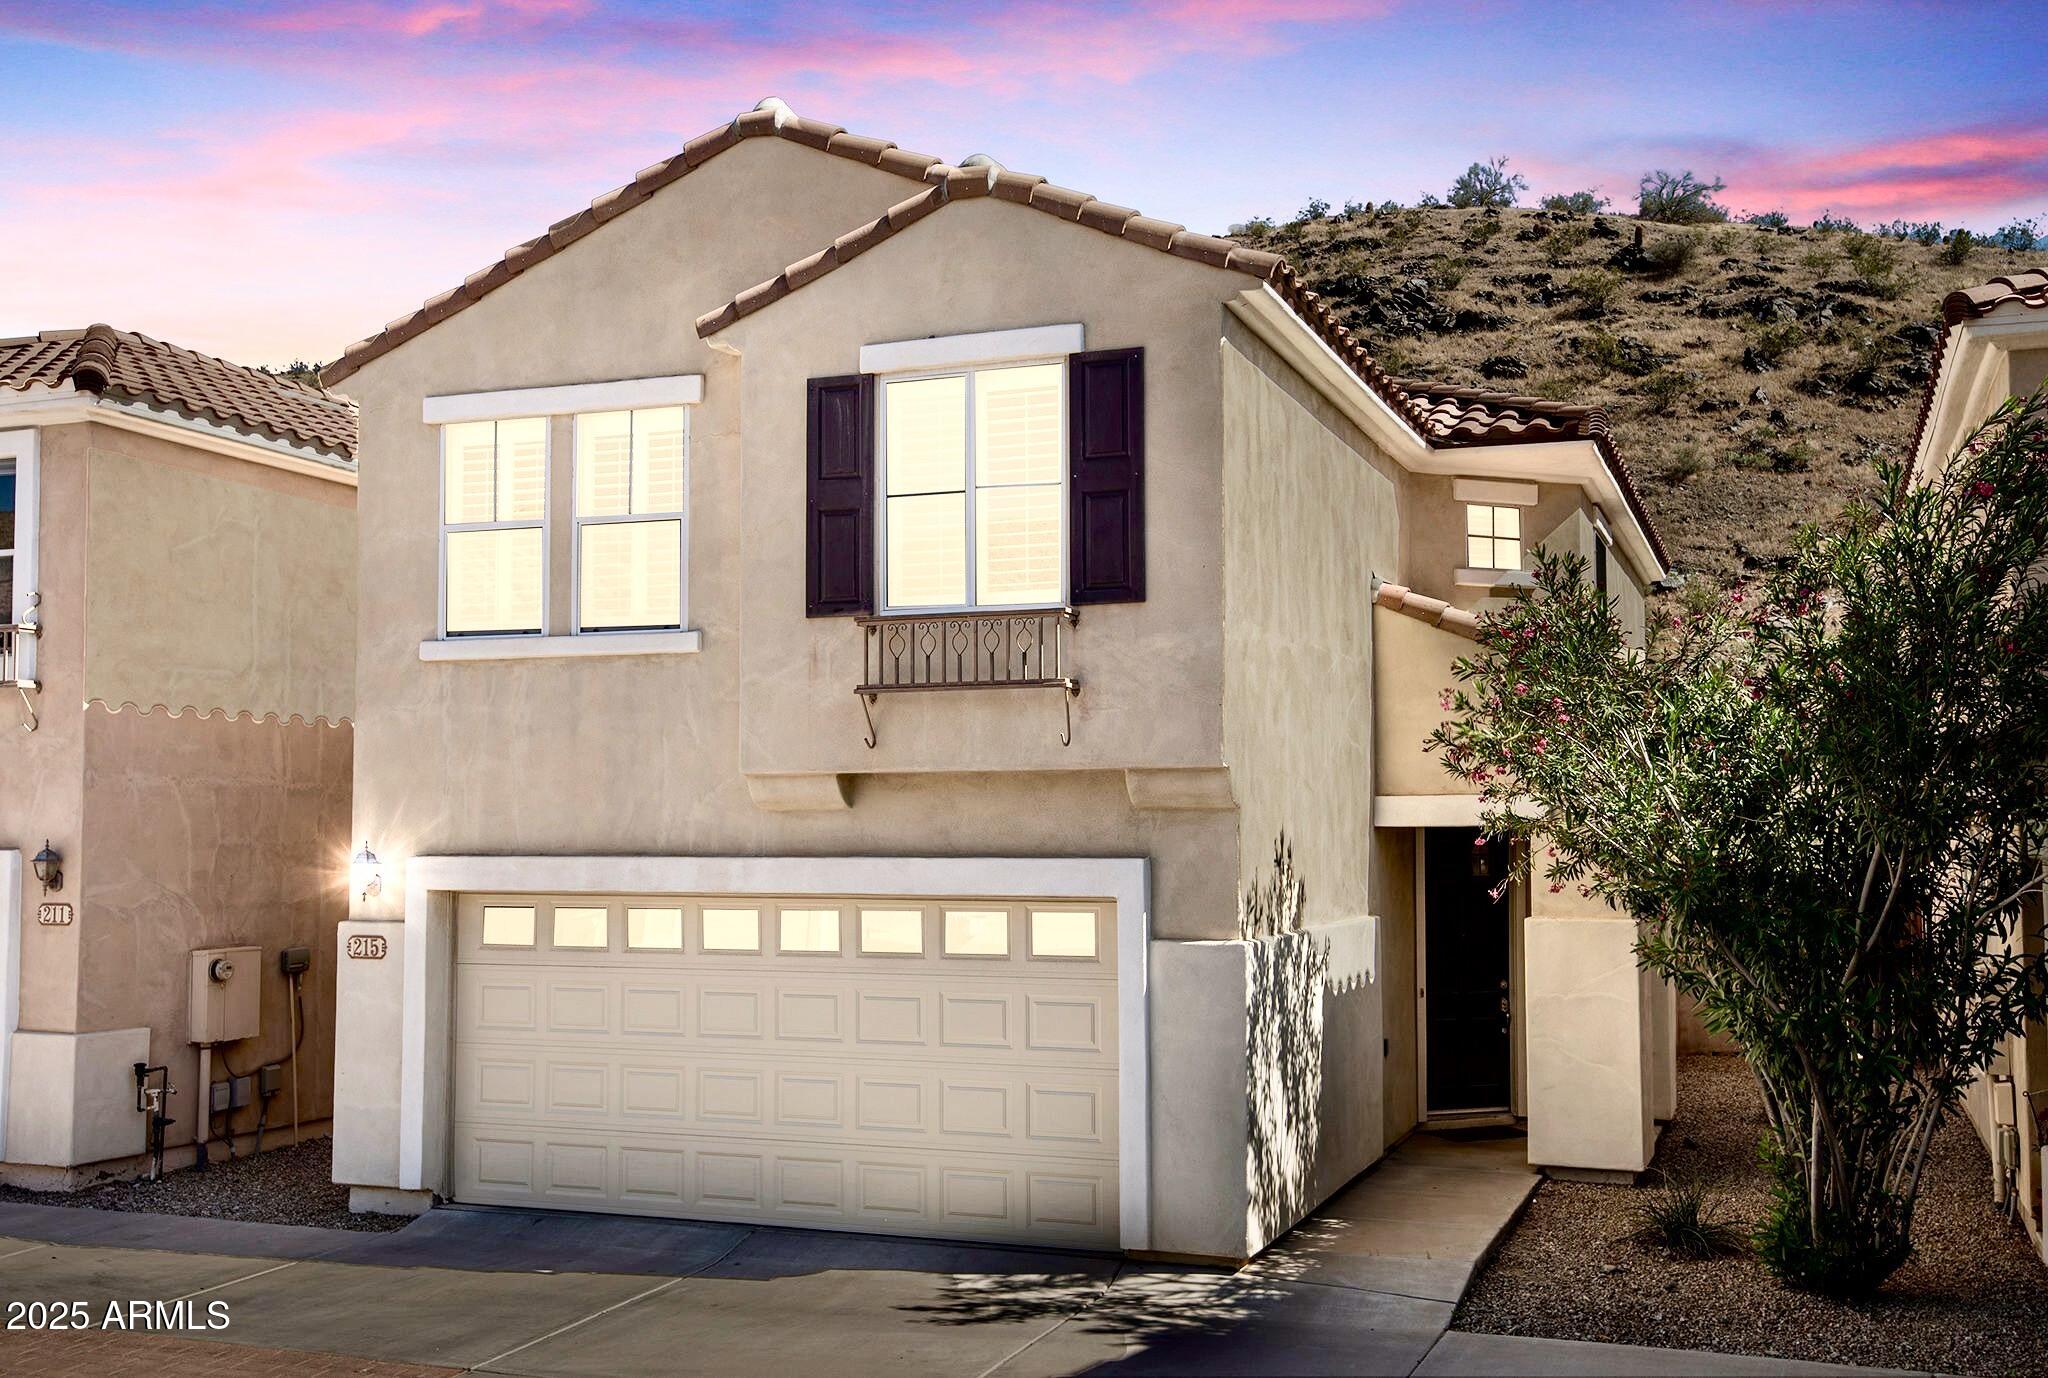
Active
$460,000
3
bds
|
3
ba
|
1,603
sqft
|
built
1999
215 W Mountain Sage Dr, Phoenix, AZ 85045
$-695
Cash flow
-7.9%
Cash-on-Cash Return
3.9%
Cap rate
0.5%
Rent to Value Ratio

Active
$649,900
4
bds
|
2
ba
|
1,729
sqft
|
built
1950
6808 N 11th St, Phoenix, AZ 85014
$-930
Cash flow
-7.5%
Cash-on-Cash Return
4.0%
Cap rate
0.5%
Rent to Value Ratio

Active
$550,000
2
bds
|
2
ba
|
1,360
sqft
|
built
1971
6629 N Majorca Way E, Phoenix, AZ 85016
$-1,403
Cash flow
-13.3%
Cash-on-Cash Return
2.6%
Cap rate
0.4%
Rent to Value Ratio
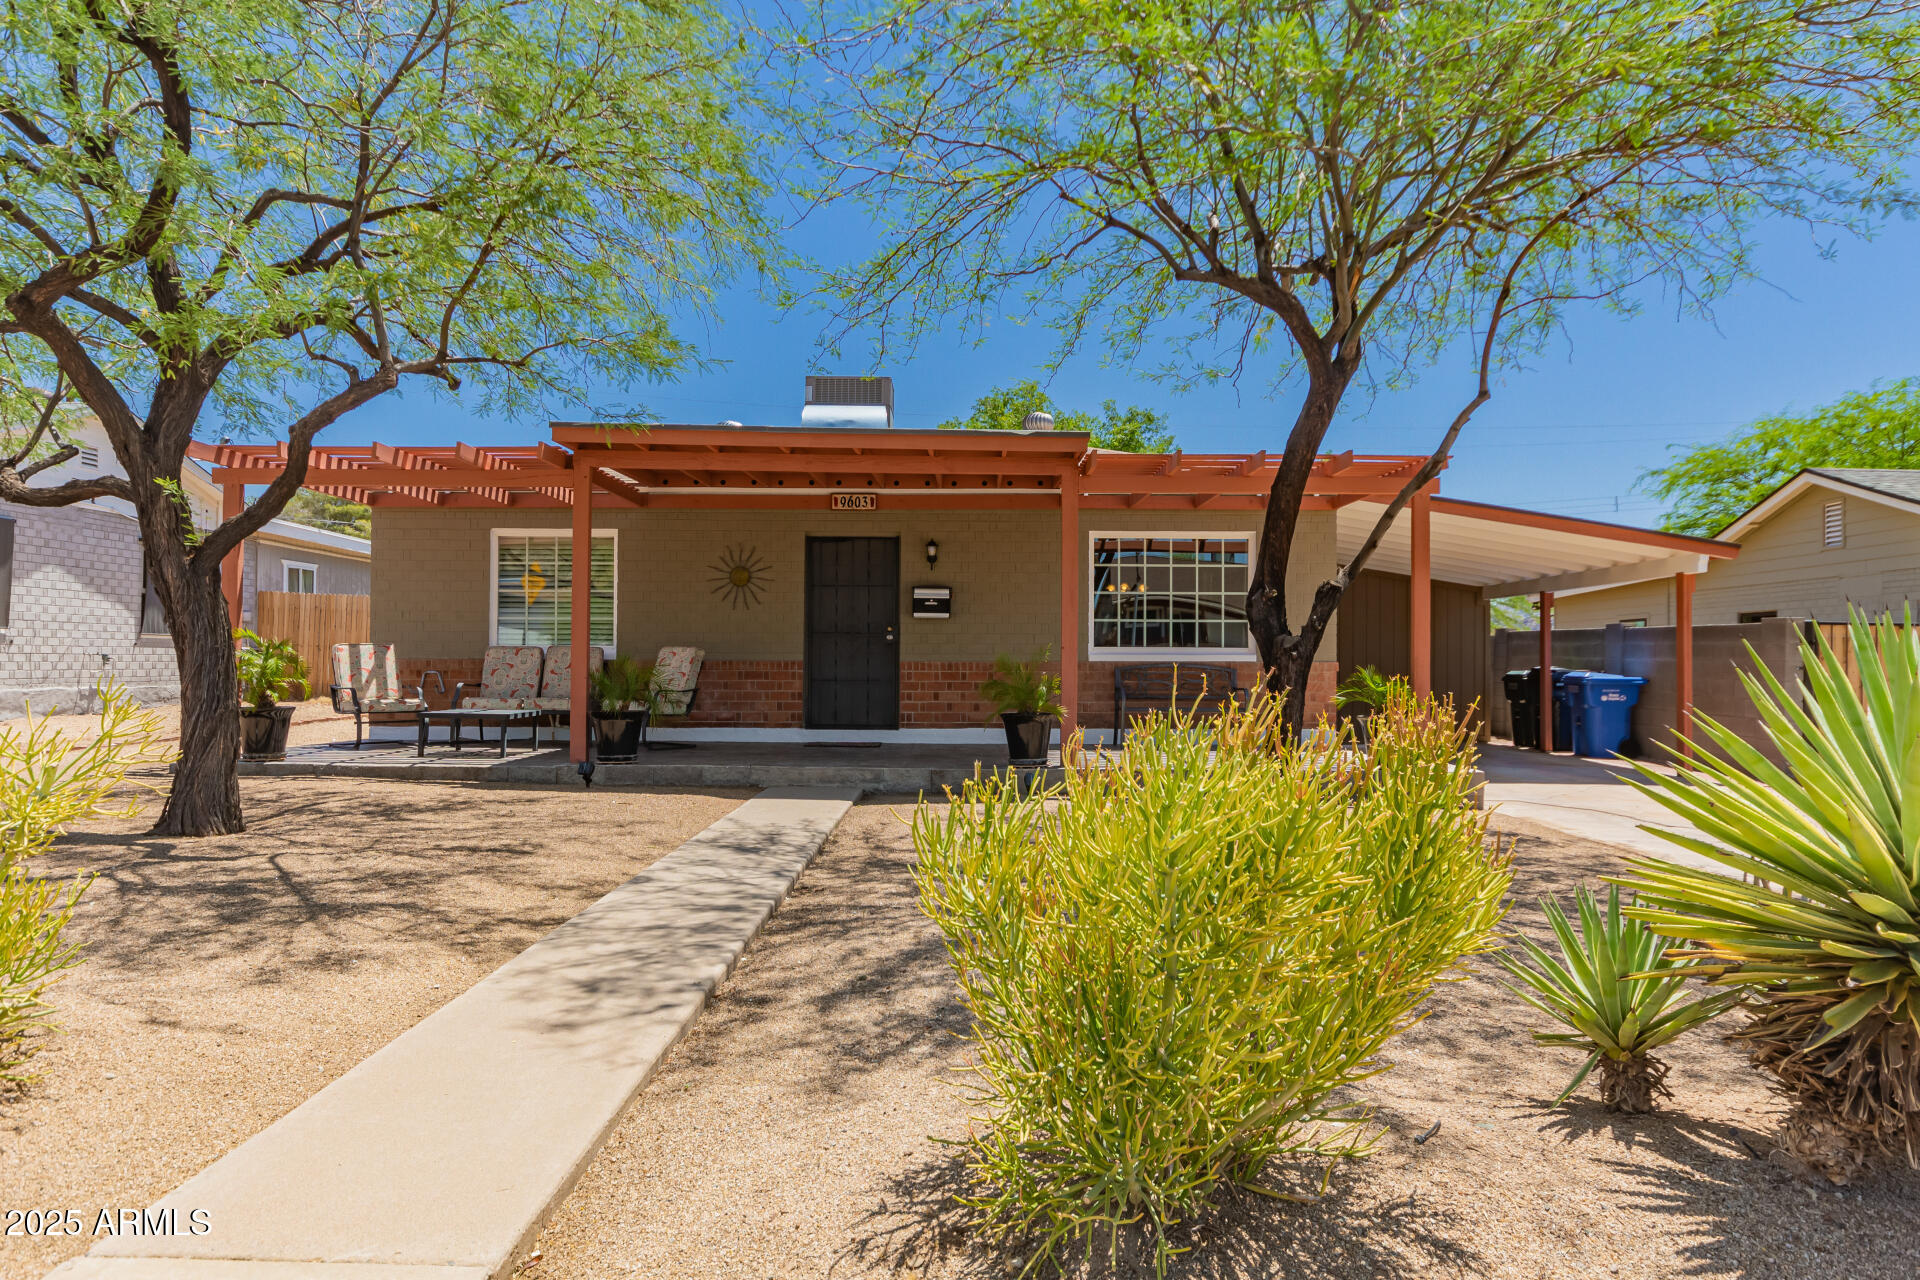
Active
$389,000
2
bds
|
2
ba
|
1,123
sqft
|
built
1947
9603 N 1st Ave, Phoenix, AZ 85021
$-661
Cash flow
-8.9%
Cash-on-Cash Return
3.6%
Cap rate
0.5%
Rent to Value Ratio
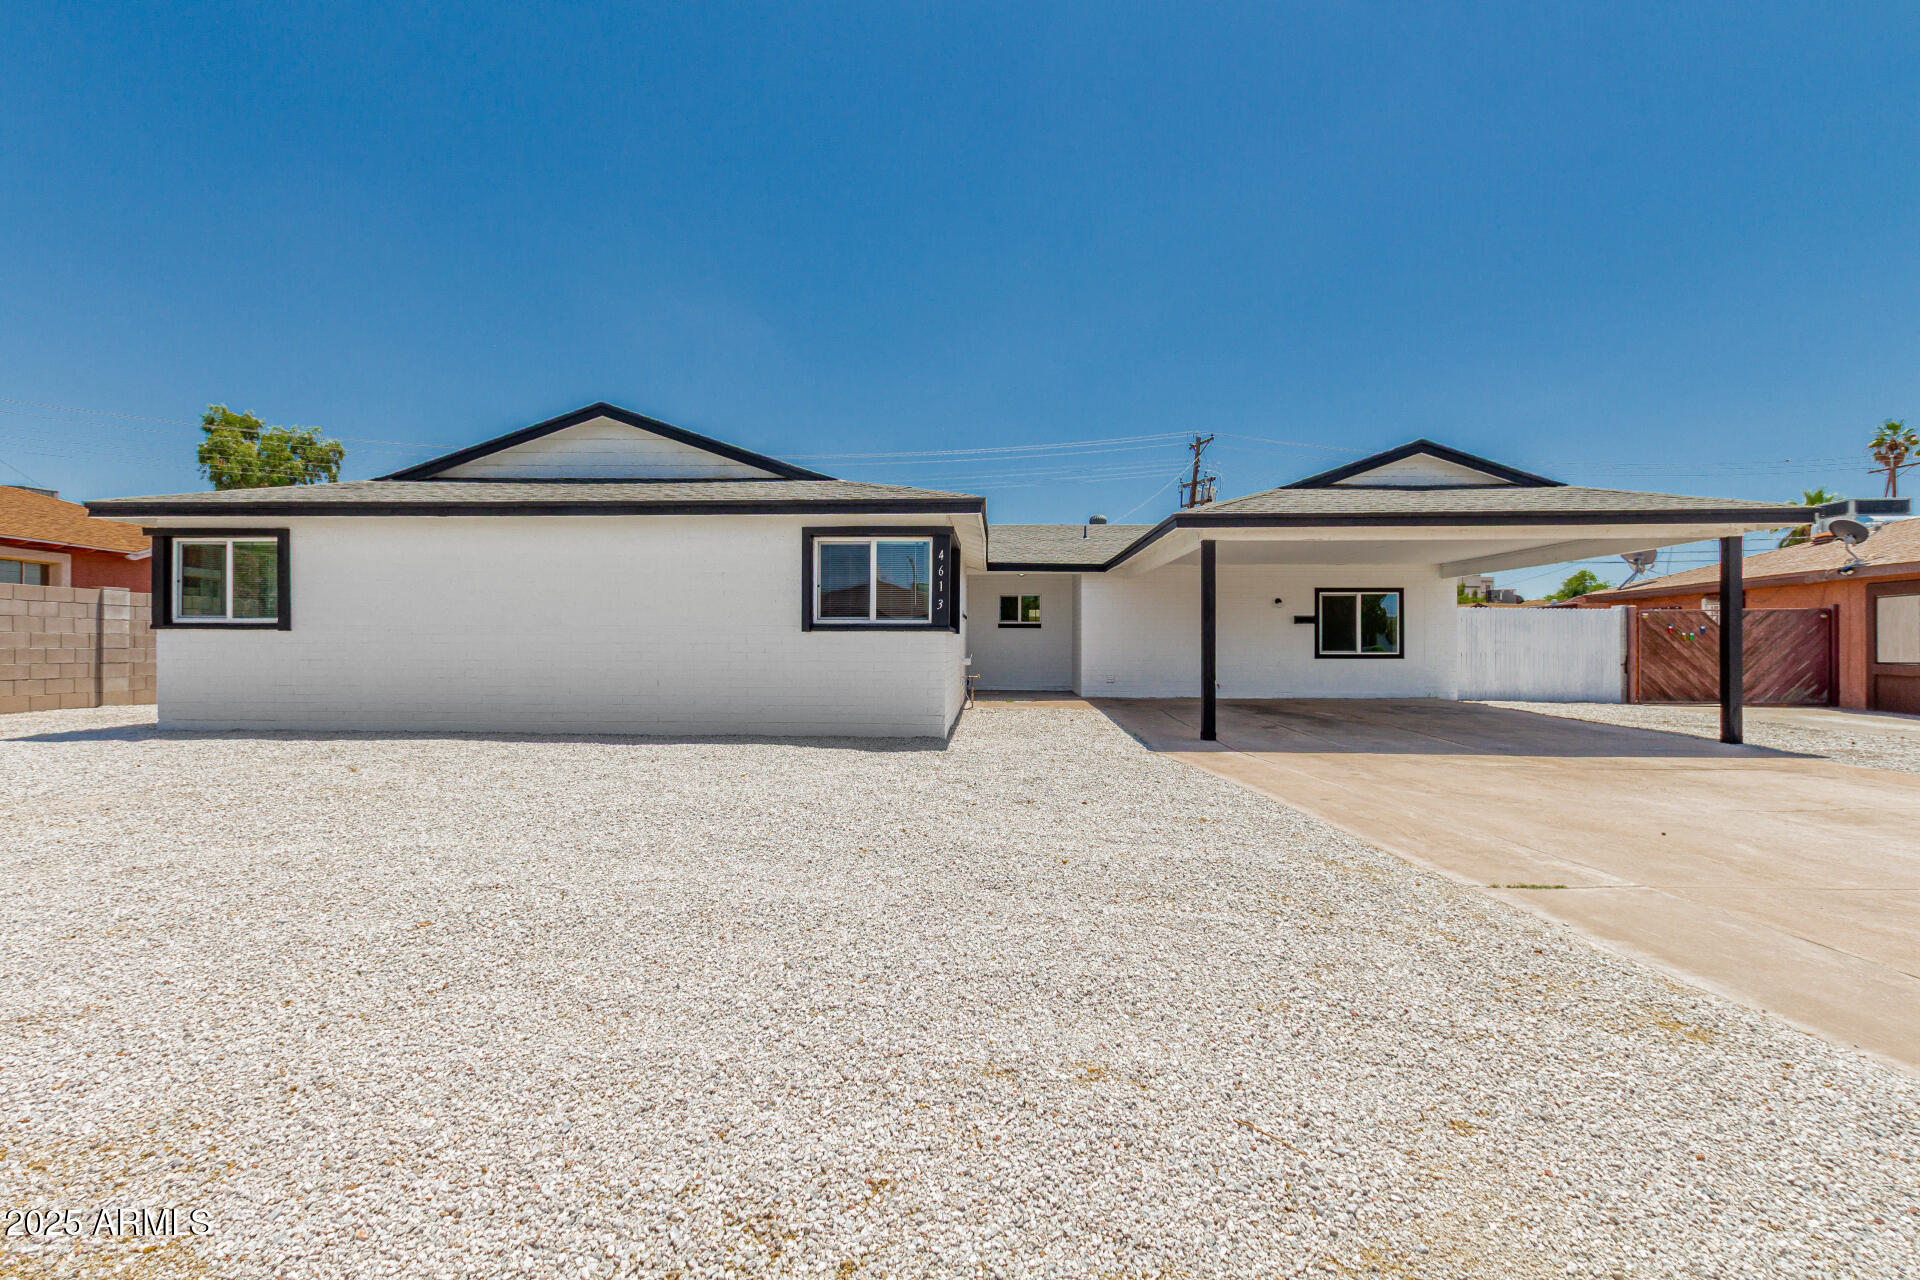
Active
$459,900
5
bds
|
2
ba
|
2,350
sqft
|
built
1957
4613 N 53rd Dr, Phoenix, AZ 85031
$-895
Cash flow
-10.2%
Cash-on-Cash Return
3.3%
Cap rate
0.4%
Rent to Value Ratio
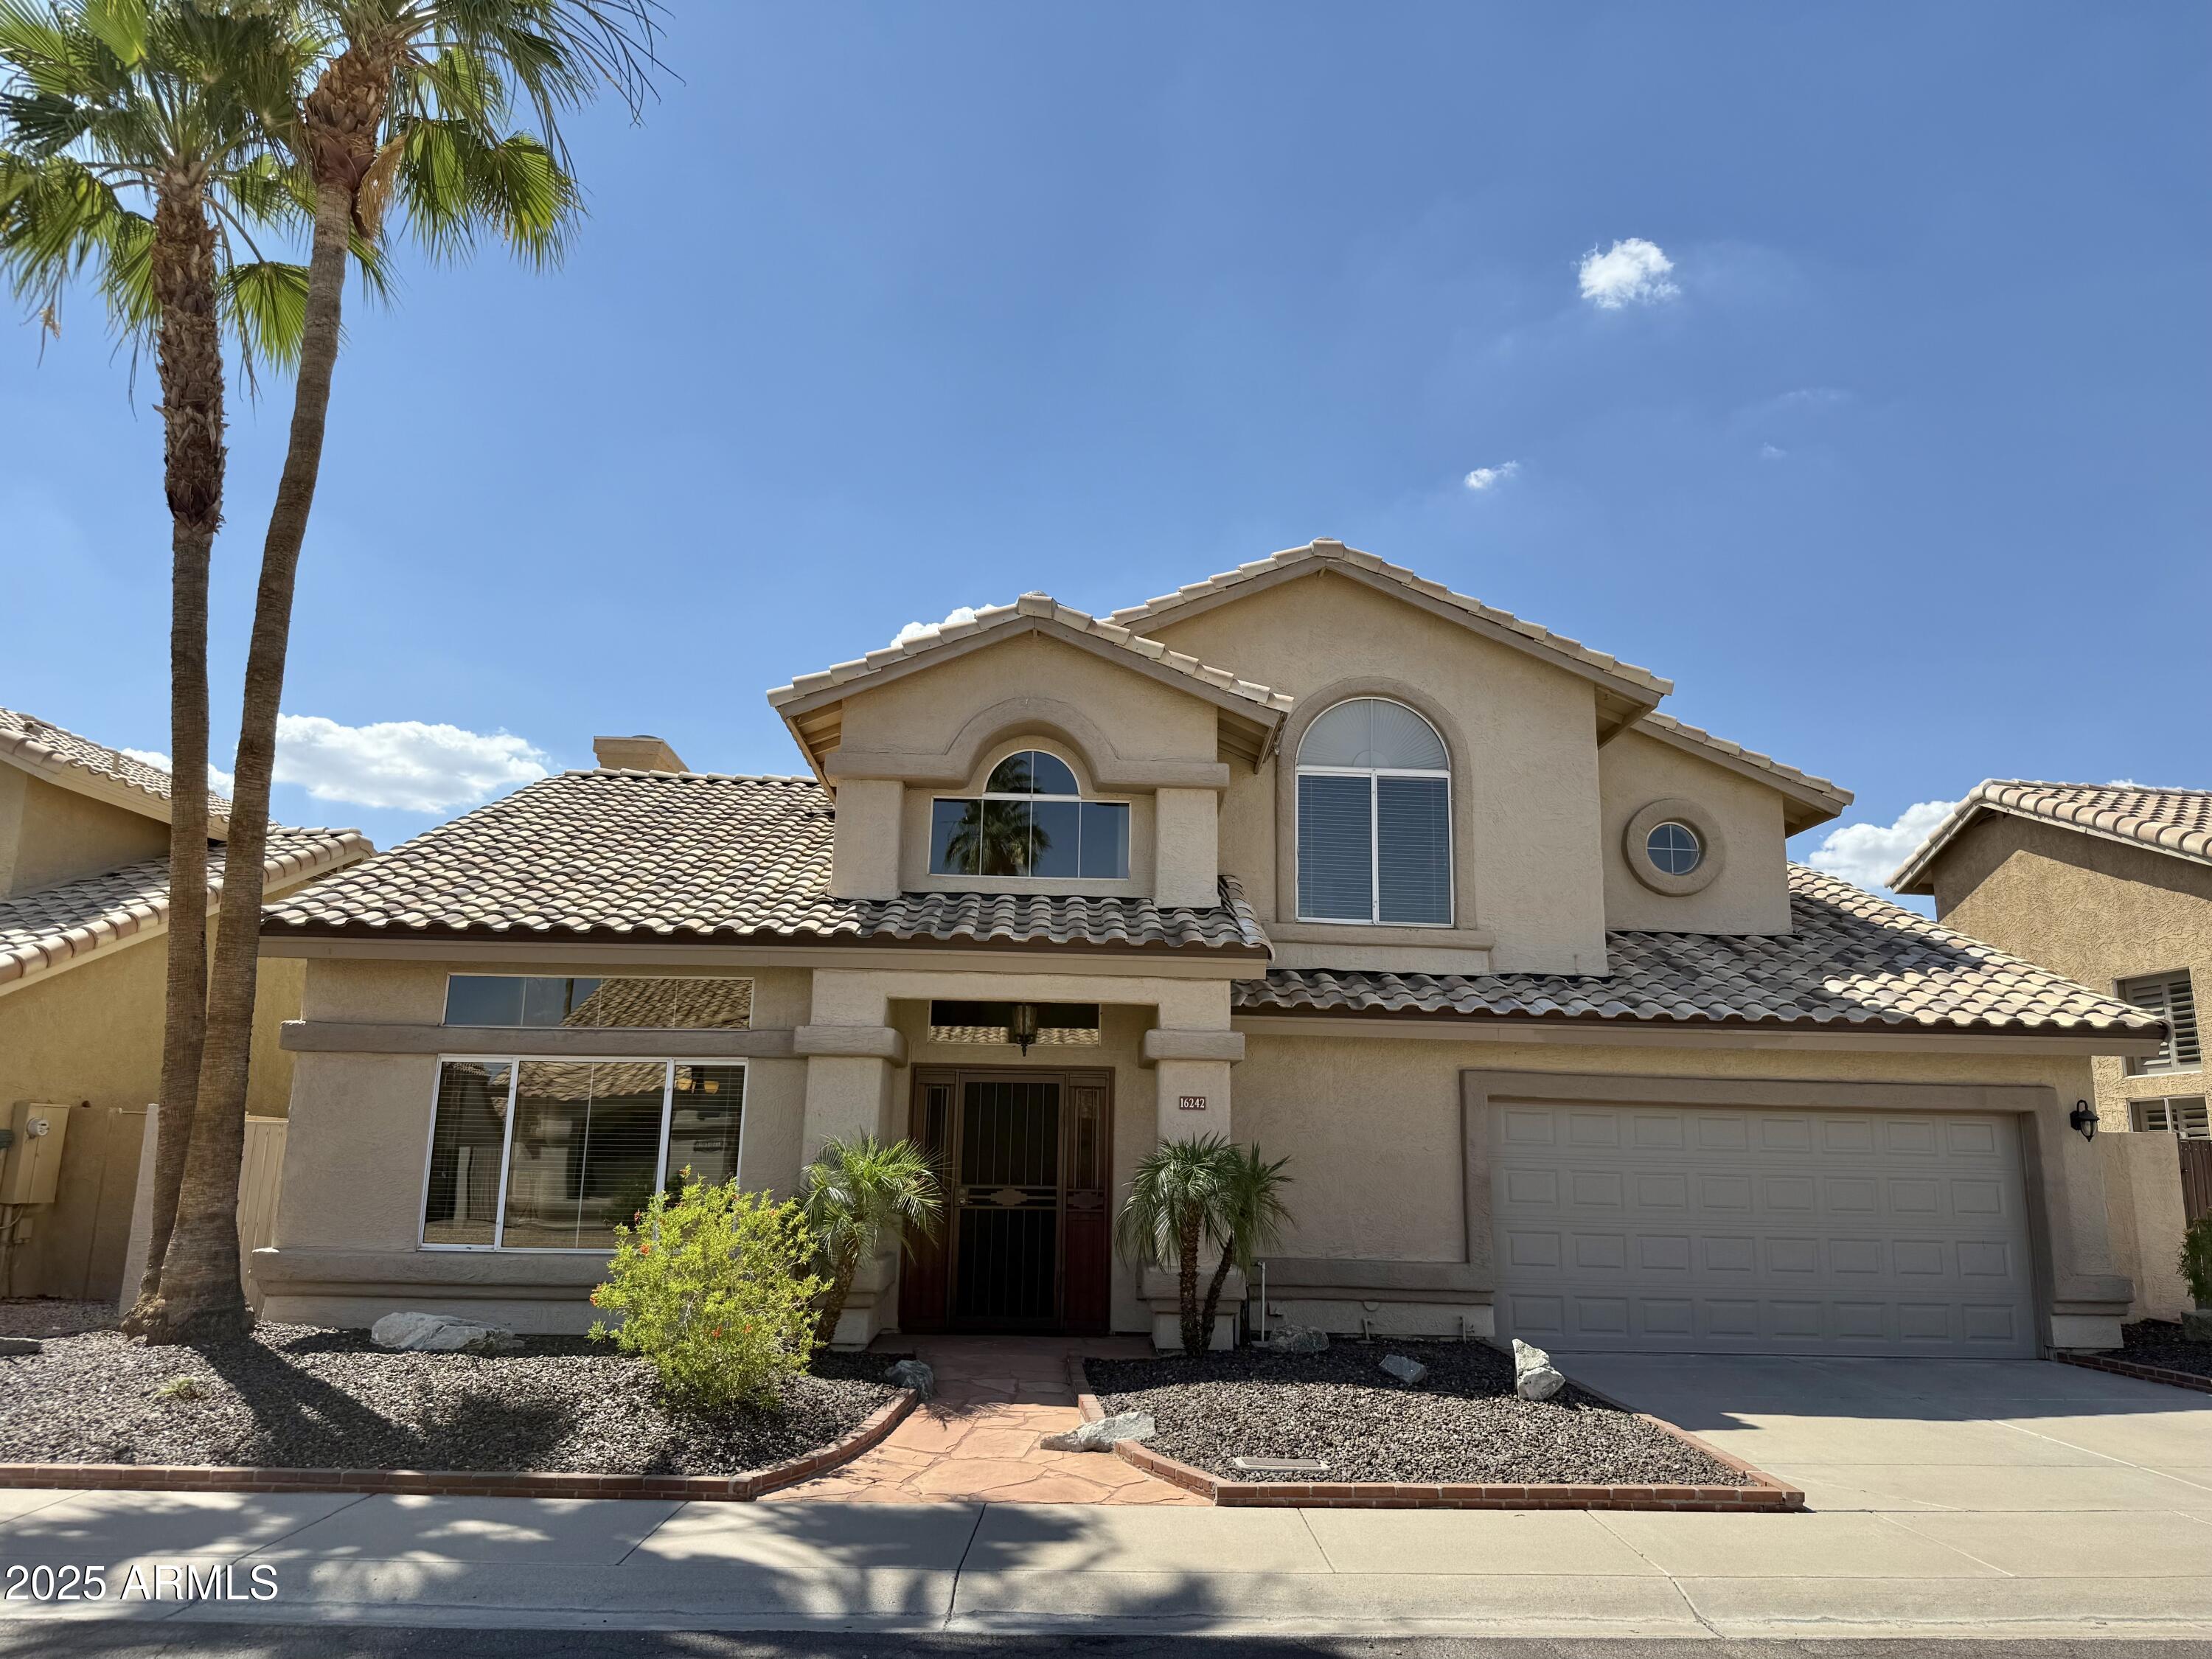
Active
$594,950
3
bds
|
3
ba
|
2,191
sqft
|
built
1992
16242 S 12th Pl, Phoenix, AZ 85048
$-1,233
Cash flow
-10.8%
Cash-on-Cash Return
3.2%
Cap rate
0.5%
Rent to Value Ratio
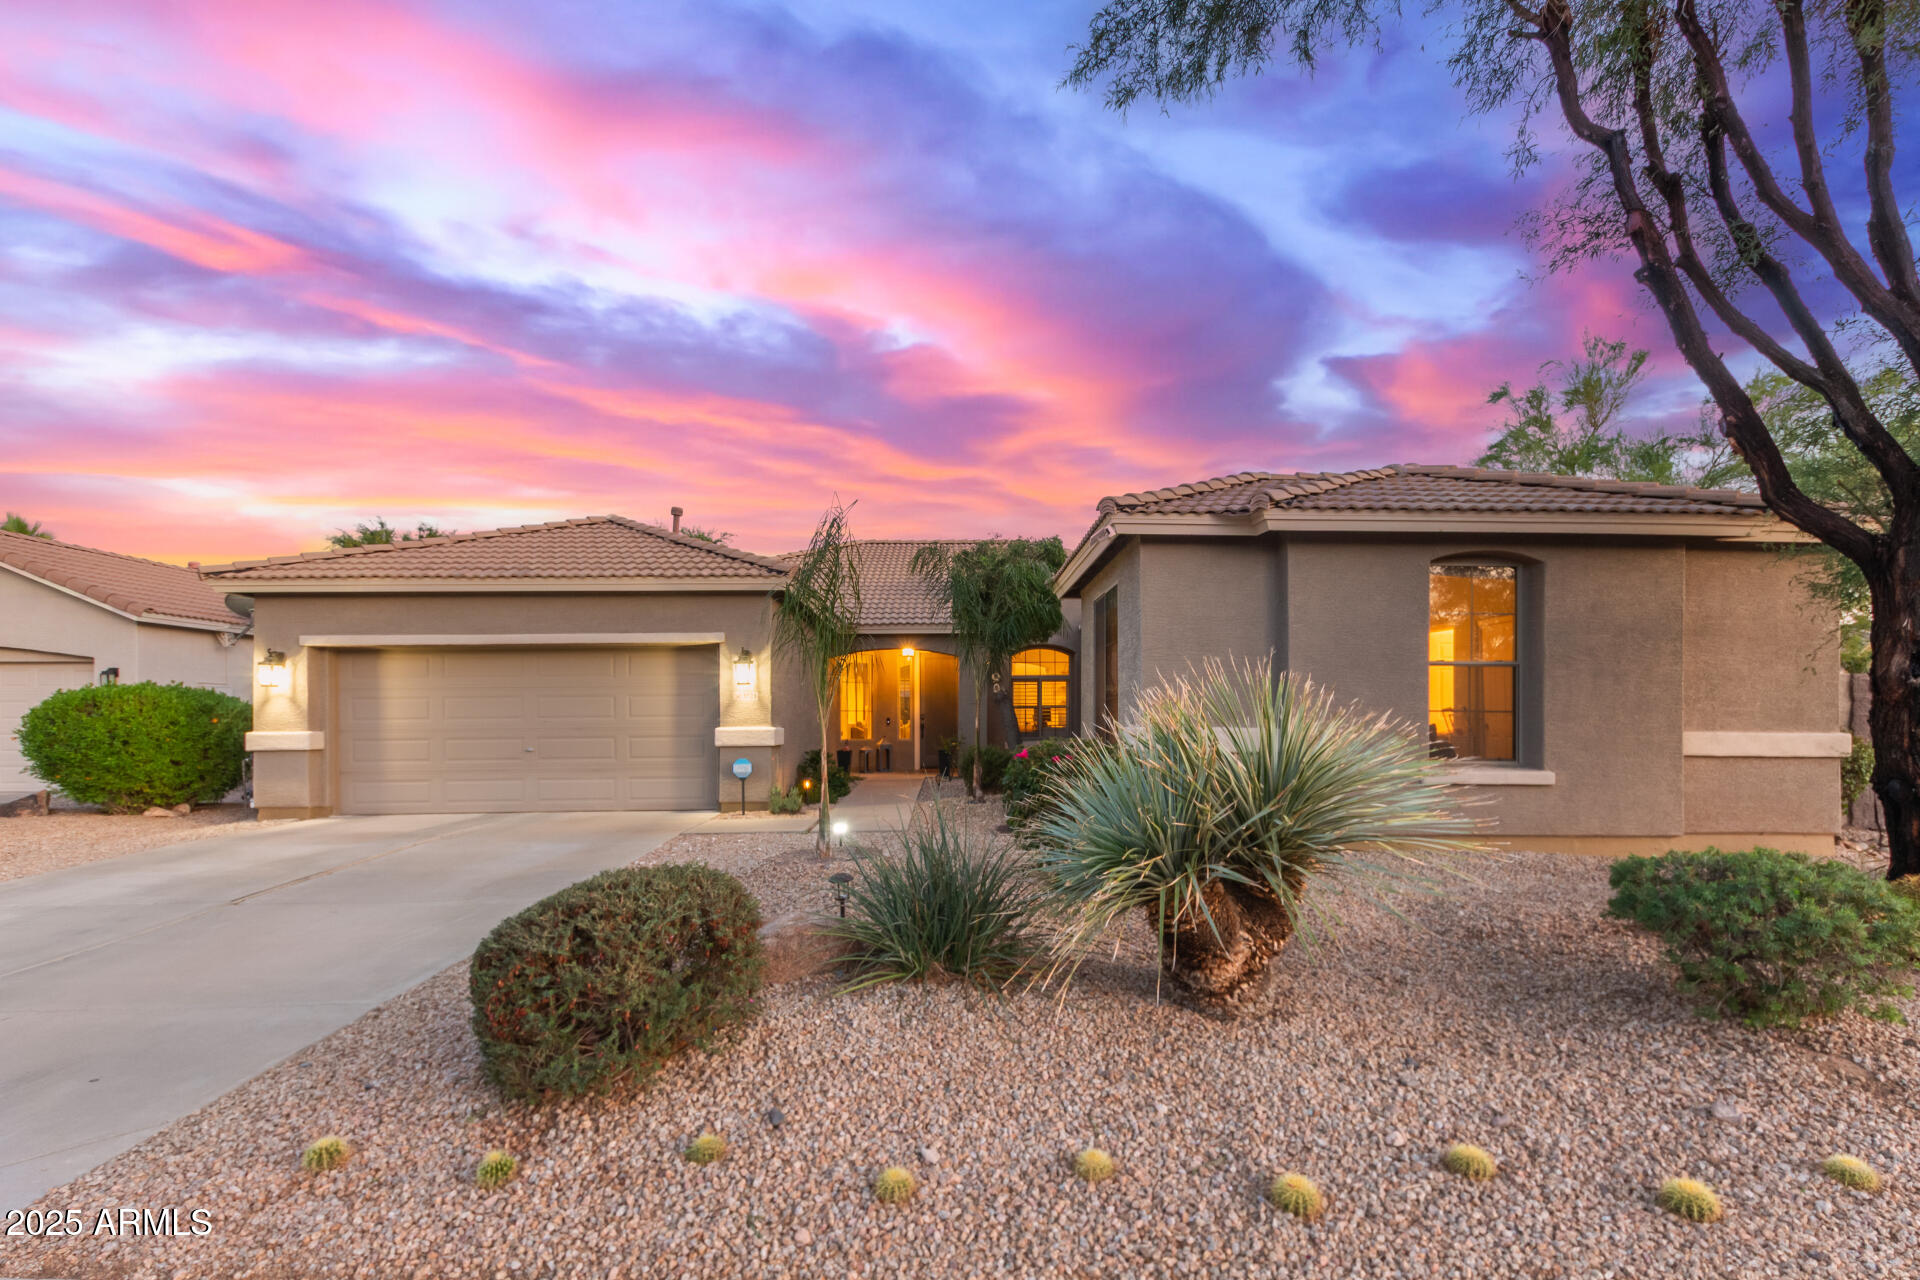
Active
$749,000
4
bds
|
3
ba
|
2,692
sqft
|
built
2003
3523 W Buckhorn Trl, Phoenix, AZ 85083
$-1,596
Cash flow
-11.1%
Cash-on-Cash Return
3.1%
Cap rate
0.4%
Rent to Value Ratio
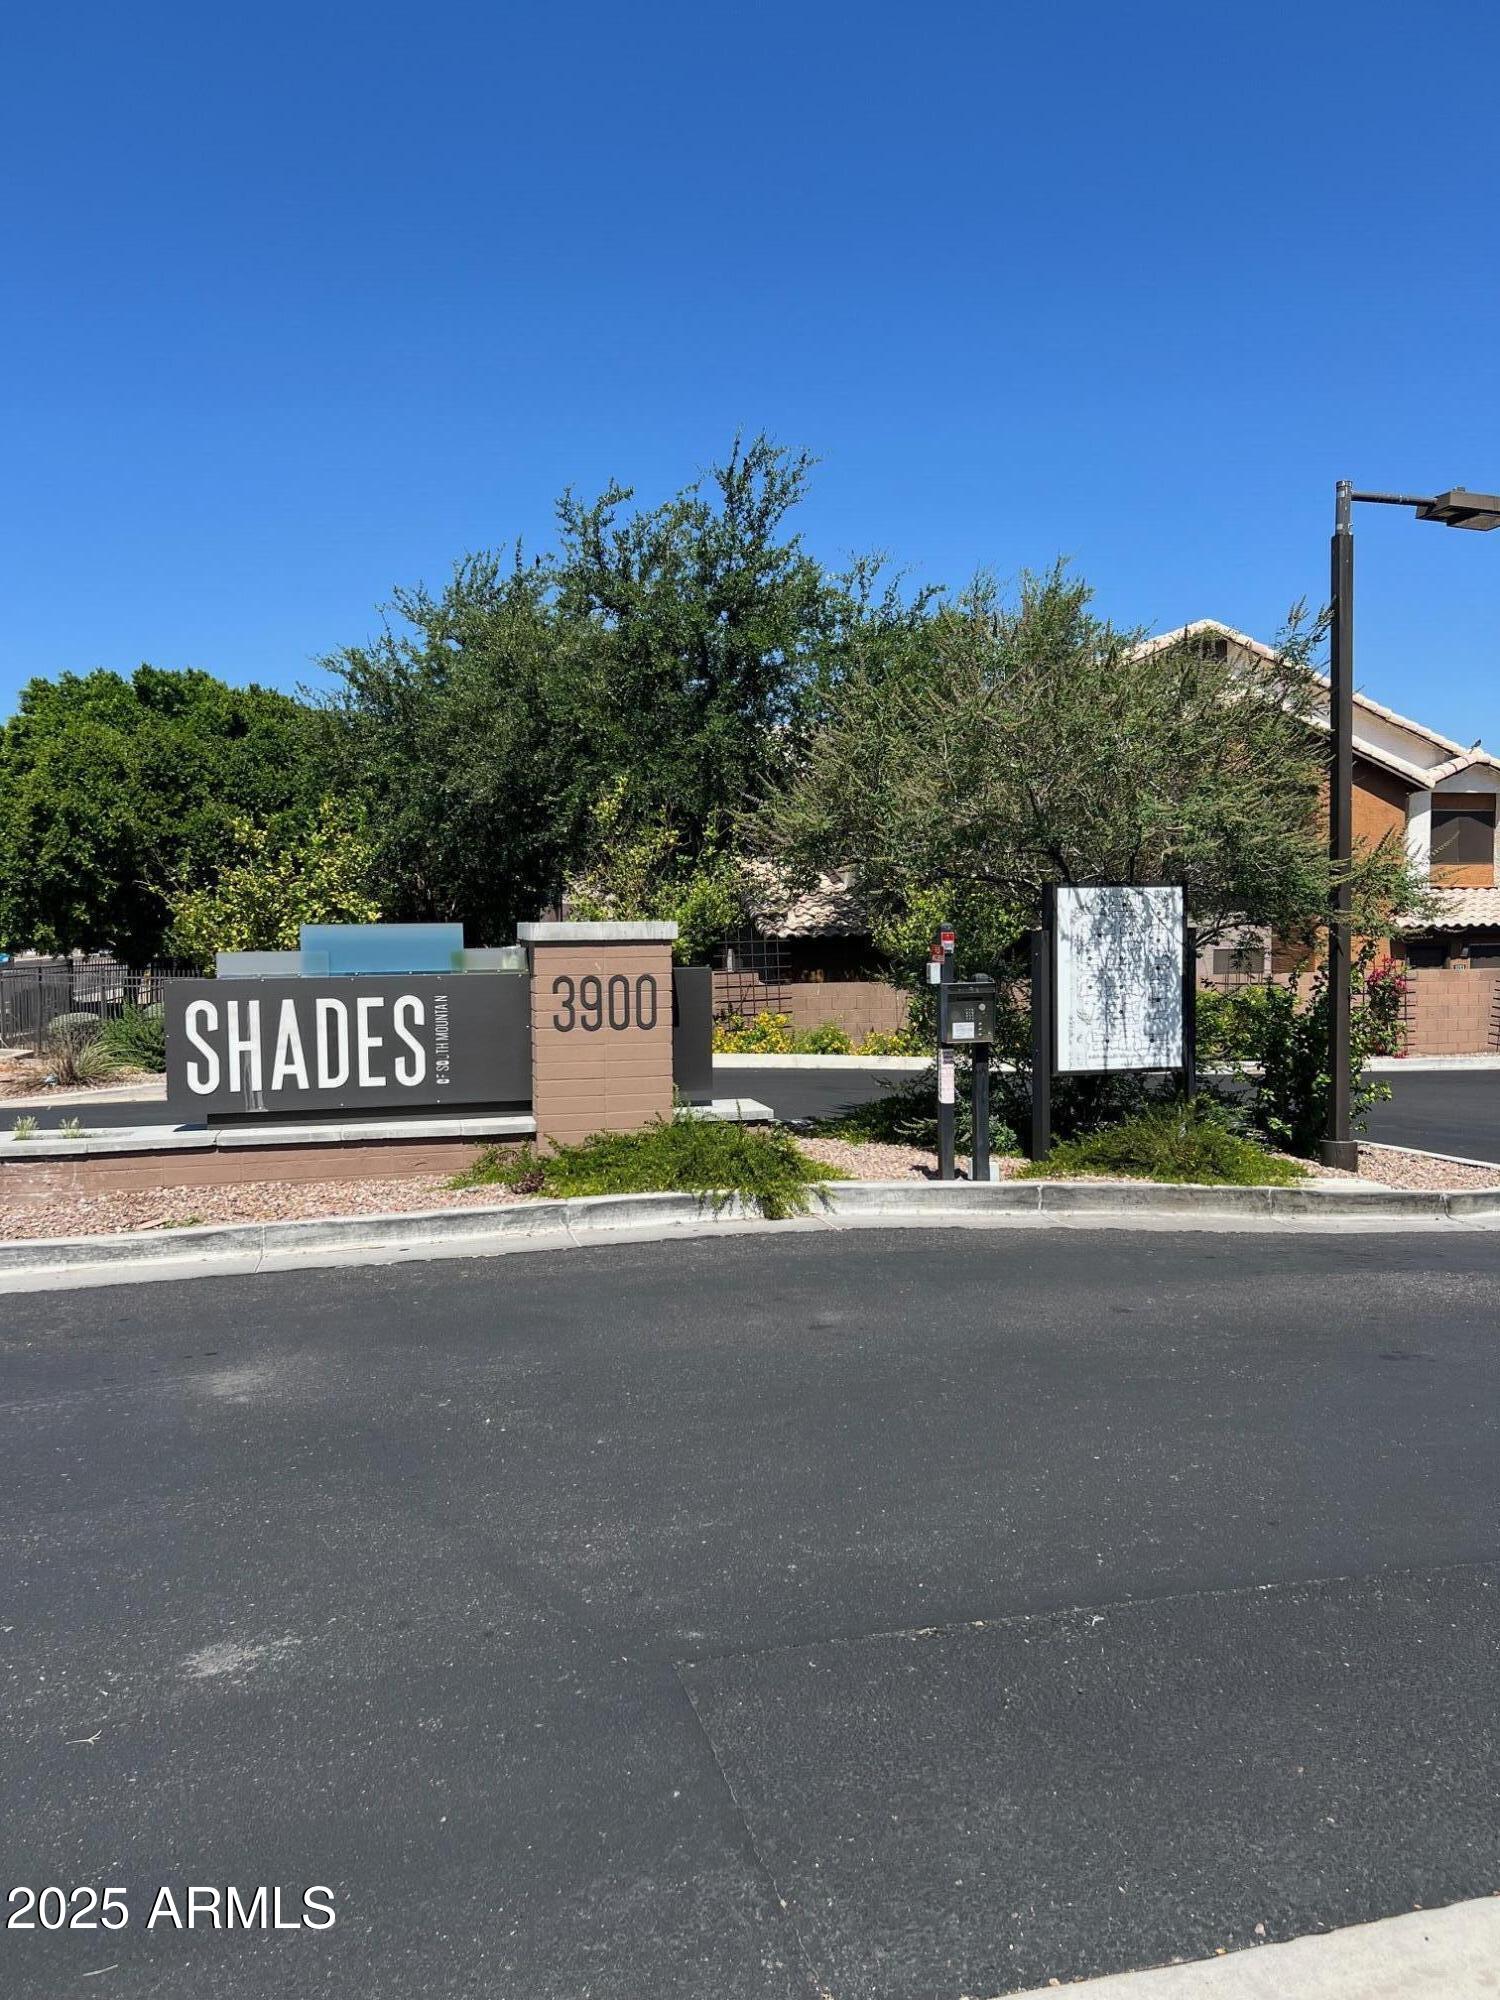
Active
$420,000
3
bds
|
3
ba
|
1,733
sqft
|
built
2019
3900 E Baseline Rd, Phoenix, AZ 85042
$-594
Cash flow
-7.4%
Cash-on-Cash Return
4.0%
Cap rate
0.7%
Rent to Value Ratio
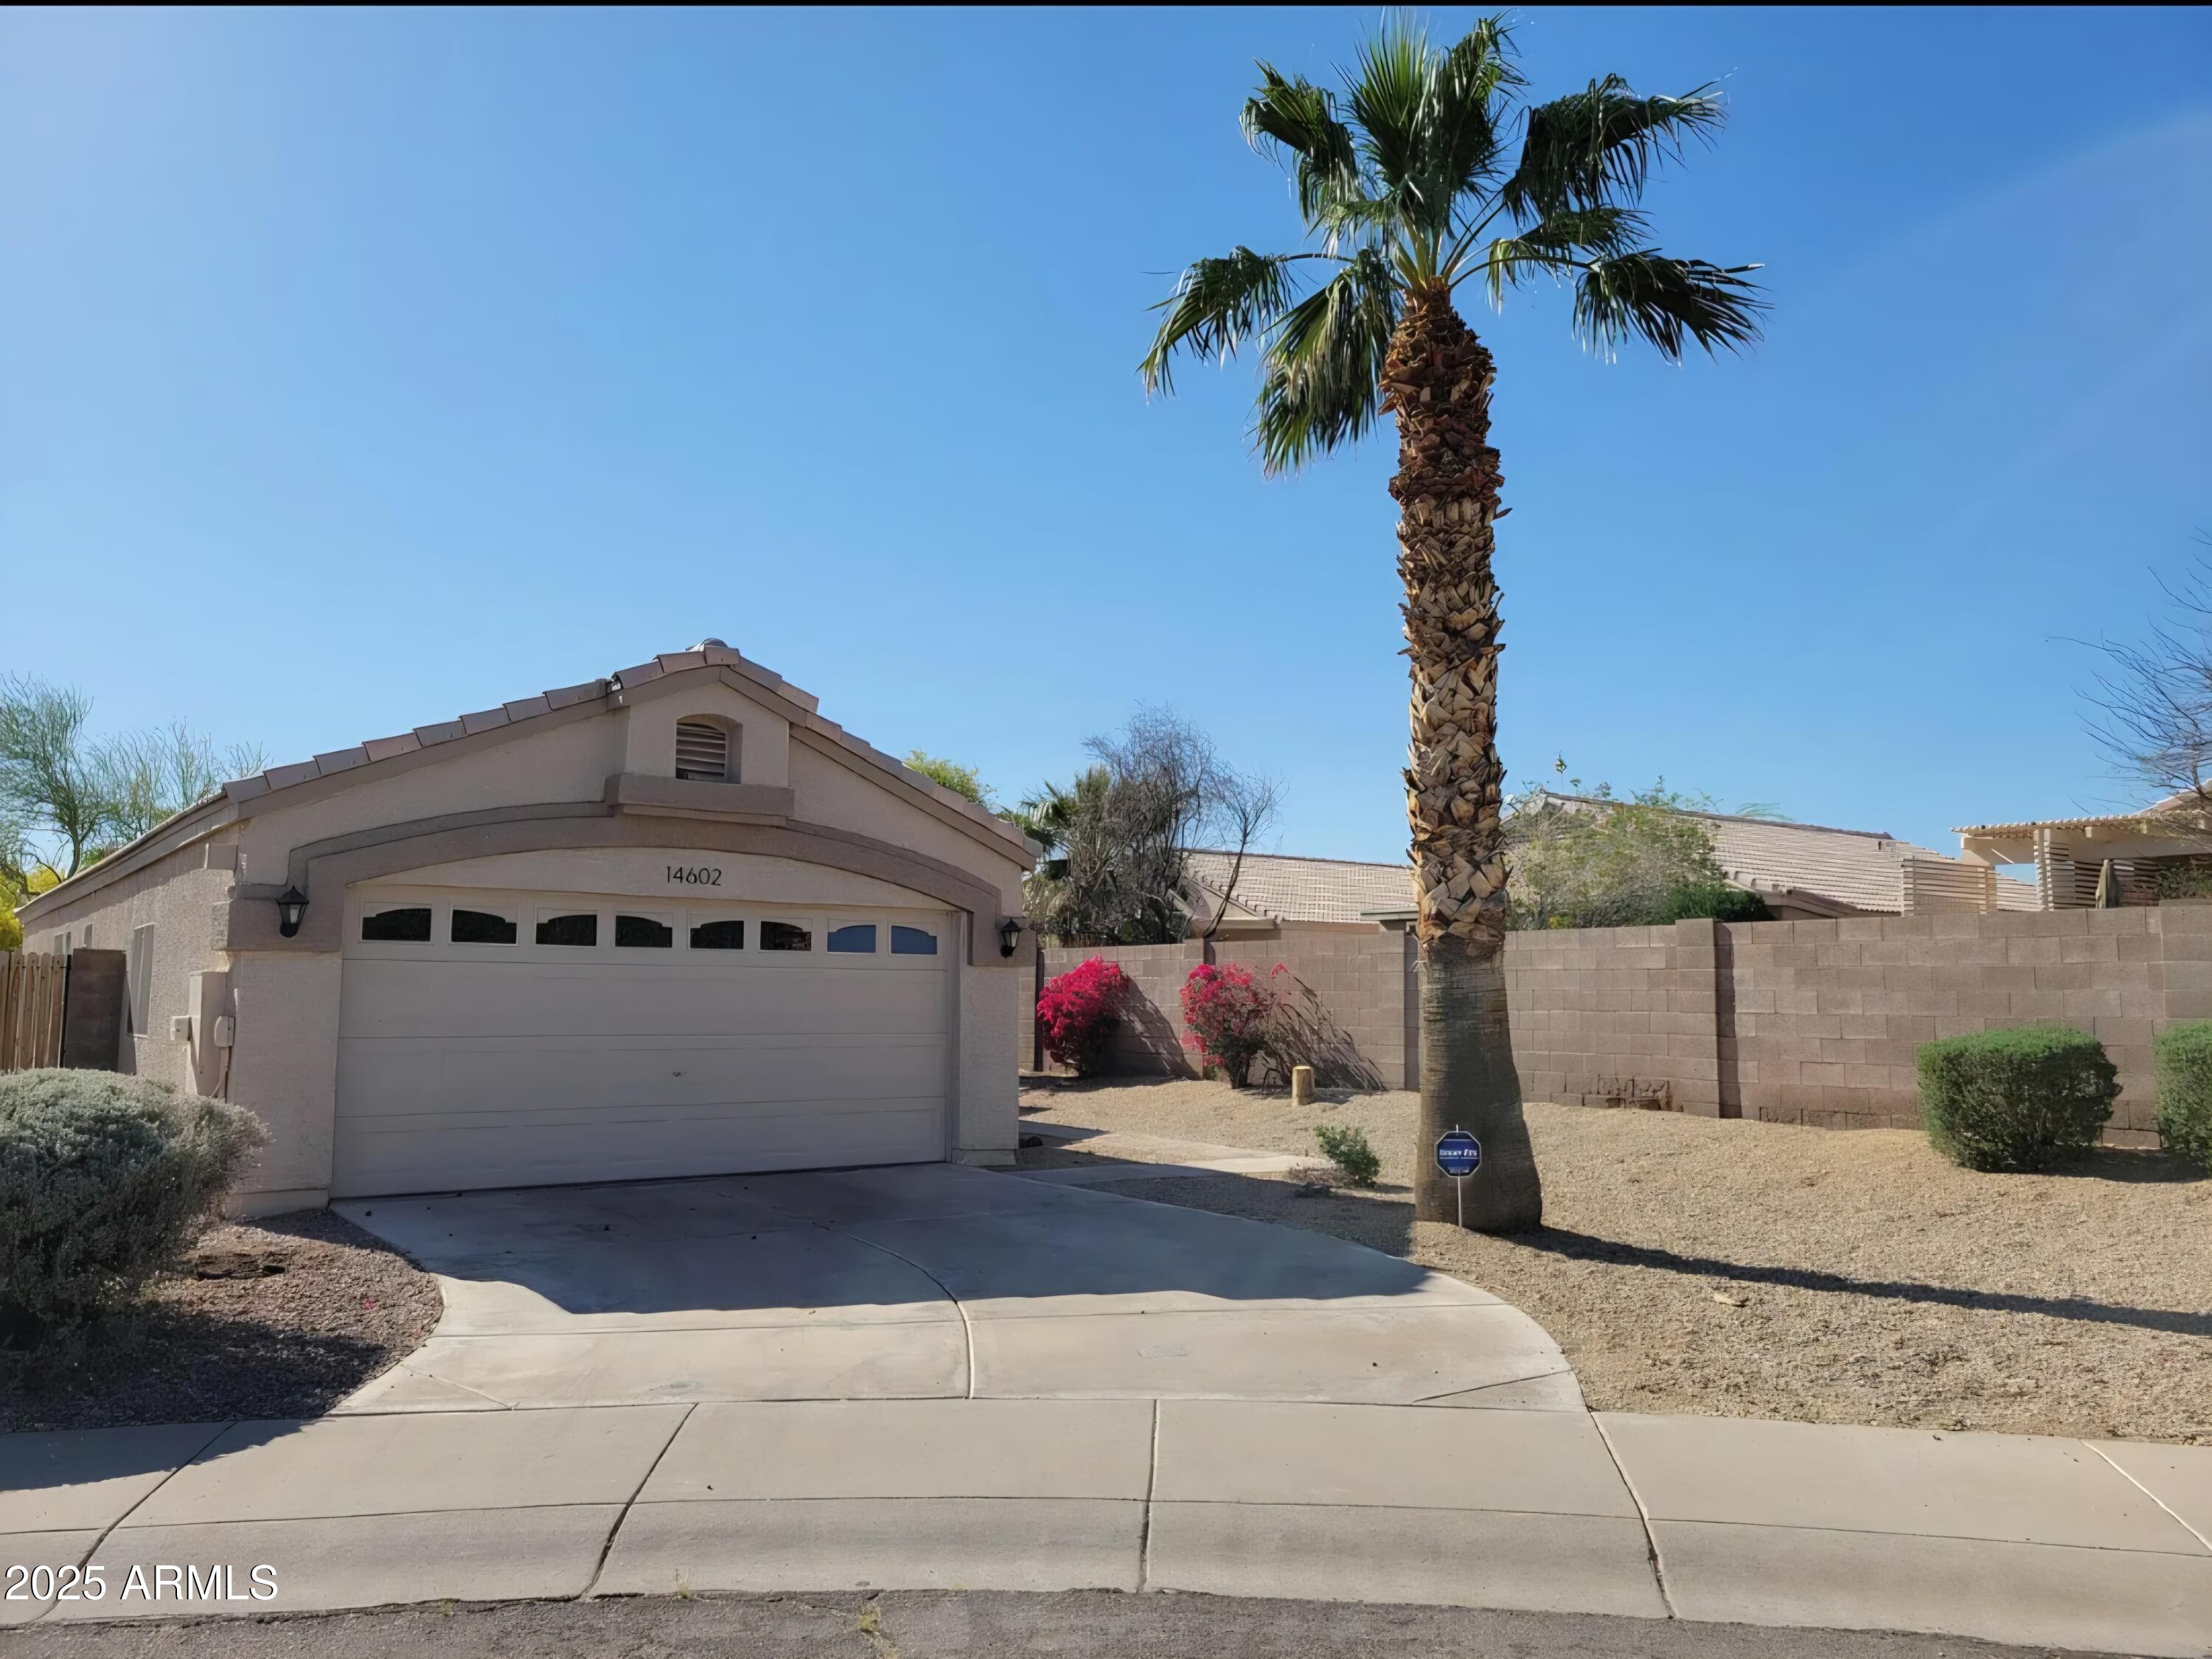
Active
$520,000
3
bds
|
2
ba
|
1,261
sqft
|
built
1994
14602 S 47th St, Phoenix, AZ 85044
$-1,086
Cash flow
-10.9%
Cash-on-Cash Return
3.2%
Cap rate
0.4%
Rent to Value Ratio