Phoenix, AZ Investment Properties for Sale
Browse homes for sale and investment properties in Phoenix, AZ. Refine your search by price, property type, or more.
Best cash flowing properties in Phoenix, AZ
Active
$199,985
2
bds
|
1
ba
|
728
sqft
|
built
1974
6810 N 35th Ave, Phoenix, AZ 85017
$149
Cash flow
3.9%
Cash-on-Cash Return
6.6%
Cap rate
1.0%
Rent to Value Ratio
Active
$249,900
3
bds
|
3
ba
|
1,184
sqft
|
built
1985
19601 N 7th St, Phoenix, AZ 85024
$-291
Cash flow
-6.1%
Cash-on-Cash Return
4.3%
Cap rate
0.7%
Rent to Value Ratio
3,682 out of 4,000 properties for sale in Phoenix, AZ
Limited Results Shown
Create a free account, or log in to reveal all property listings and enjoy the complete experience.

Active
$360,000
3
bds
|
2
ba
|
1,088
sqft
|
built
1983
919 E Villa Maria Dr, Phoenix, AZ 85022
$-598
Cash flow
-8.7%
Cash-on-Cash Return
3.7%
Cap rate
0.5%
Rent to Value Ratio
Active
$199,985
2
bds
|
1
ba
|
728
sqft
|
built
1974
6810 N 35th Ave, Phoenix, AZ 85017
$149
Cash flow
3.9%
Cash-on-Cash Return
6.6%
Cap rate
1.0%
Rent to Value Ratio
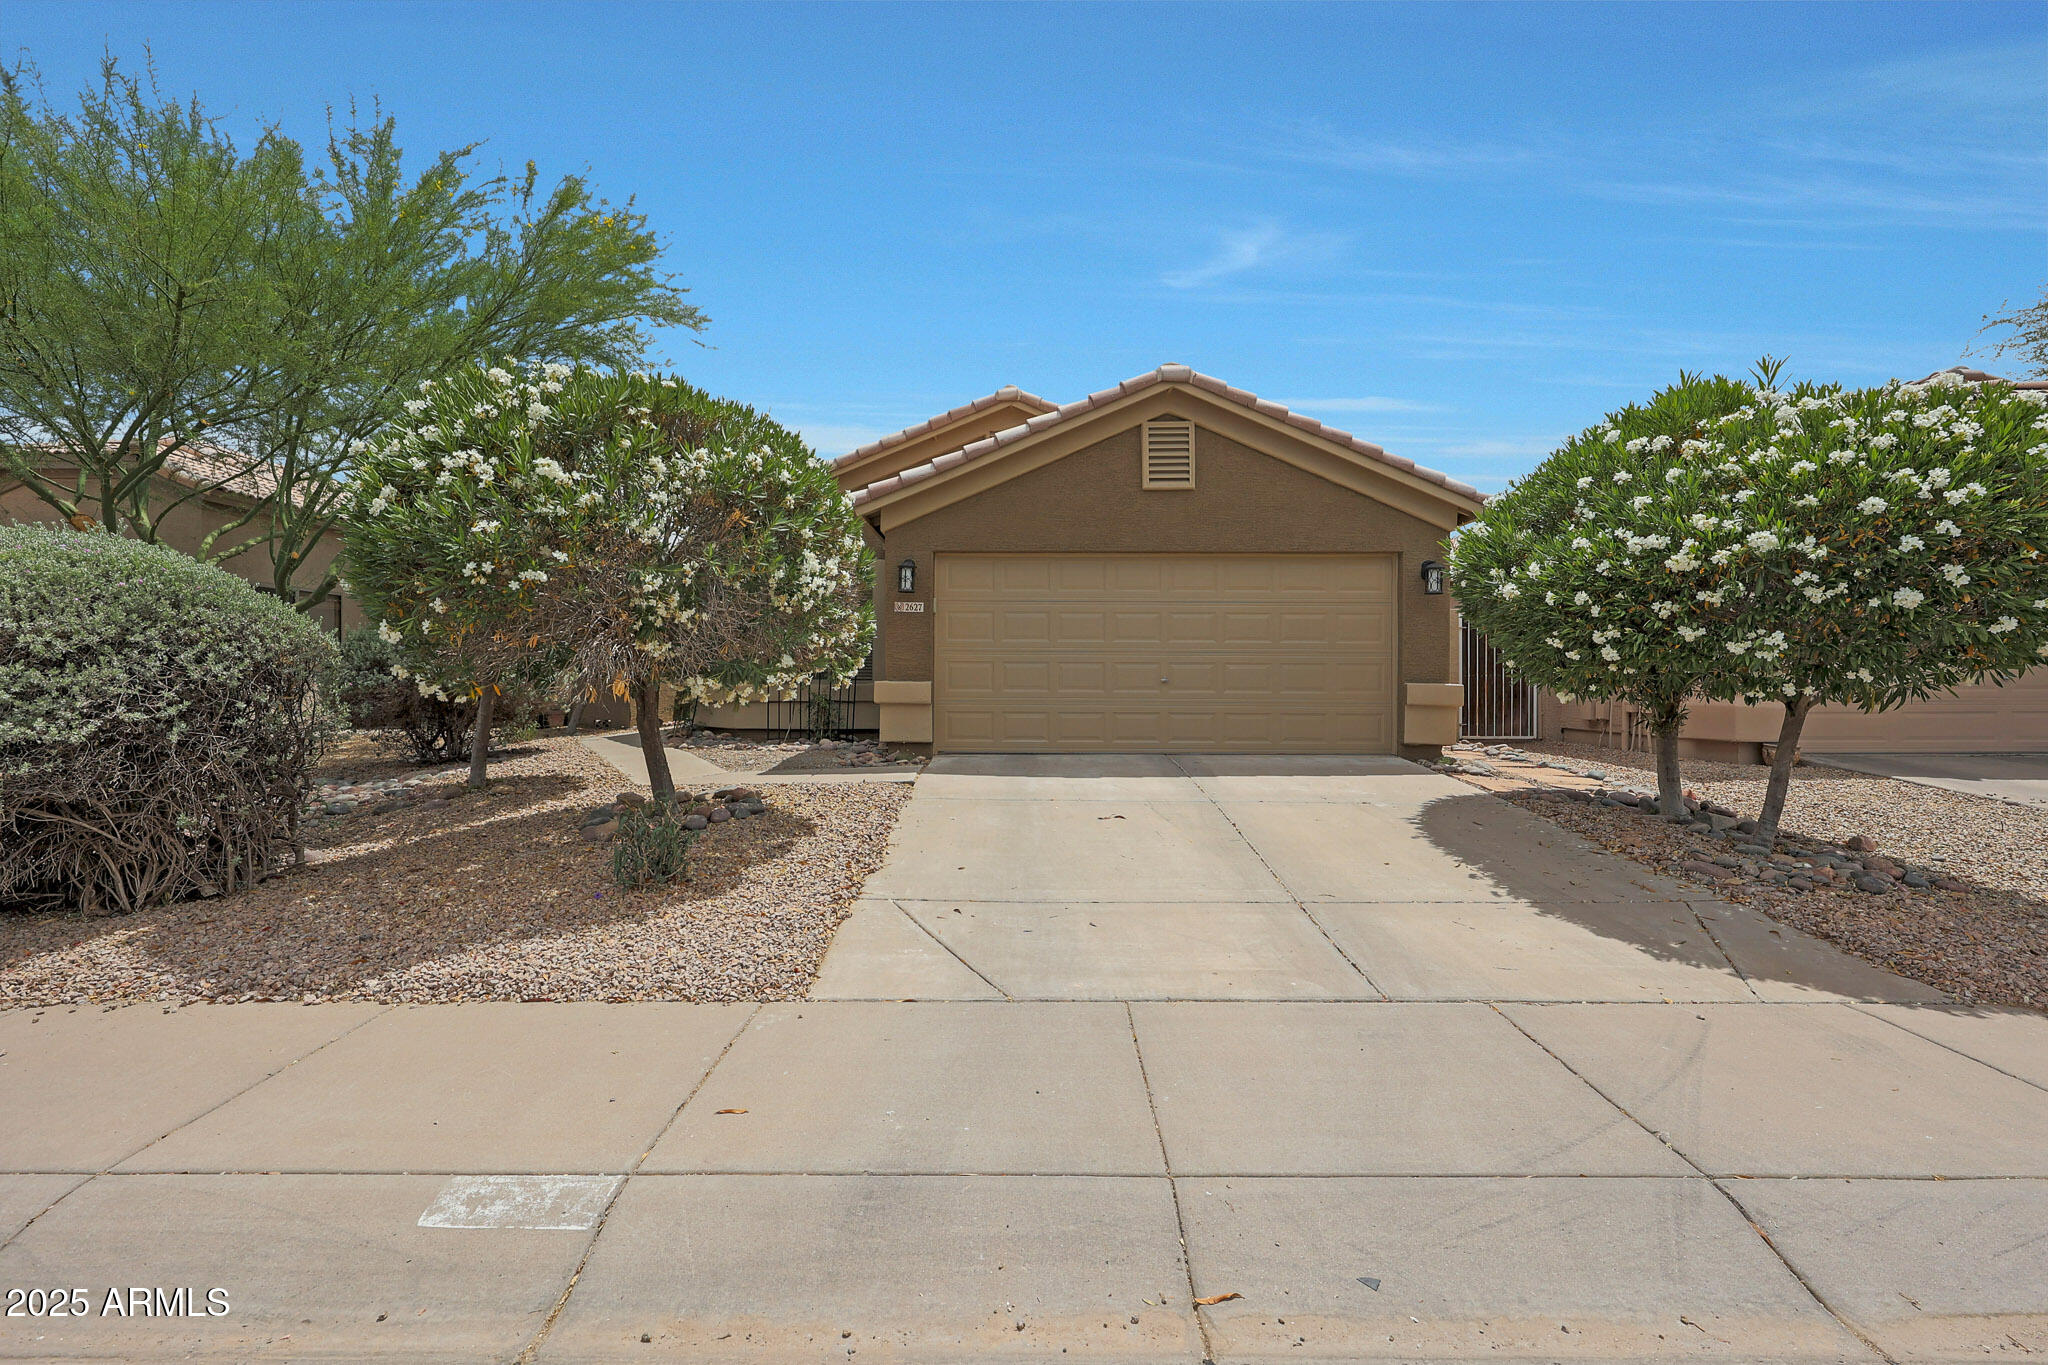
Active
$465,000
3
bds
|
2
ba
|
1,502
sqft
|
built
1999
2627 E Gary Way, Phoenix, AZ 85042
$-978
Cash flow
-11.0%
Cash-on-Cash Return
3.2%
Cap rate
0.5%
Rent to Value Ratio
Active
$305,000
2
bds
|
2
ba
|
1,015
sqft
|
built
1984
8653 S 51st St, Phoenix, AZ 85044
$-703
Cash flow
-12.0%
Cash-on-Cash Return
2.9%
Cap rate
0.6%
Rent to Value Ratio
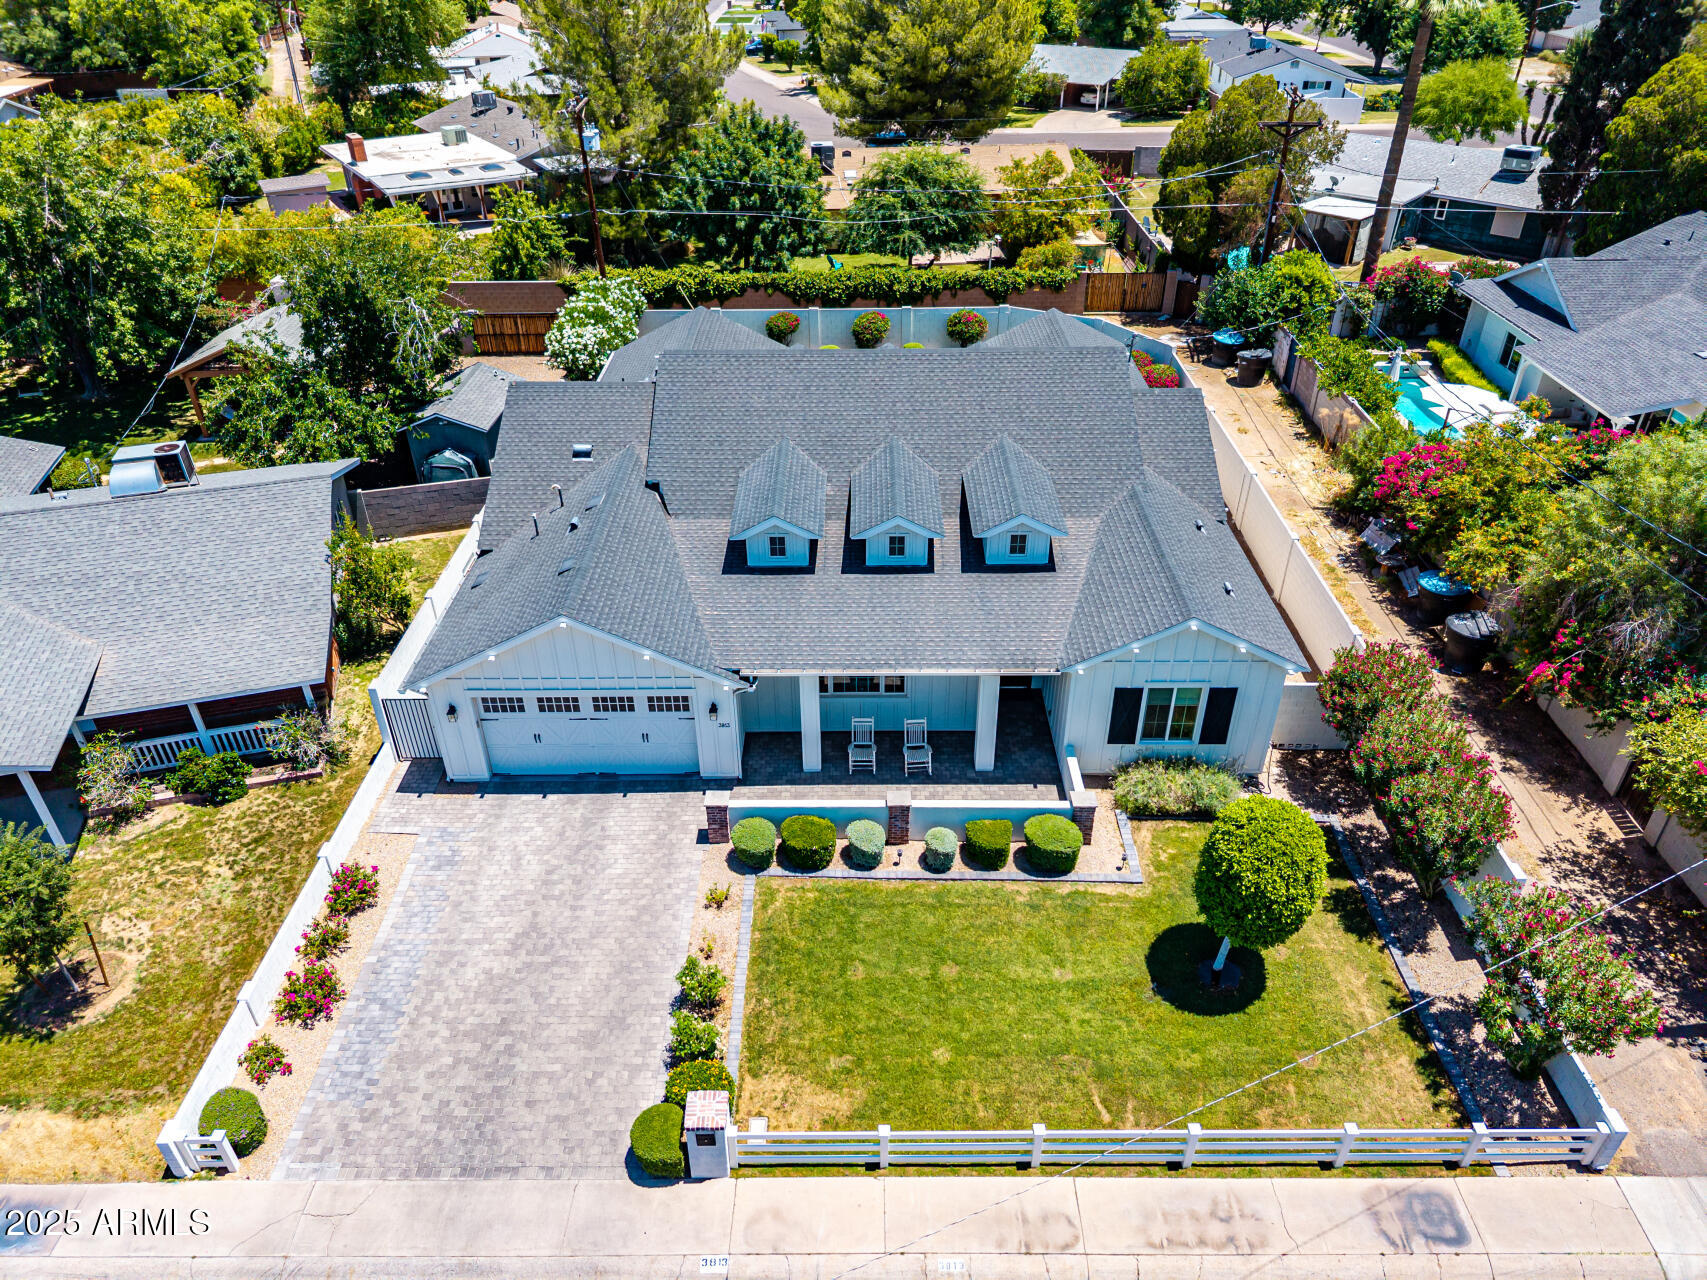
Active
$1,699,000
4
bds
|
4
ba
|
2,810
sqft
|
built
2018
3813 N 37th St, Phoenix, AZ 85018
$-5,206
Cash flow
-16.0%
Cash-on-Cash Return
2.0%
Cap rate
0.3%
Rent to Value Ratio
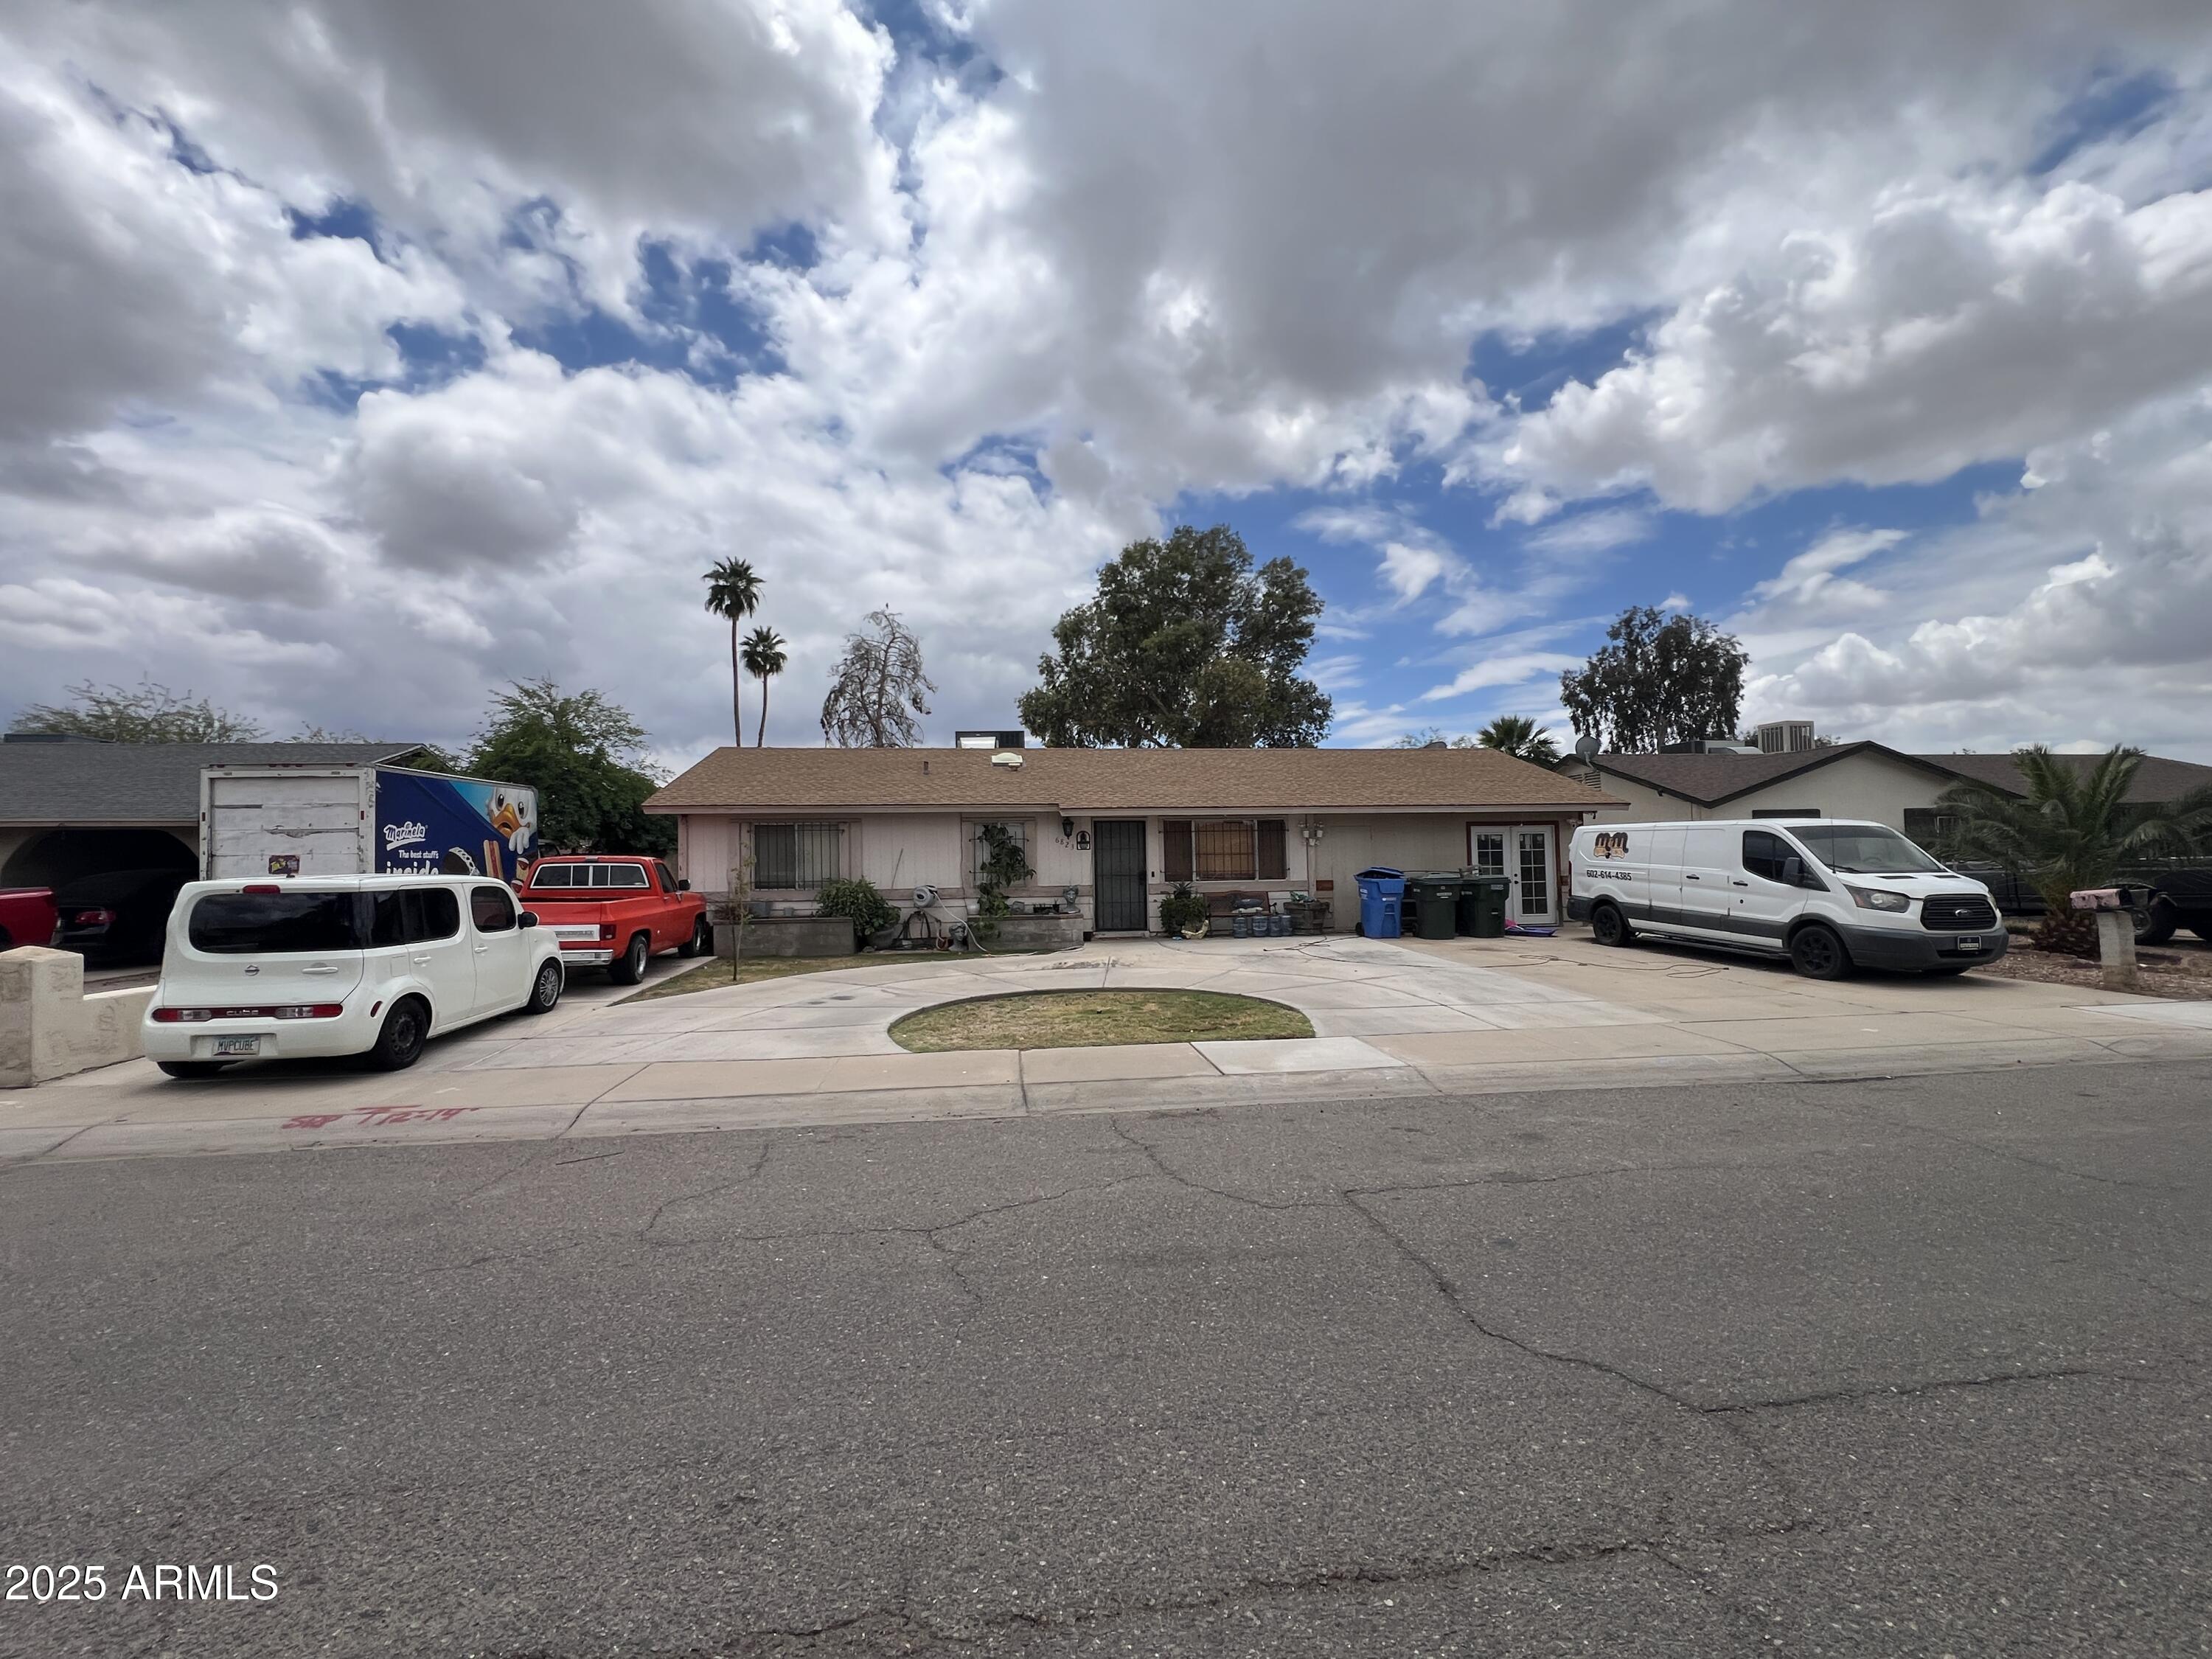
Active
$285,000
3
bds
|
2
ba
|
1,080
sqft
|
built
1981
6823 W Garfield St, Phoenix, AZ 85043
$-299
Cash flow
-5.5%
Cash-on-Cash Return
4.4%
Cap rate
0.6%
Rent to Value Ratio
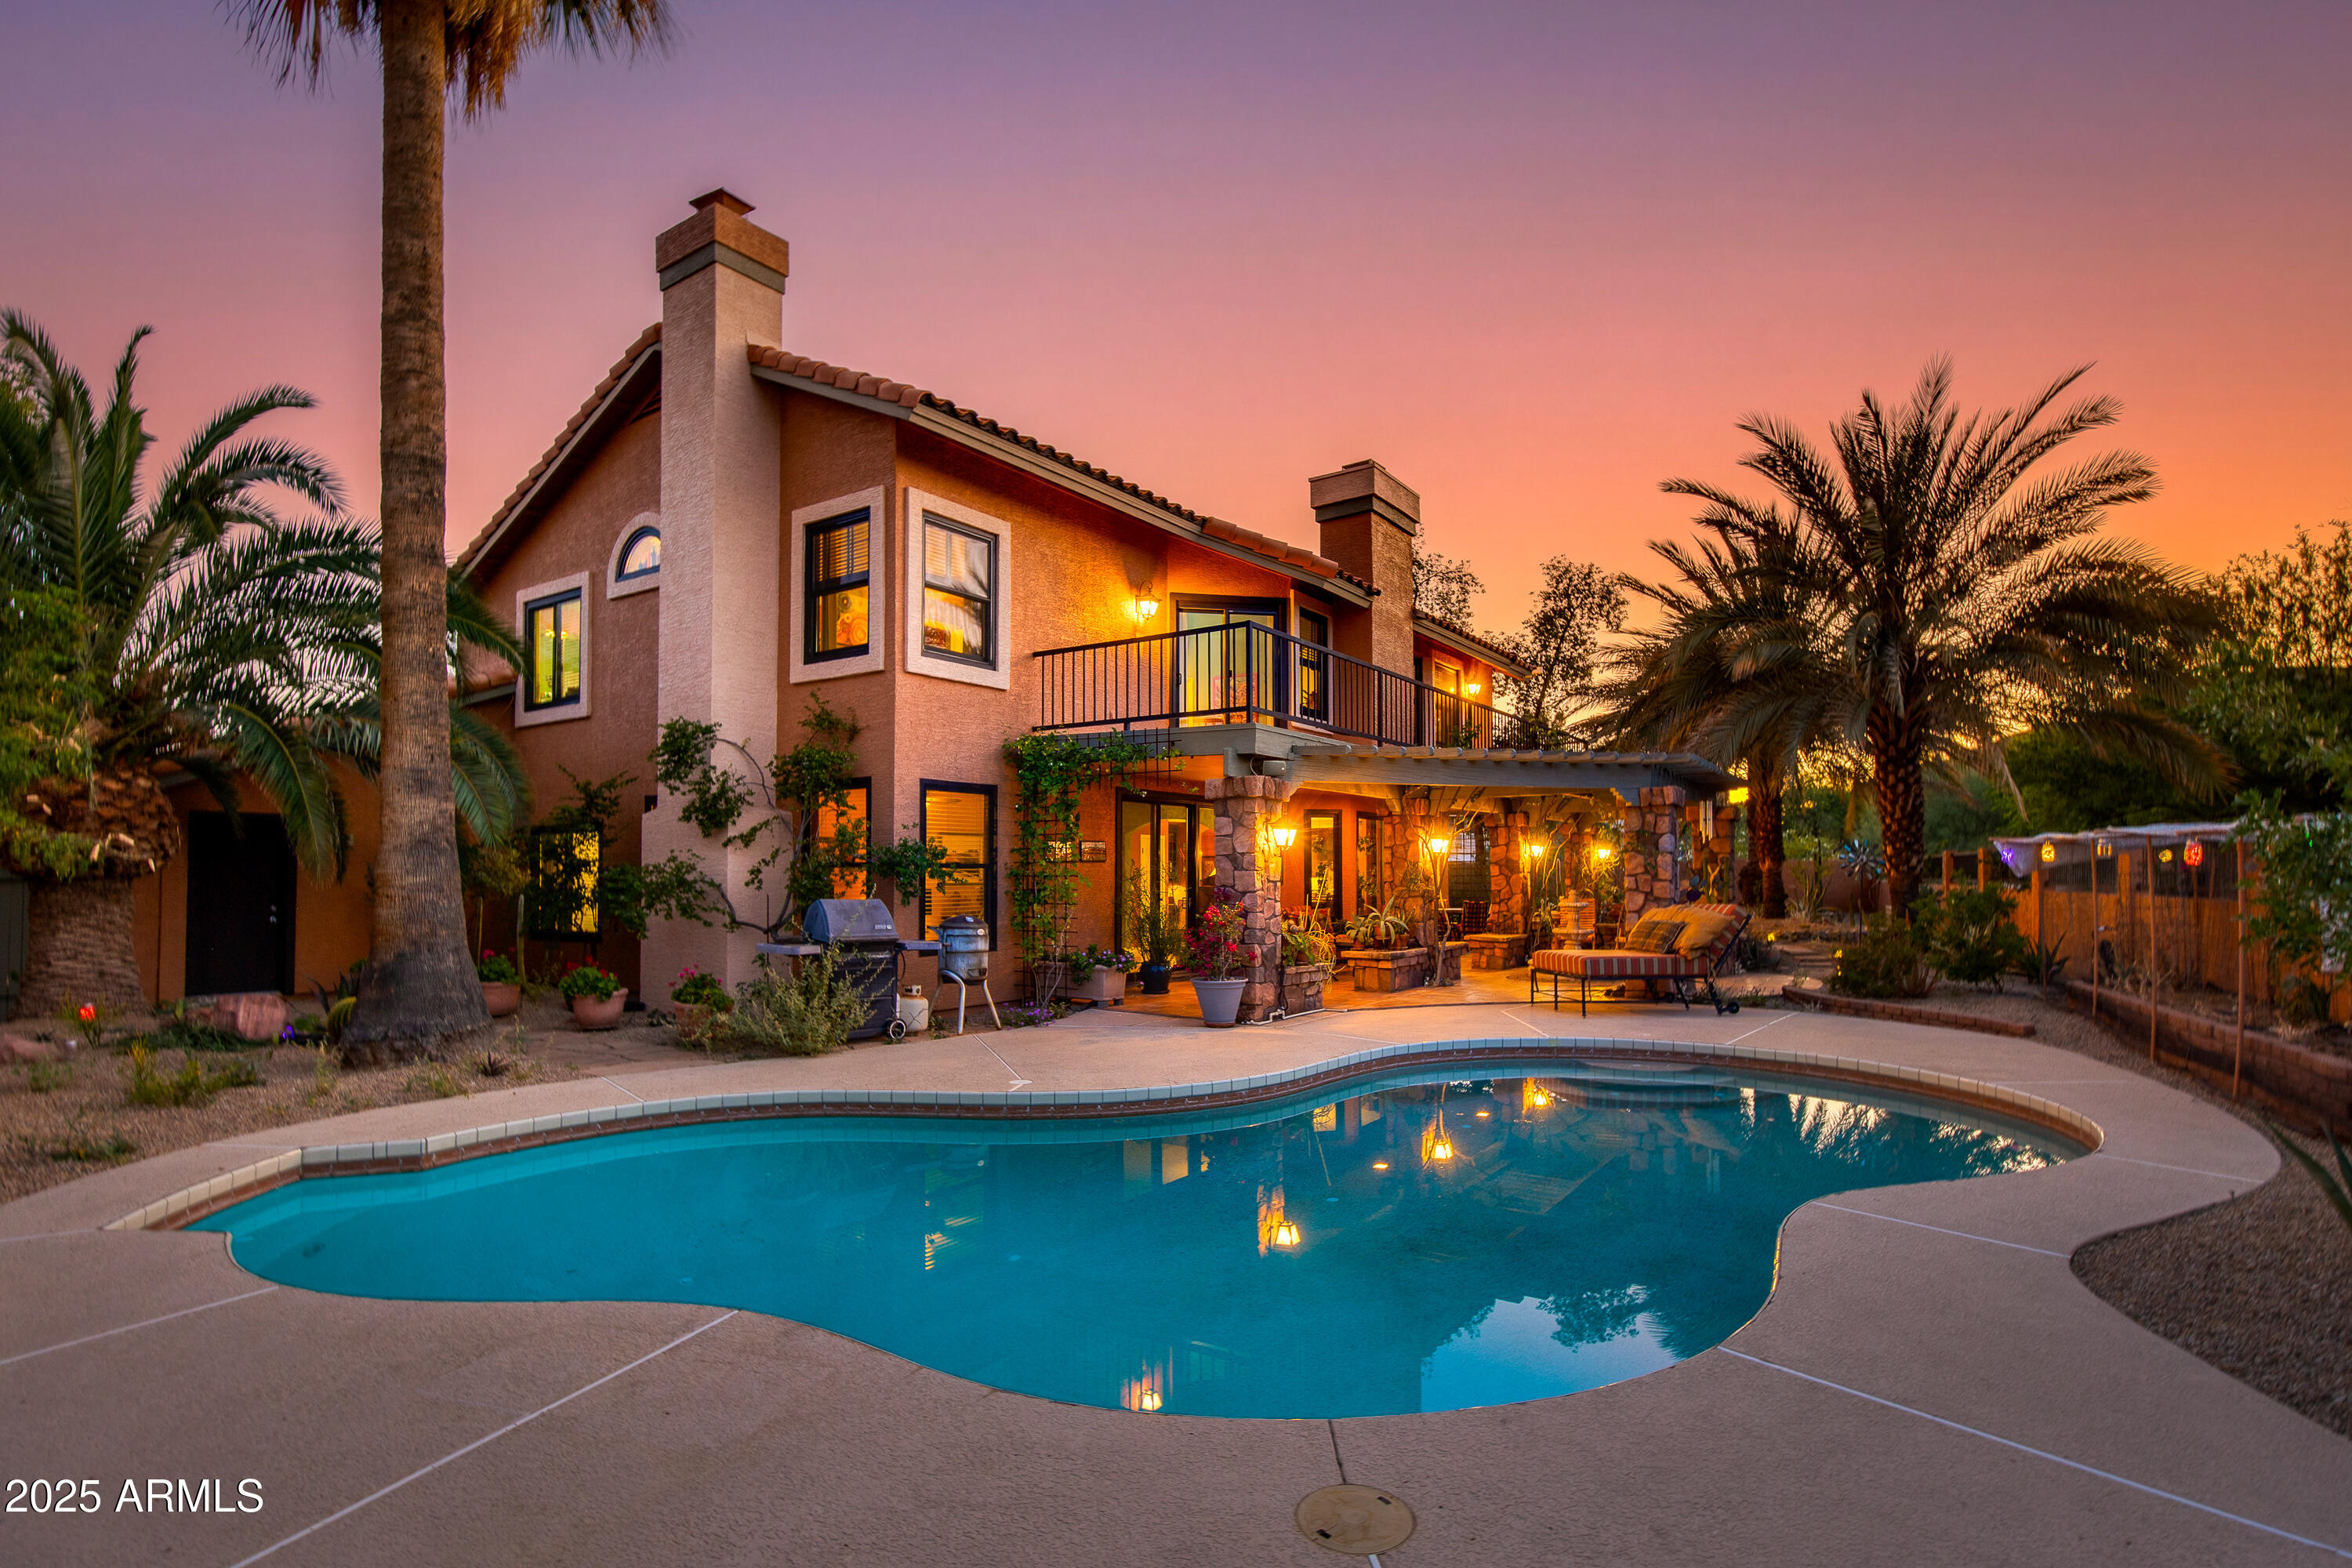
Active
$867,500
4
bds
|
3
ba
|
2,968
sqft
|
built
1989
3416 E Squawbush Pl, Phoenix, AZ 85044
$-2,093
Cash flow
-12.6%
Cash-on-Cash Return
2.8%
Cap rate
0.4%
Rent to Value Ratio
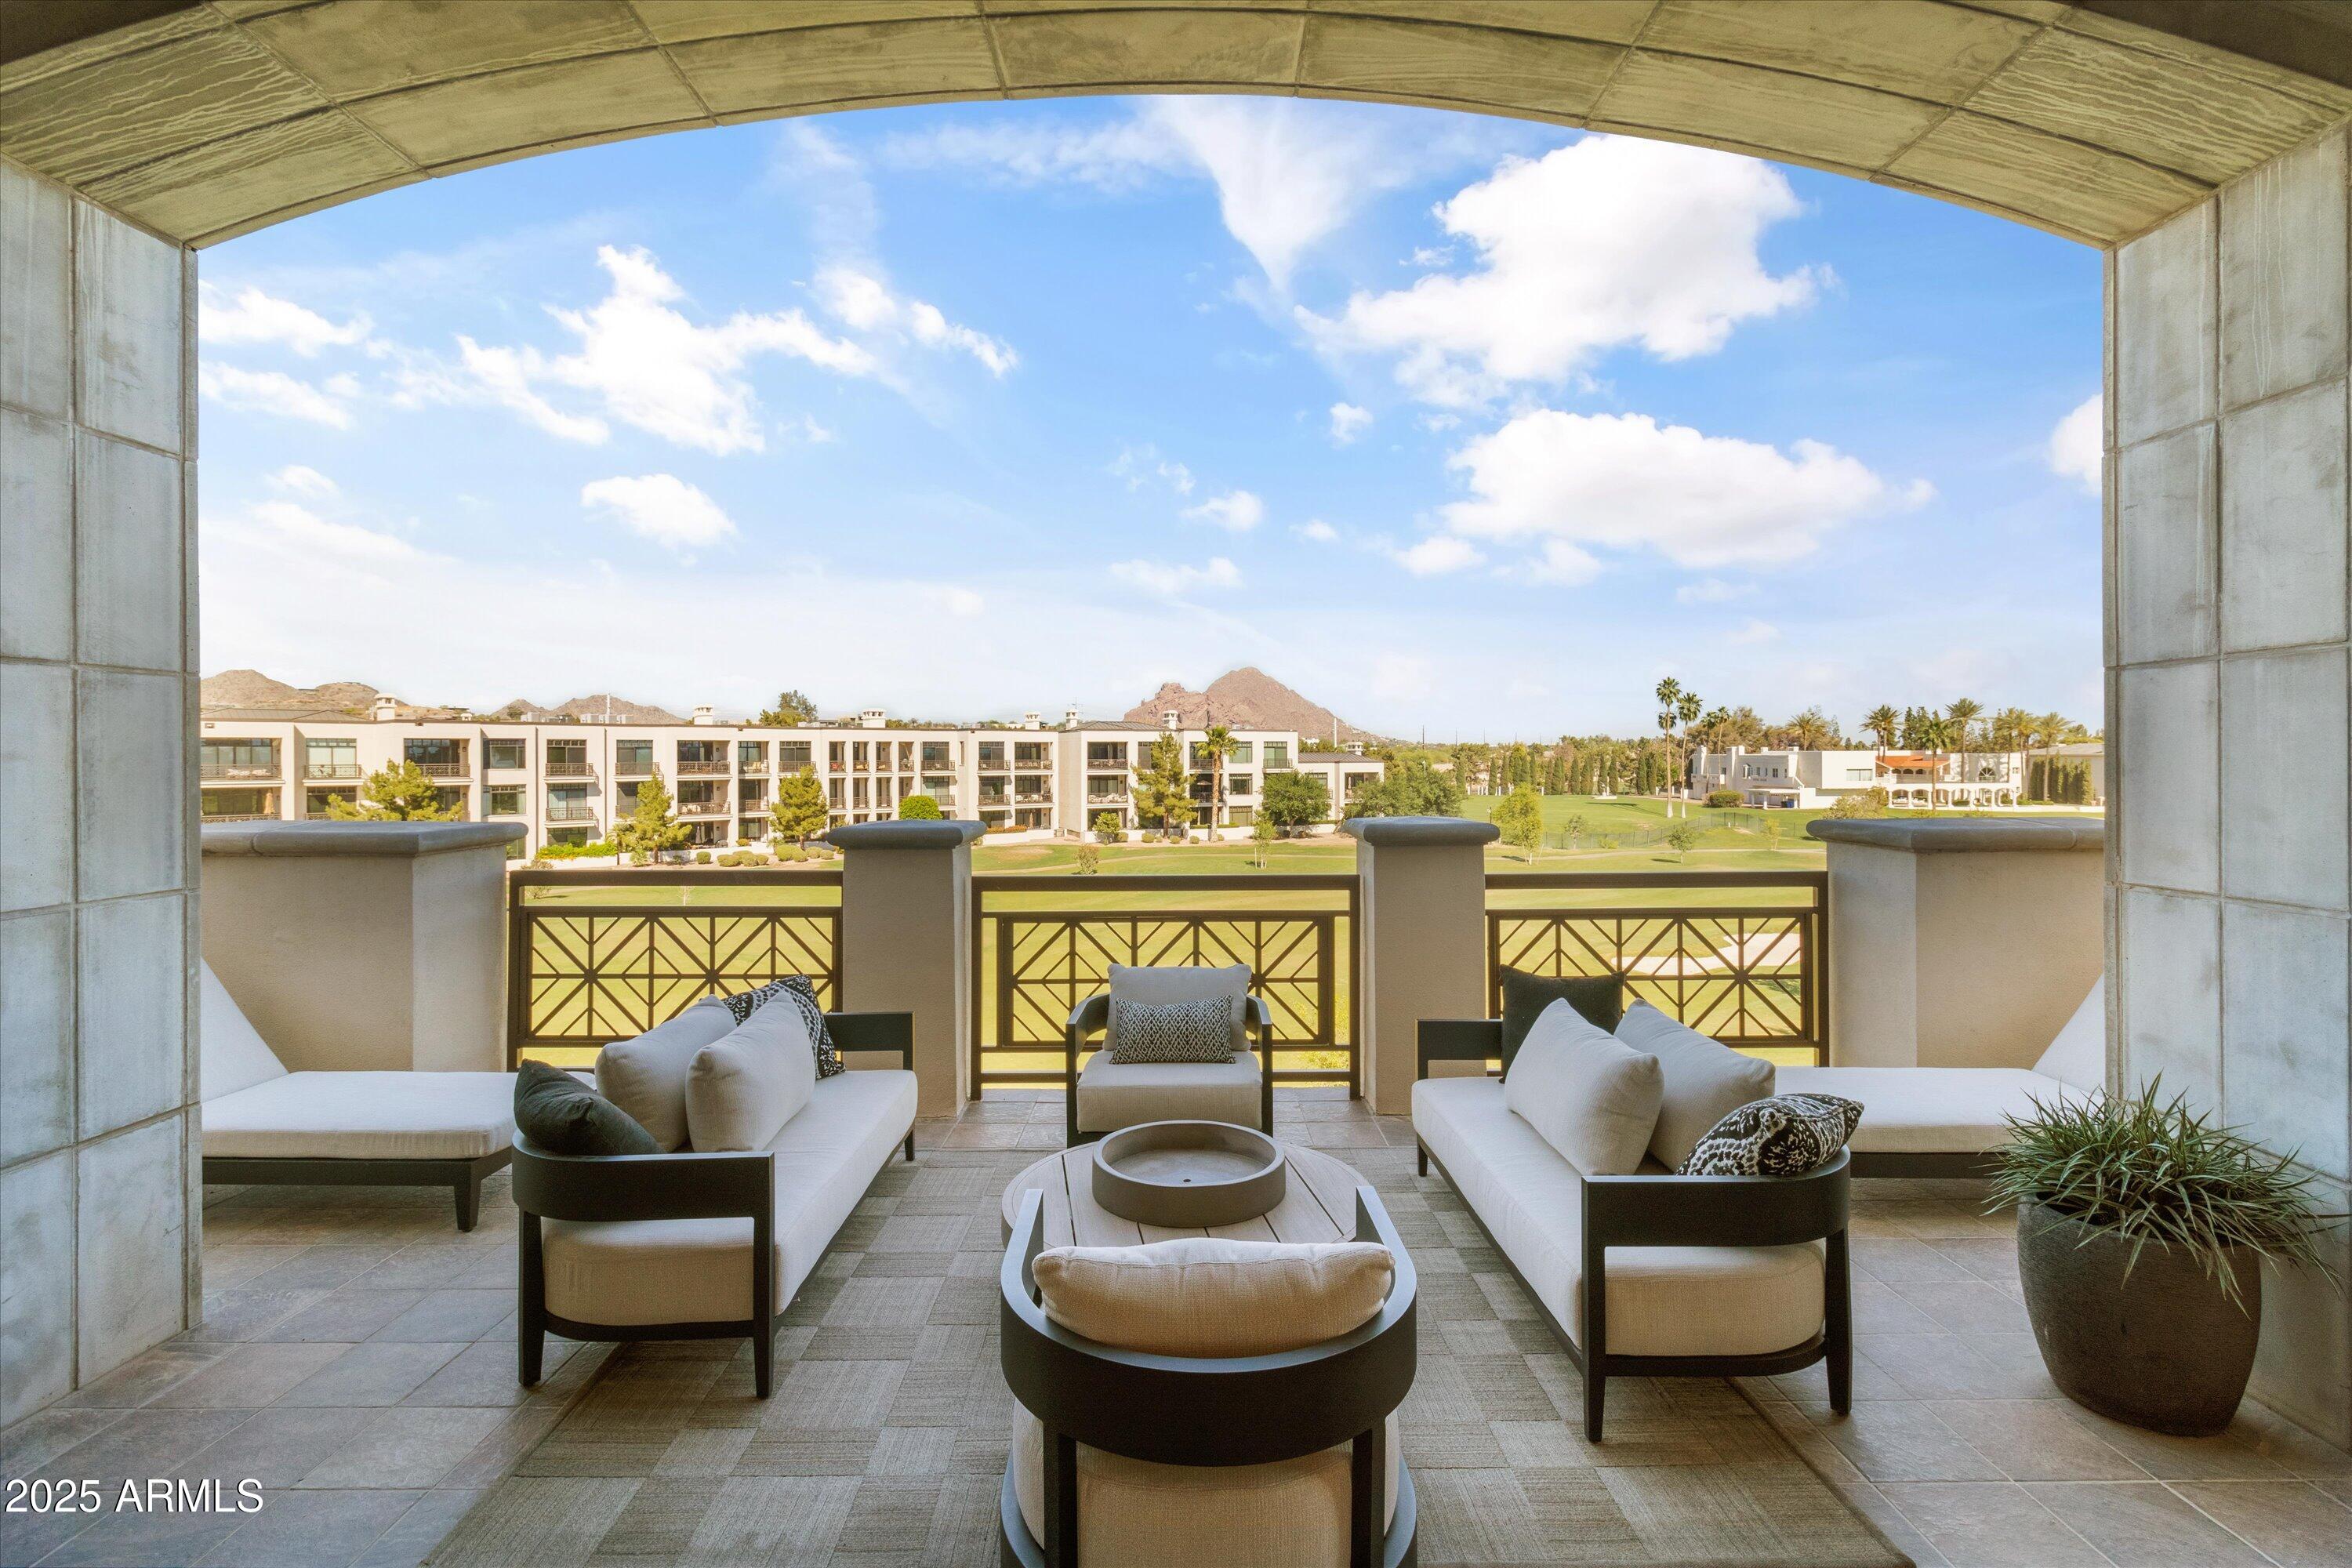
Active
$5,500,000
4
bds
|
4
ba
|
4,817
sqft
|
built
2008
2 Biltmore Est, Phoenix, AZ 85016
$-23,971
Cash flow
-22.7%
Cash-on-Cash Return
0.4%
Cap rate
0.2%
Rent to Value Ratio

Active
$535,000
4
bds
|
3
ba
|
1,814
sqft
|
built
1999
4041 W Hackamore Dr, Phoenix, AZ 85083
$-998
Cash flow
-9.7%
Cash-on-Cash Return
3.4%
Cap rate
0.5%
Rent to Value Ratio
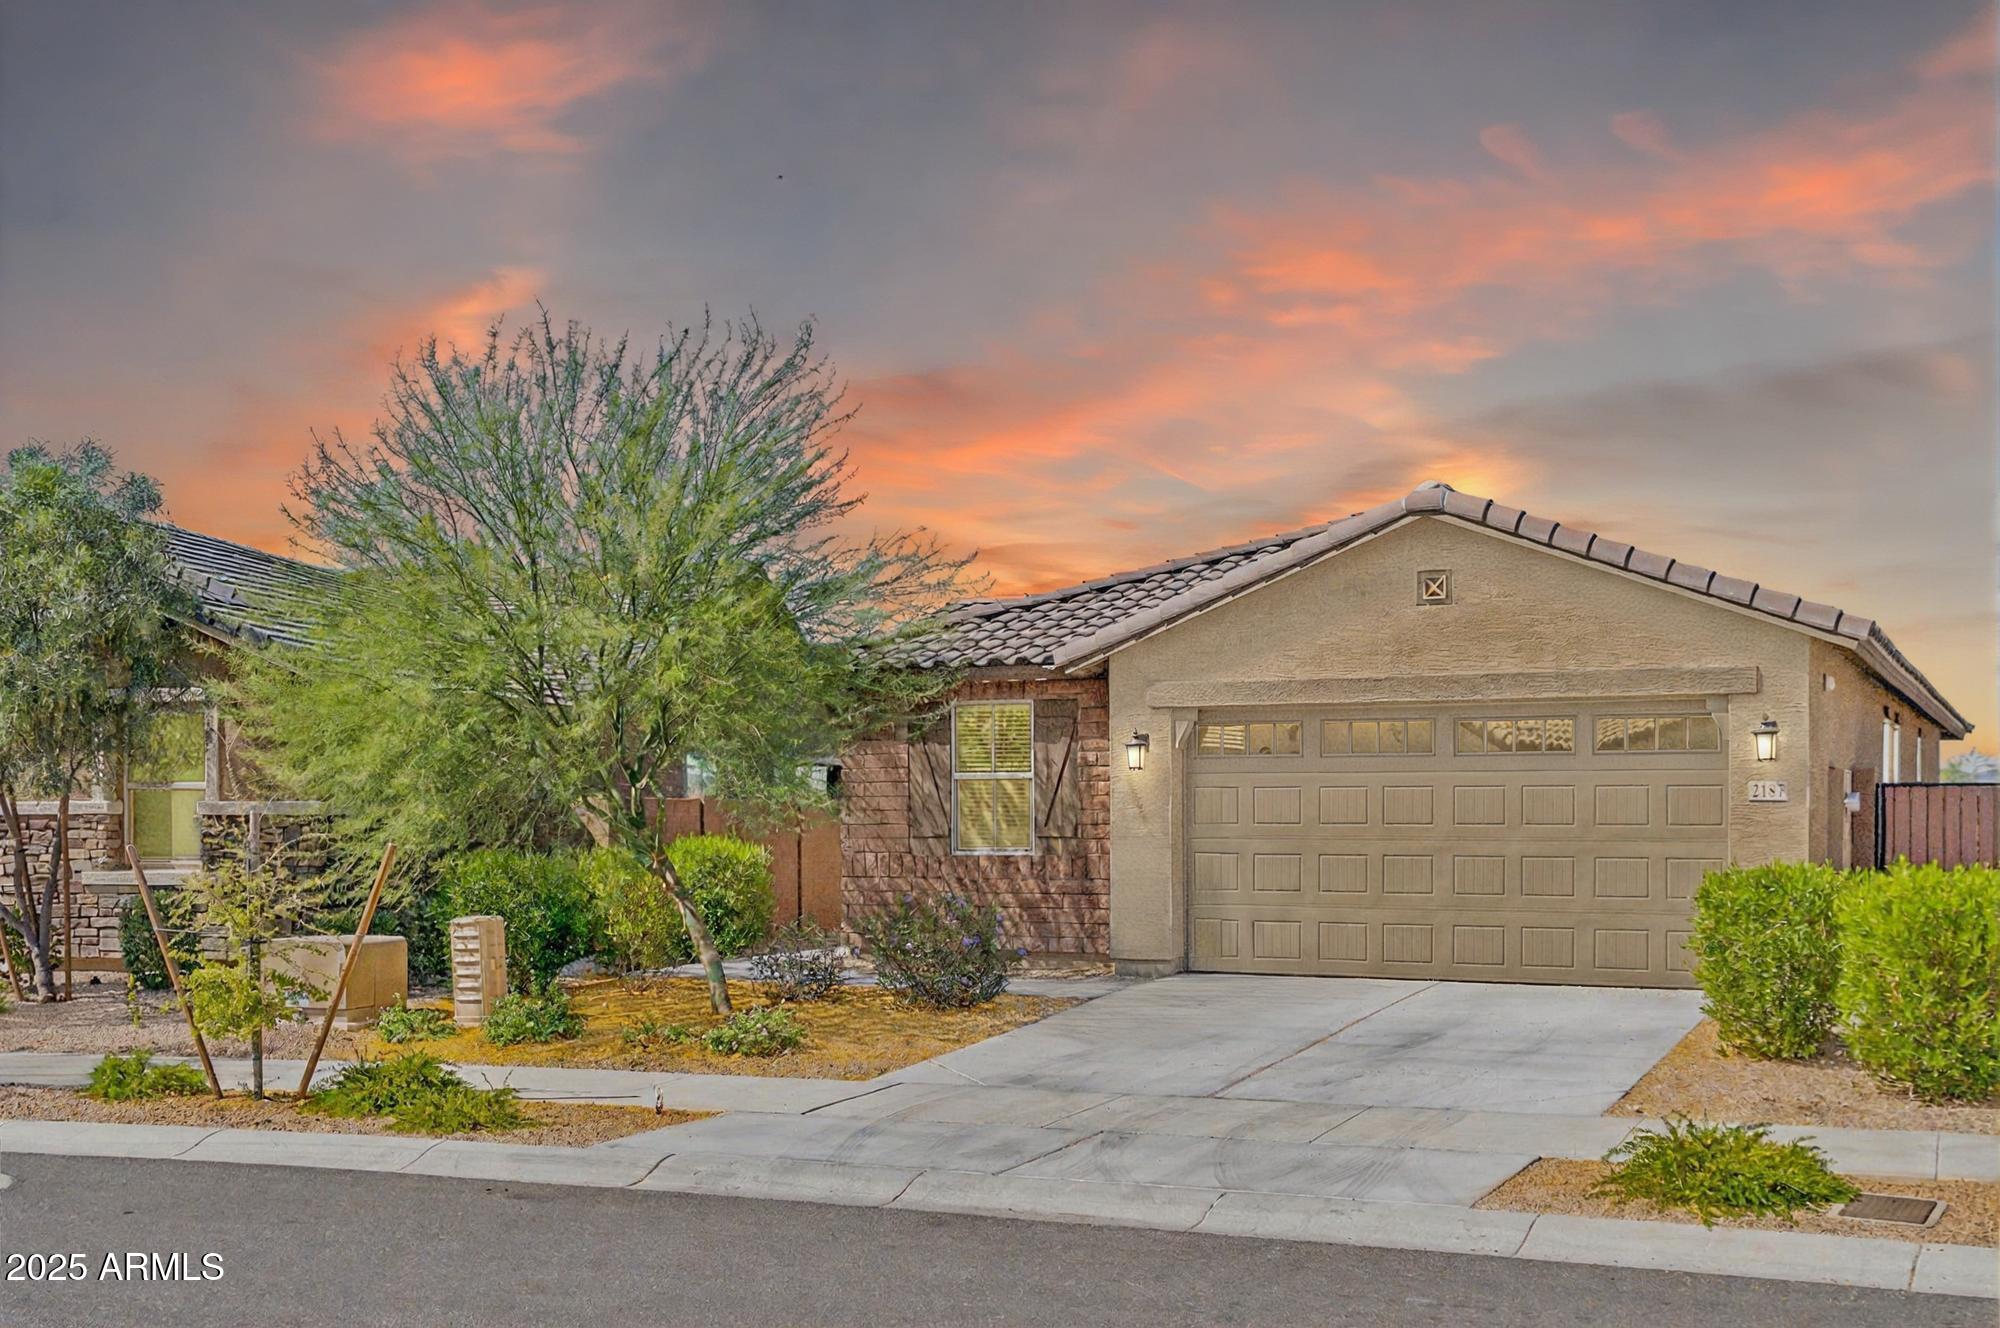
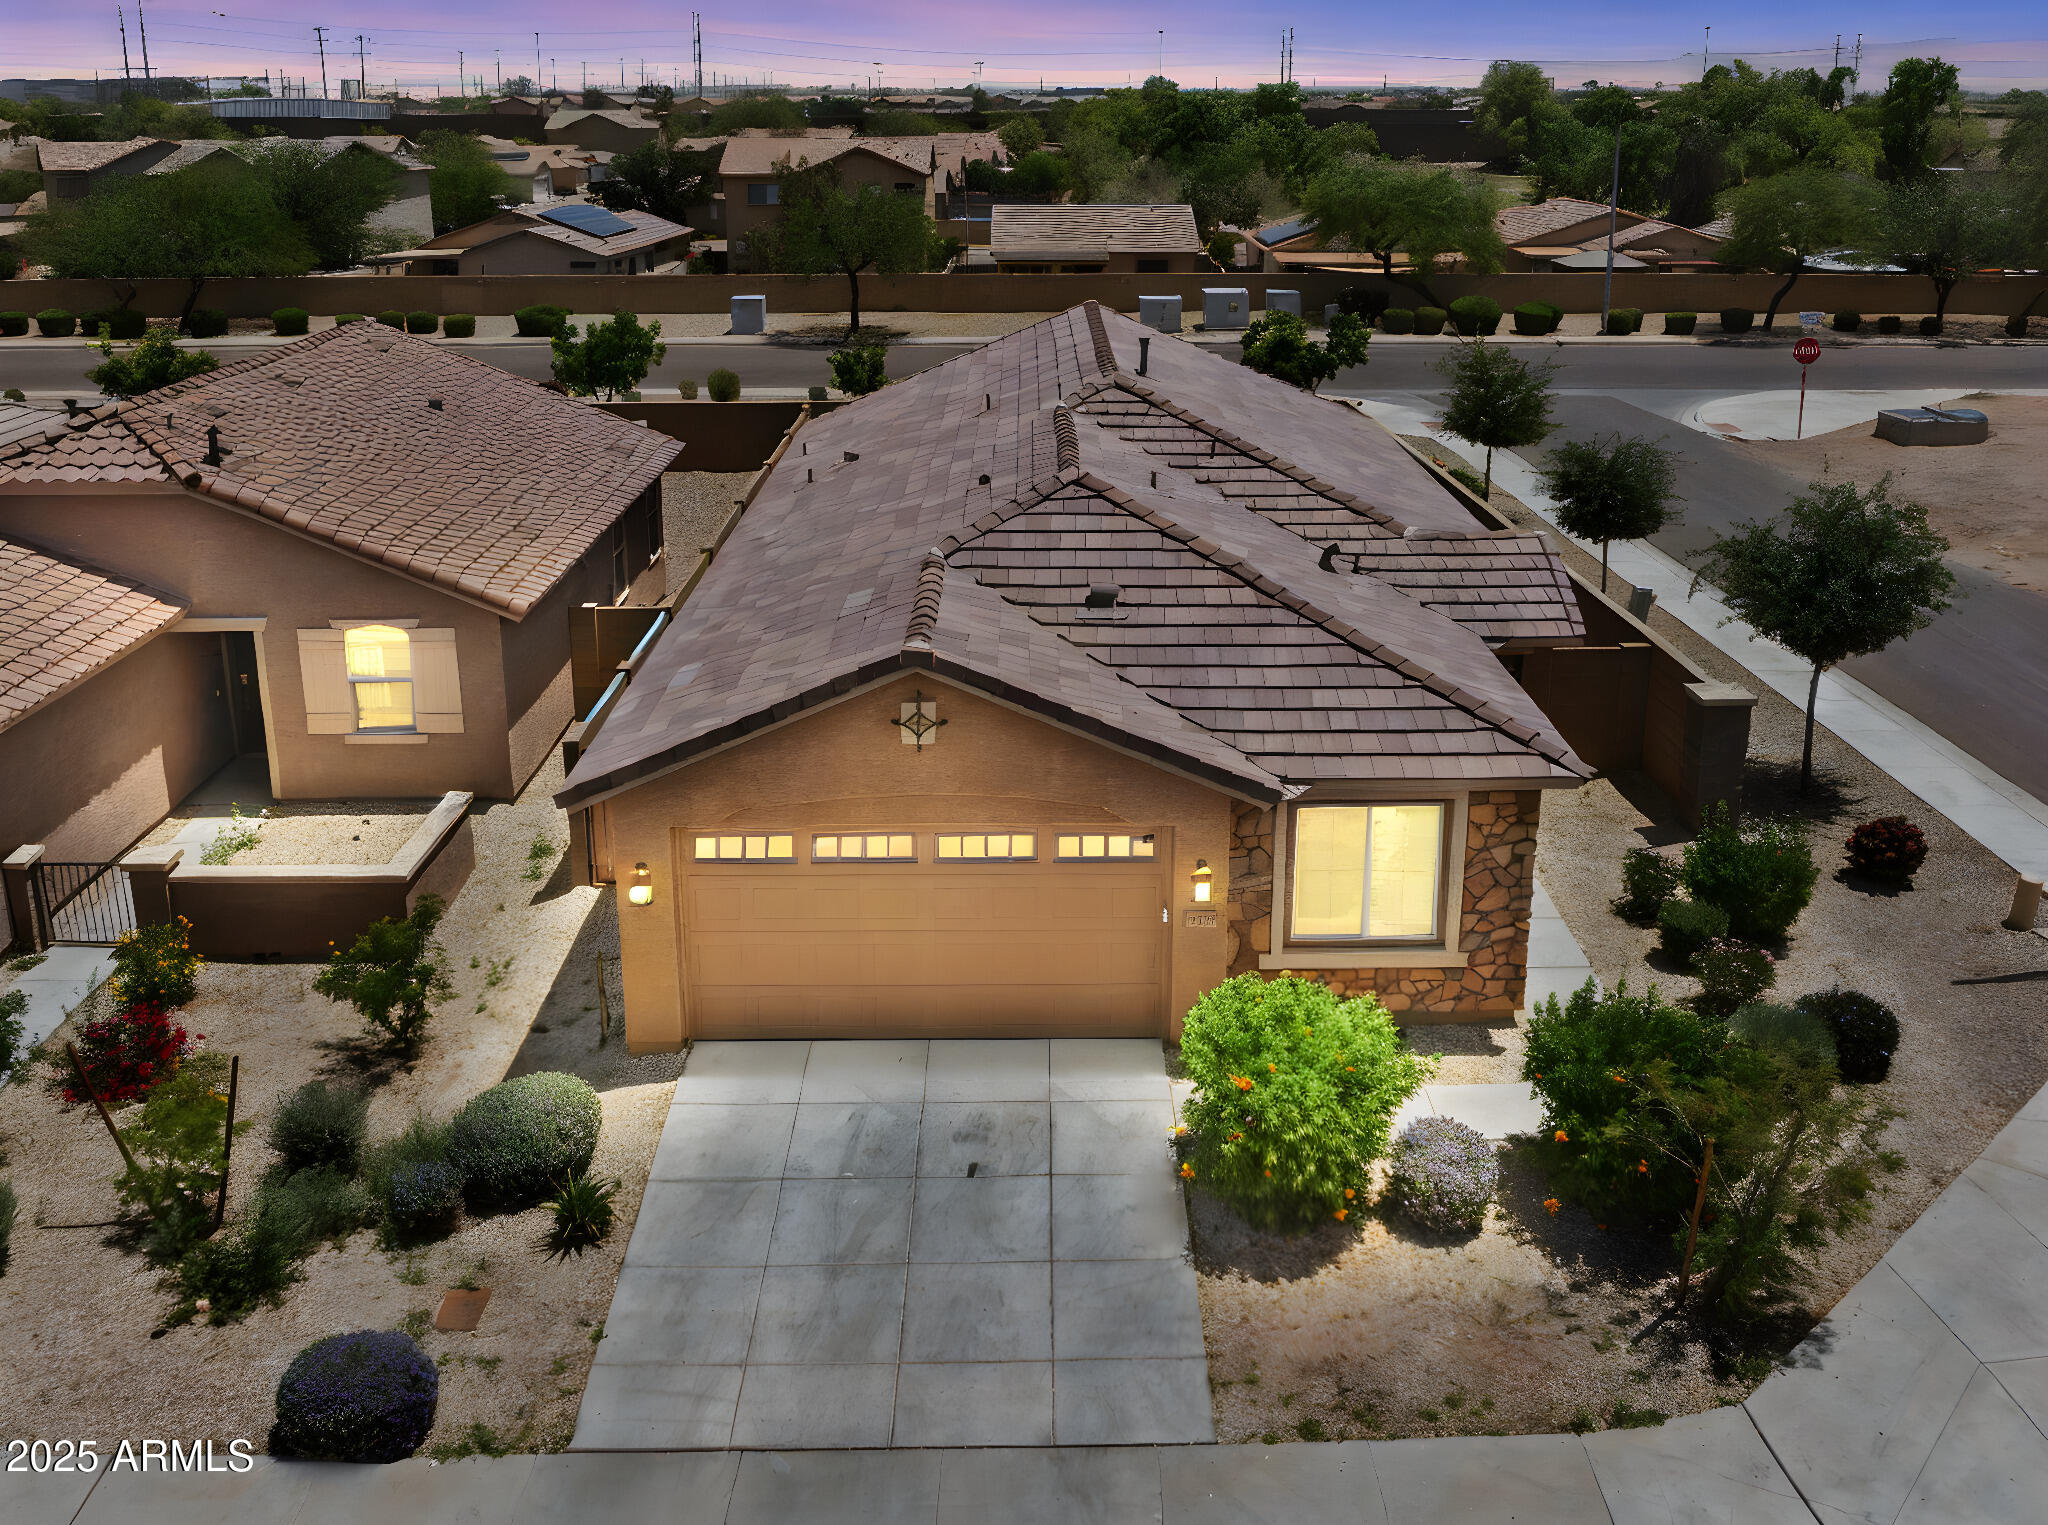
Active
$665,000
4
bds
|
2
ba
|
1,797
sqft
|
built
2023
2187 W Burnside Trl, Phoenix, AZ 85085
$-1,695
Cash flow
-13.3%
Cash-on-Cash Return
2.6%
Cap rate
0.4%
Rent to Value Ratio

Active
$245,000
2
bds
|
2
ba
|
1,108
sqft
|
built
1985
15801 N 29th St, Phoenix, AZ 85032
$-358
Cash flow
-7.6%
Cash-on-Cash Return
3.9%
Cap rate
0.7%
Rent to Value Ratio
Active
$329,900
3
bds
|
3
ba
|
1,408
sqft
|
built
1966
1301 N 44th St, Phoenix, AZ 85008
$-668
Cash flow
-10.6%
Cash-on-Cash Return
3.2%
Cap rate
0.5%
Rent to Value Ratio
Active
$420,000
3
bds
|
3
ba
|
1,618
sqft
|
built
2014
3113 E Danbury Rd, Phoenix, AZ 85032
$-783
Cash flow
-9.7%
Cash-on-Cash Return
3.4%
Cap rate
0.5%
Rent to Value Ratio
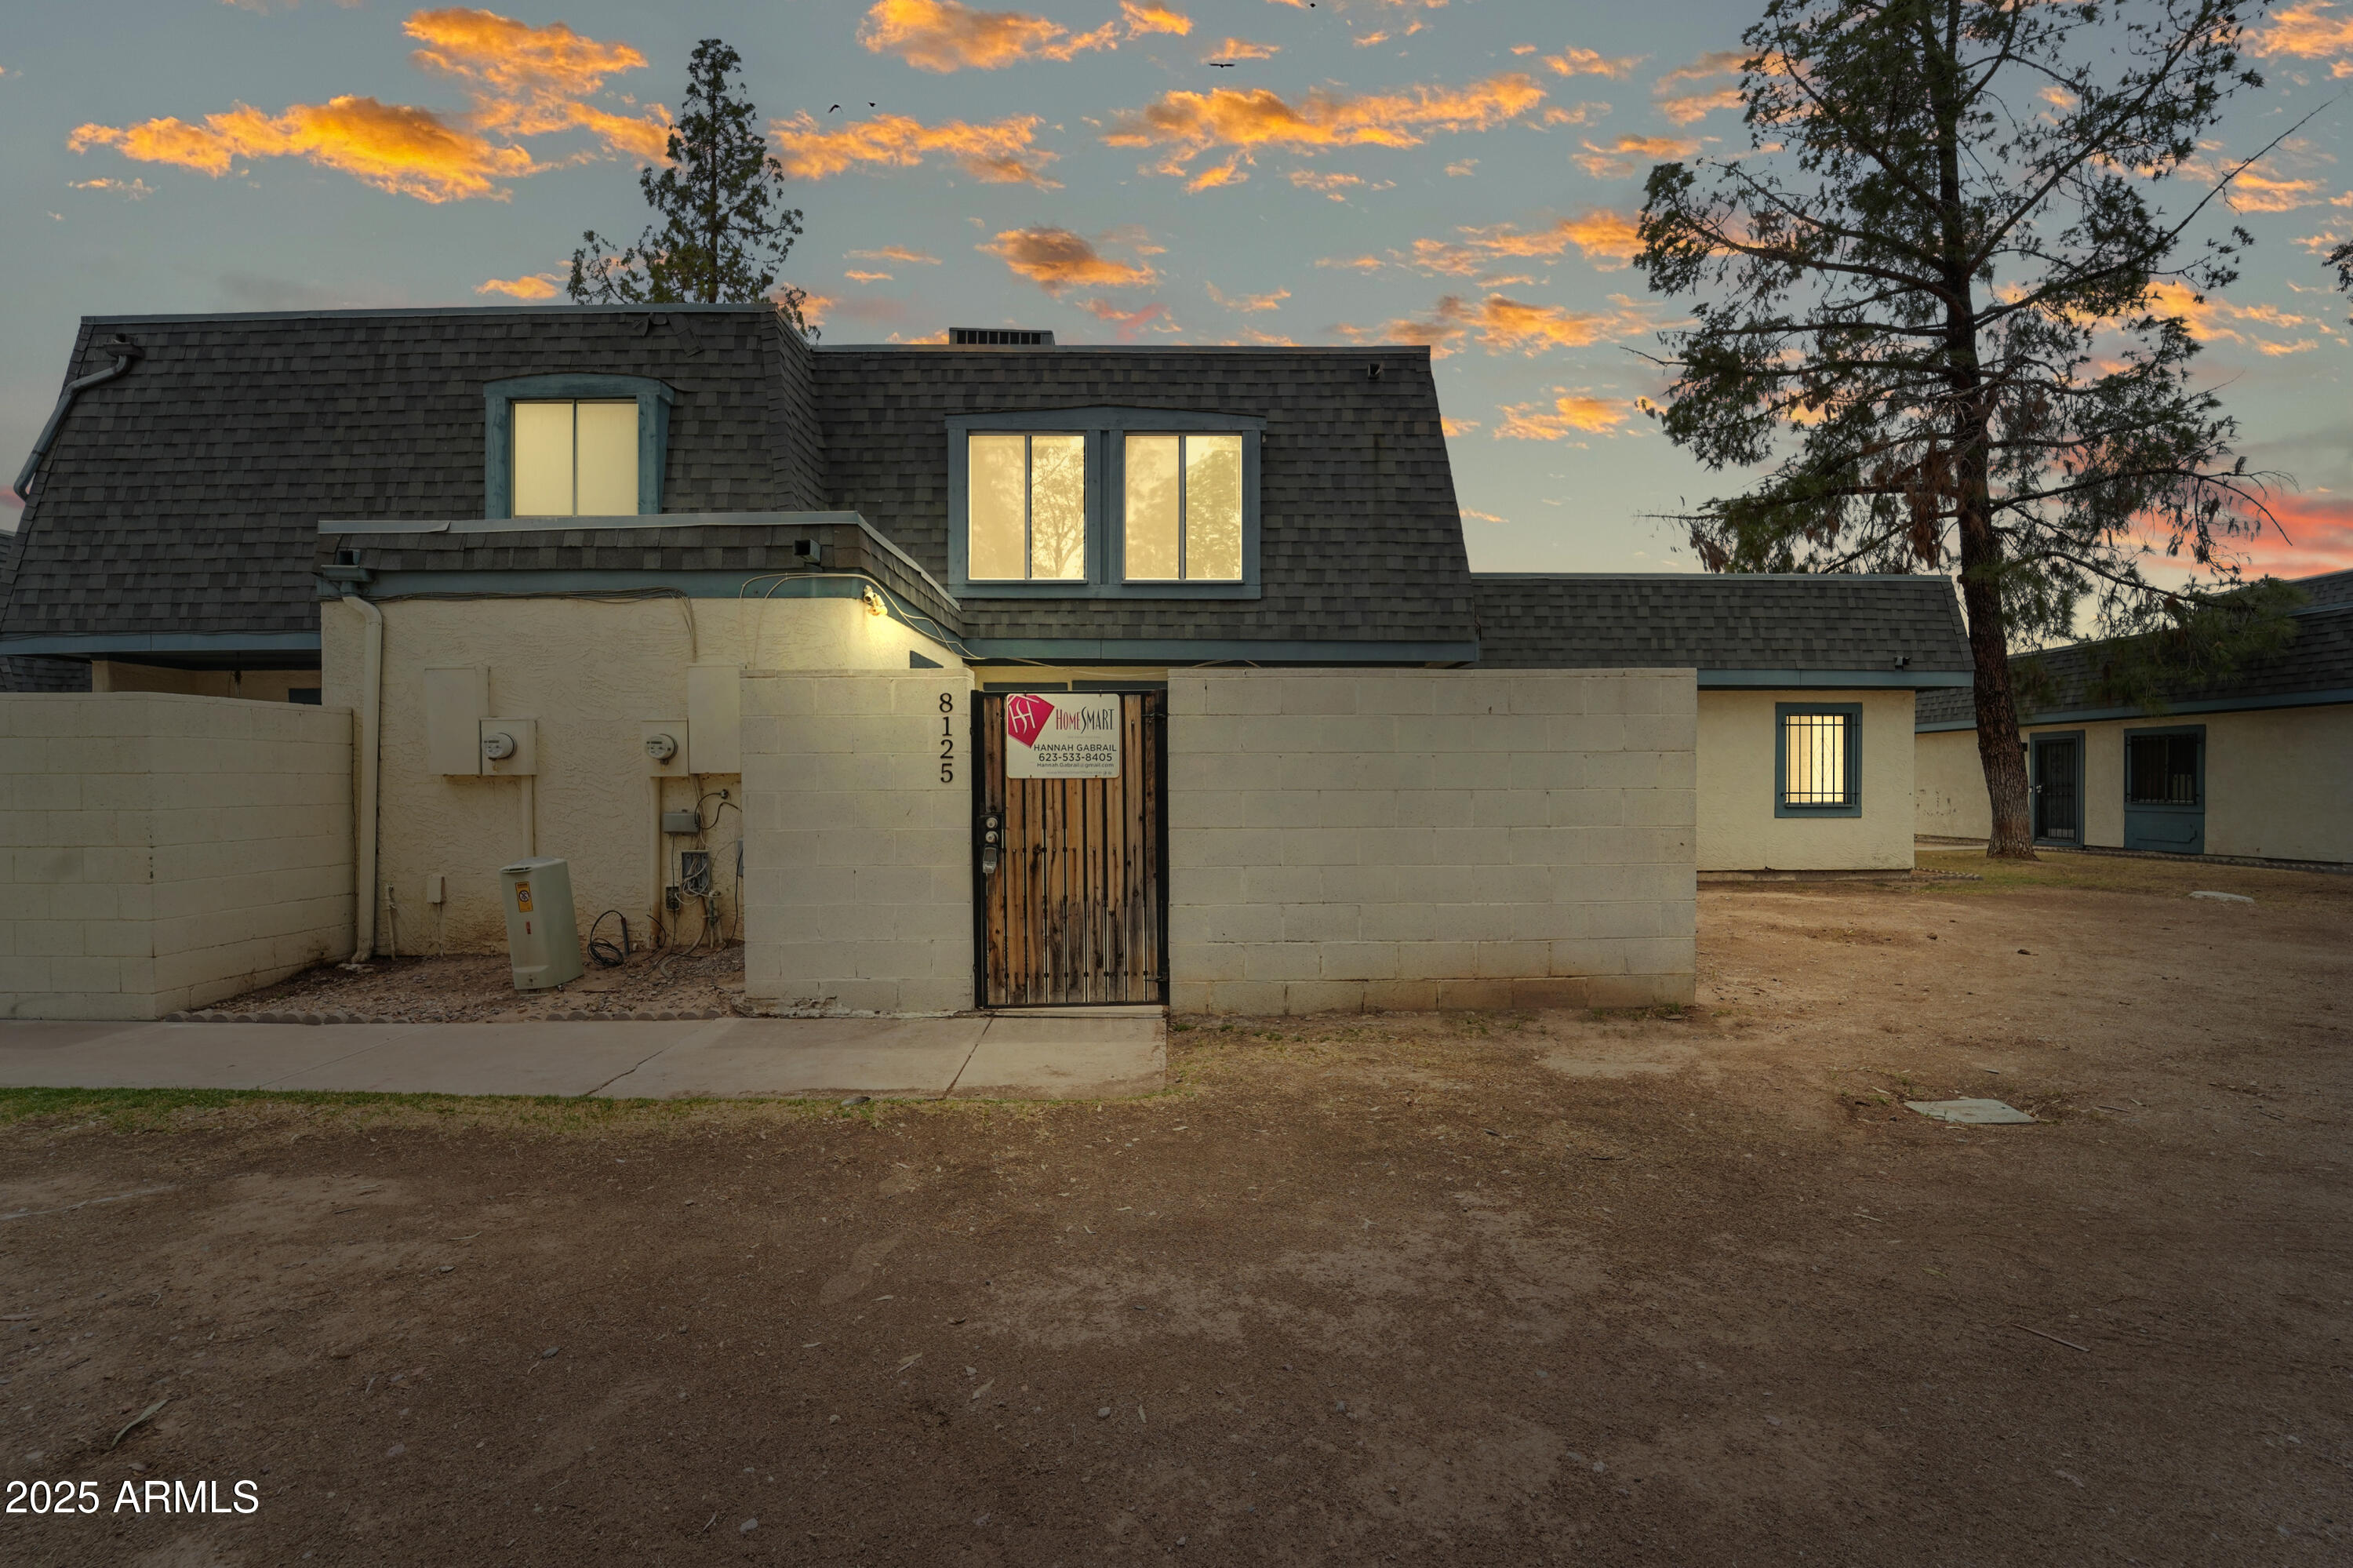
Active
$219,000
2
bds
|
1
ba
|
924
sqft
|
built
1980
8125 N 32nd Dr, Phoenix, AZ 85051
$-426
Cash flow
-10.1%
Cash-on-Cash Return
3.3%
Cap rate
0.6%
Rent to Value Ratio

Active
$599,000
3
bds
|
2
ba
|
1,644
sqft
|
built
1971
2926 E Corrine Dr, Phoenix, AZ 85032
$-1,447
Cash flow
-12.6%
Cash-on-Cash Return
2.8%
Cap rate
0.4%
Rent to Value Ratio
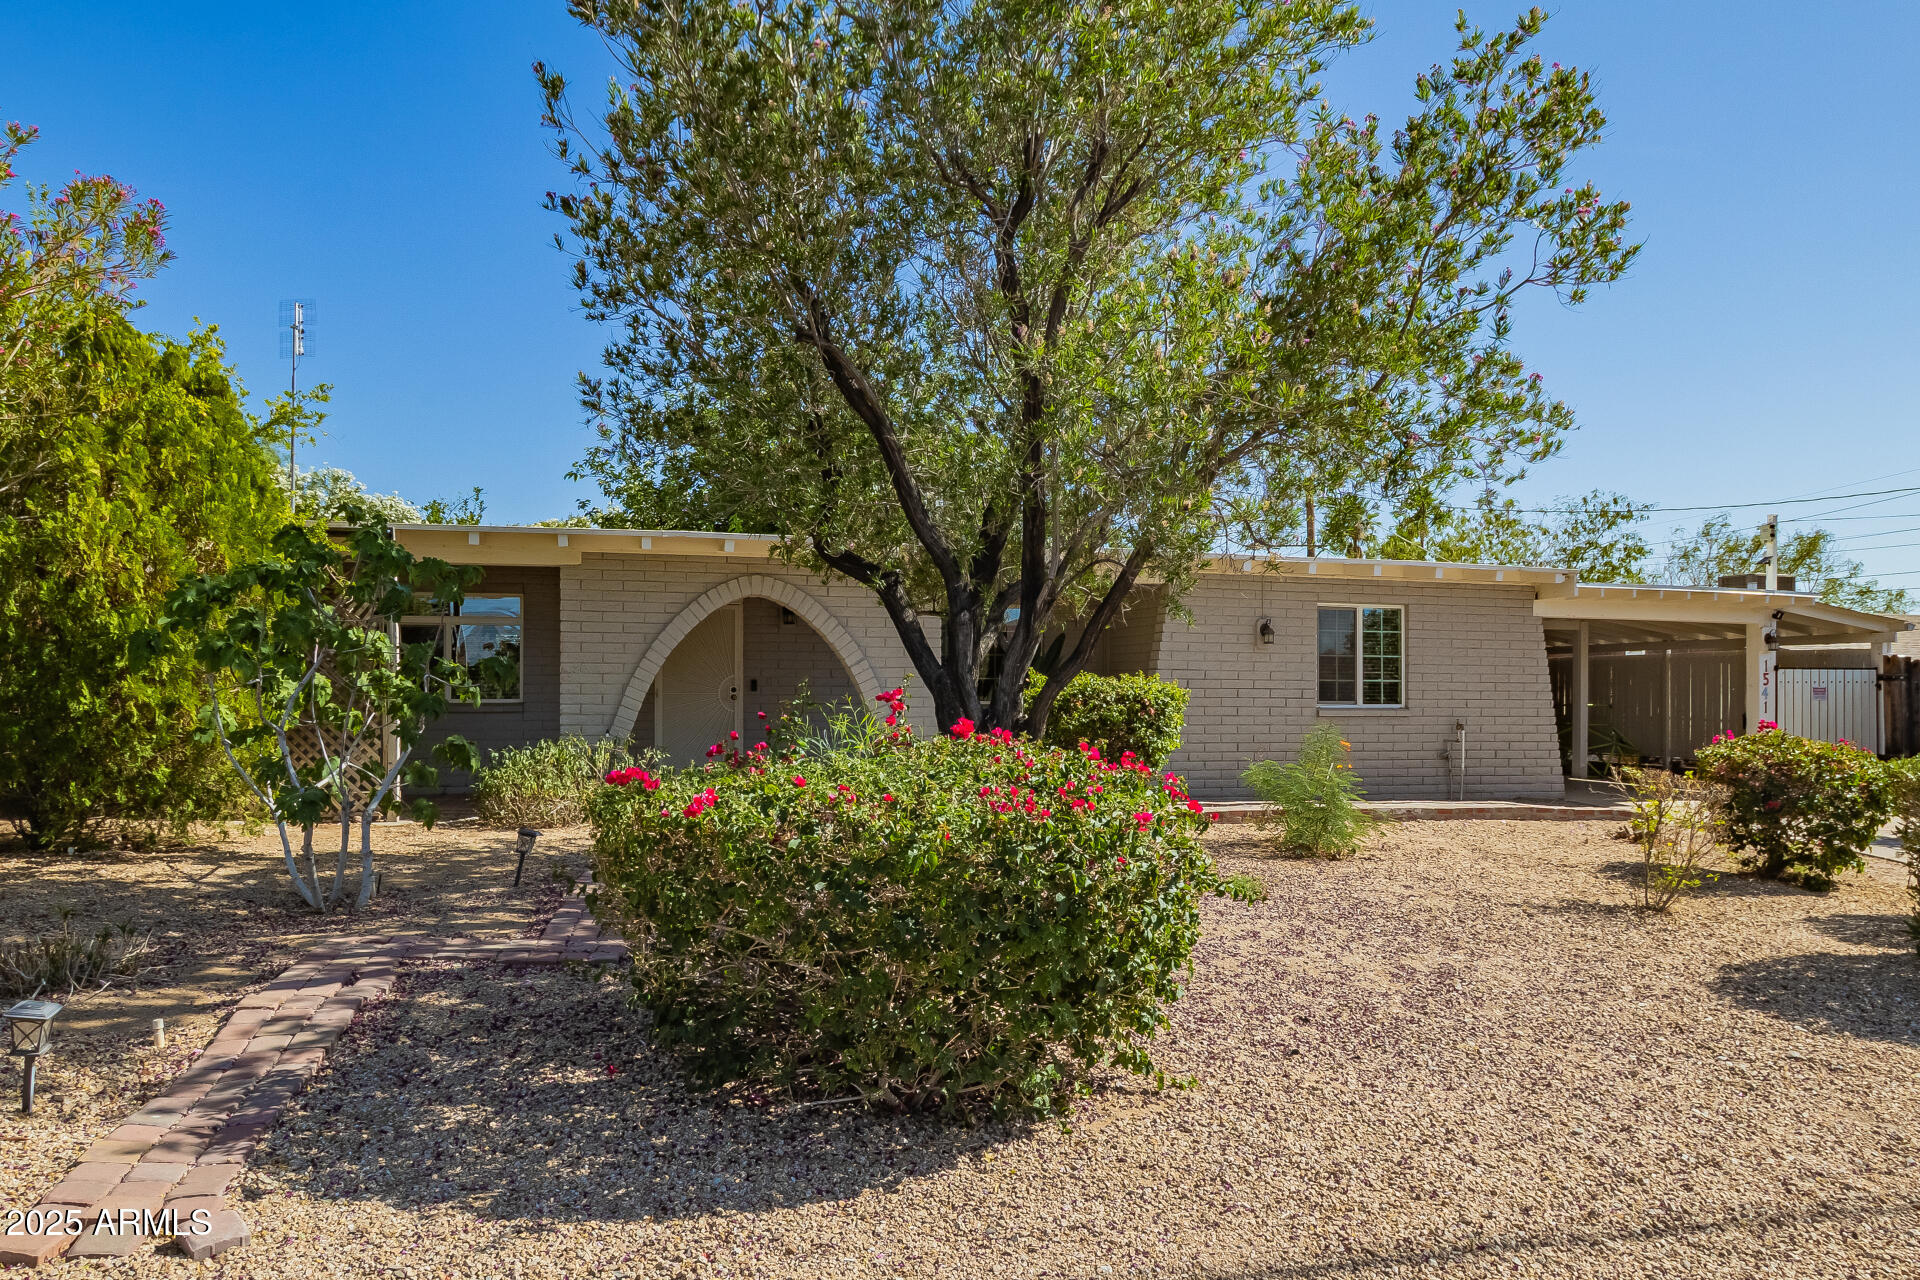
Active
$350,000
2
bds
|
1
ba
|
1,044
sqft
|
built
1972
1541 E Cinnabar Ave, Phoenix, AZ 85020
$-330
Cash flow
-4.9%
Cash-on-Cash Return
4.5%
Cap rate
0.6%
Rent to Value Ratio

Active
$849,000
3
bds
|
2
ba
|
1,569
sqft
|
built
1938
1551 W Vernon Ave, Phoenix, AZ 85007
$-2,573
Cash flow
-15.8%
Cash-on-Cash Return
2.0%
Cap rate
0.3%
Rent to Value Ratio

Active
$900,000
2
bds
|
0
ba
|
0
sqft
|
built
1915
905 E Coronado Rd, Phoenix, AZ 85006
$-2,541
Cash flow
-14.7%
Cash-on-Cash Return
2.3%
Cap rate
0.3%
Rent to Value Ratio

Active
$1,499,000
3
bds
|
3
ba
|
2,973
sqft
|
built
1959
7802 N 6th St, Phoenix, AZ 85020
$-4,819
Cash flow
-16.8%
Cash-on-Cash Return
1.8%
Cap rate
0.3%
Rent to Value Ratio
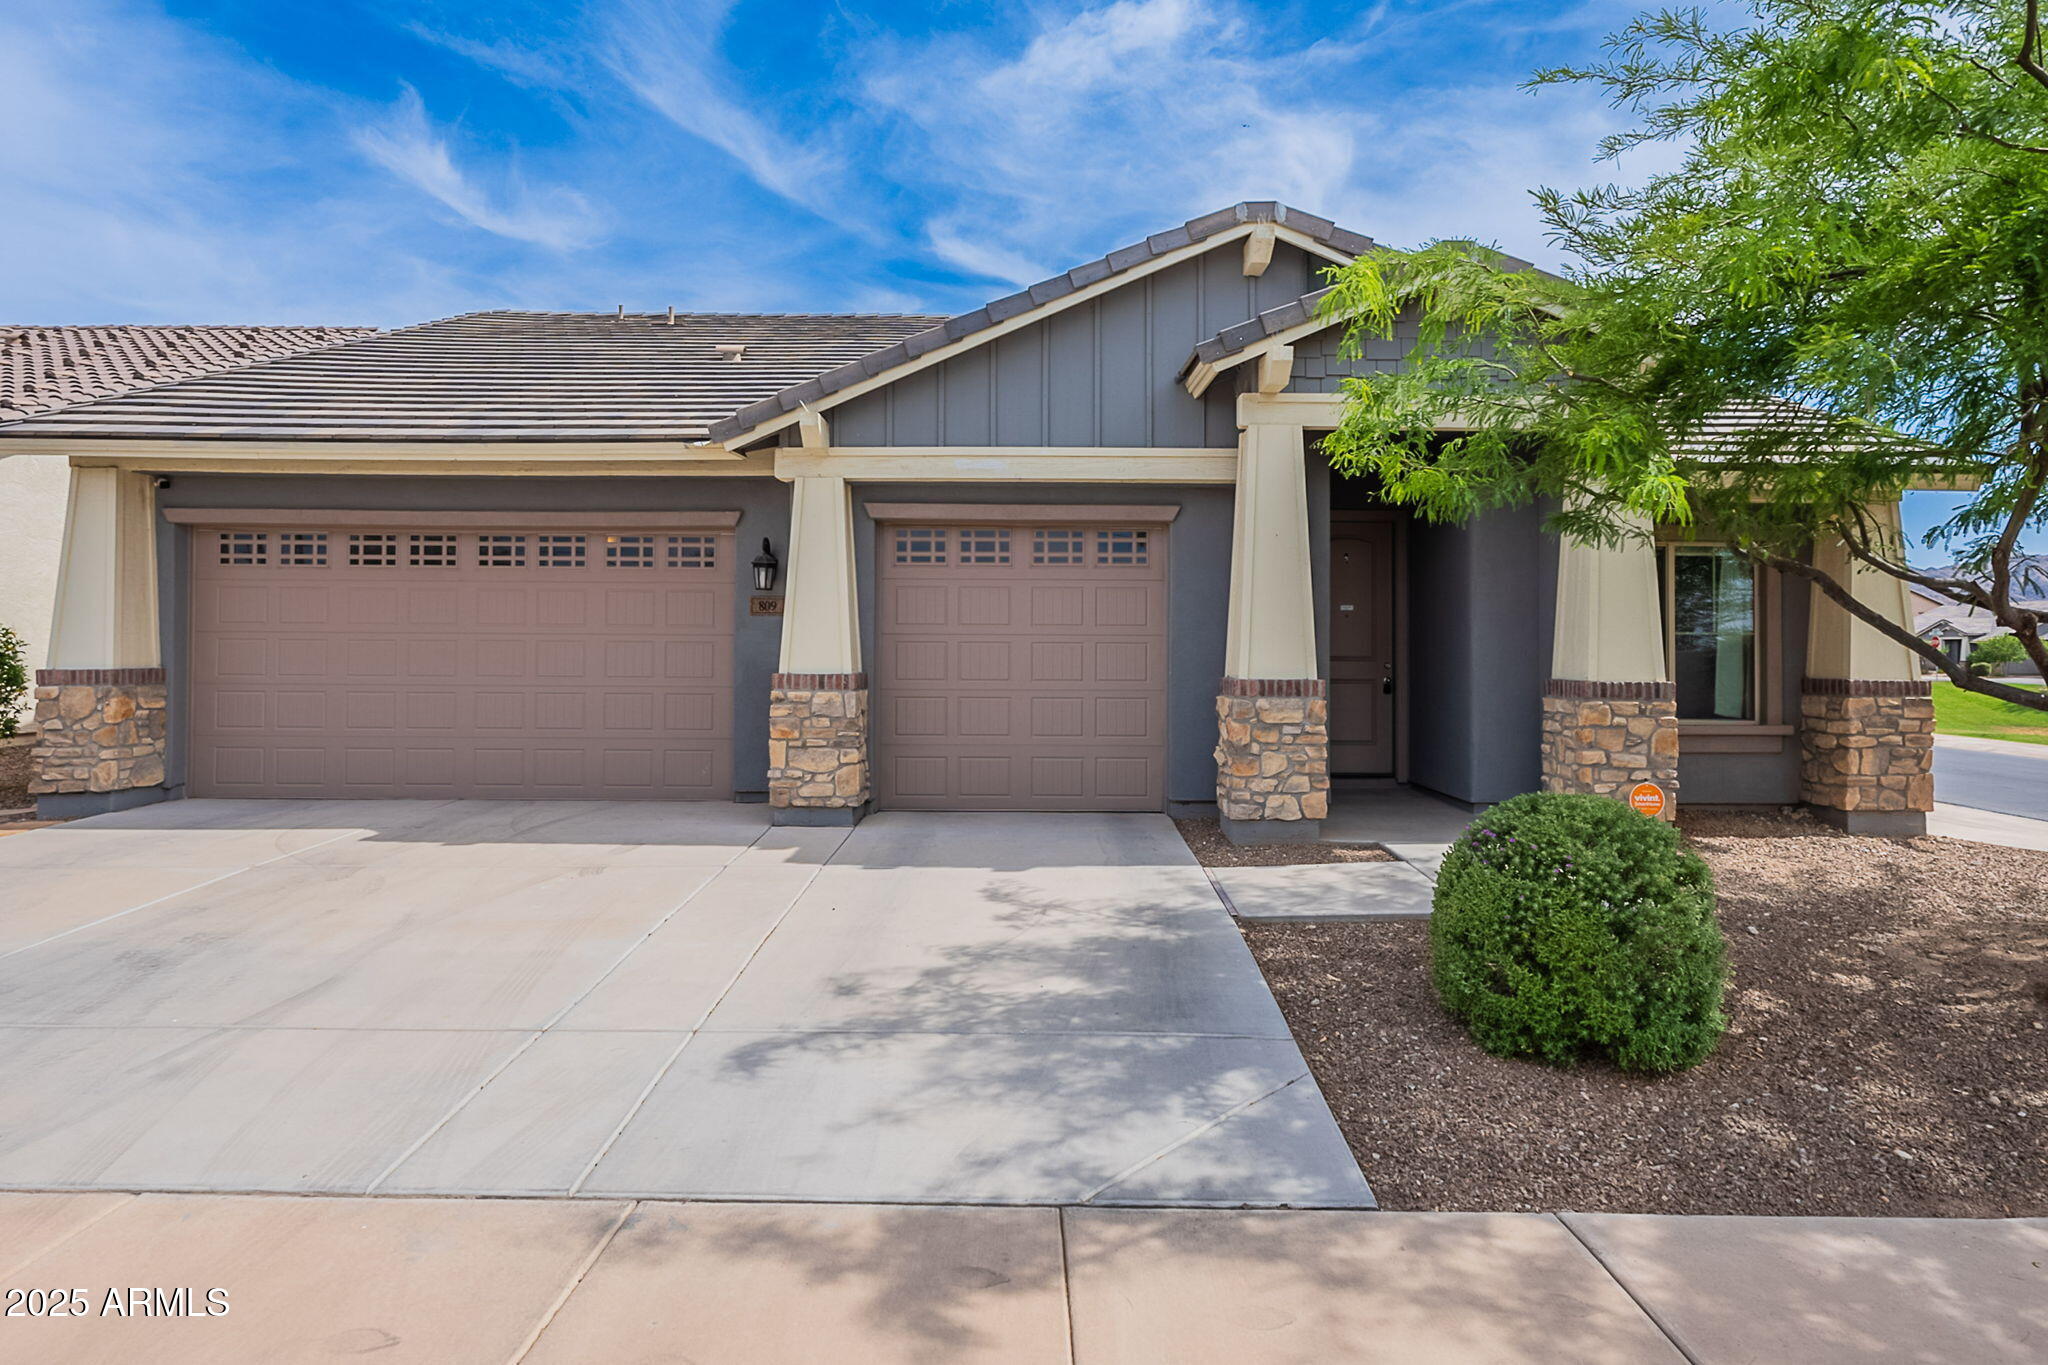
Active
$450,000
3
bds
|
2
ba
|
1,698
sqft
|
built
2017
809 W Coles Rd, Phoenix, AZ 85041
$-594
Cash flow
-6.9%
Cash-on-Cash Return
4.1%
Cap rate
0.6%
Rent to Value Ratio
Active
$249,900
3
bds
|
3
ba
|
1,184
sqft
|
built
1985
19601 N 7th St, Phoenix, AZ 85024
$-291
Cash flow
-6.1%
Cash-on-Cash Return
4.3%
Cap rate
0.7%
Rent to Value Ratio
Active
$449,950
4
bds
|
2
ba
|
1,794
sqft
|
built
2022
3847 S 63rd Dr, Phoenix, AZ 85043
$-880
Cash flow
-10.2%
Cash-on-Cash Return
3.3%
Cap rate
0.5%
Rent to Value Ratio
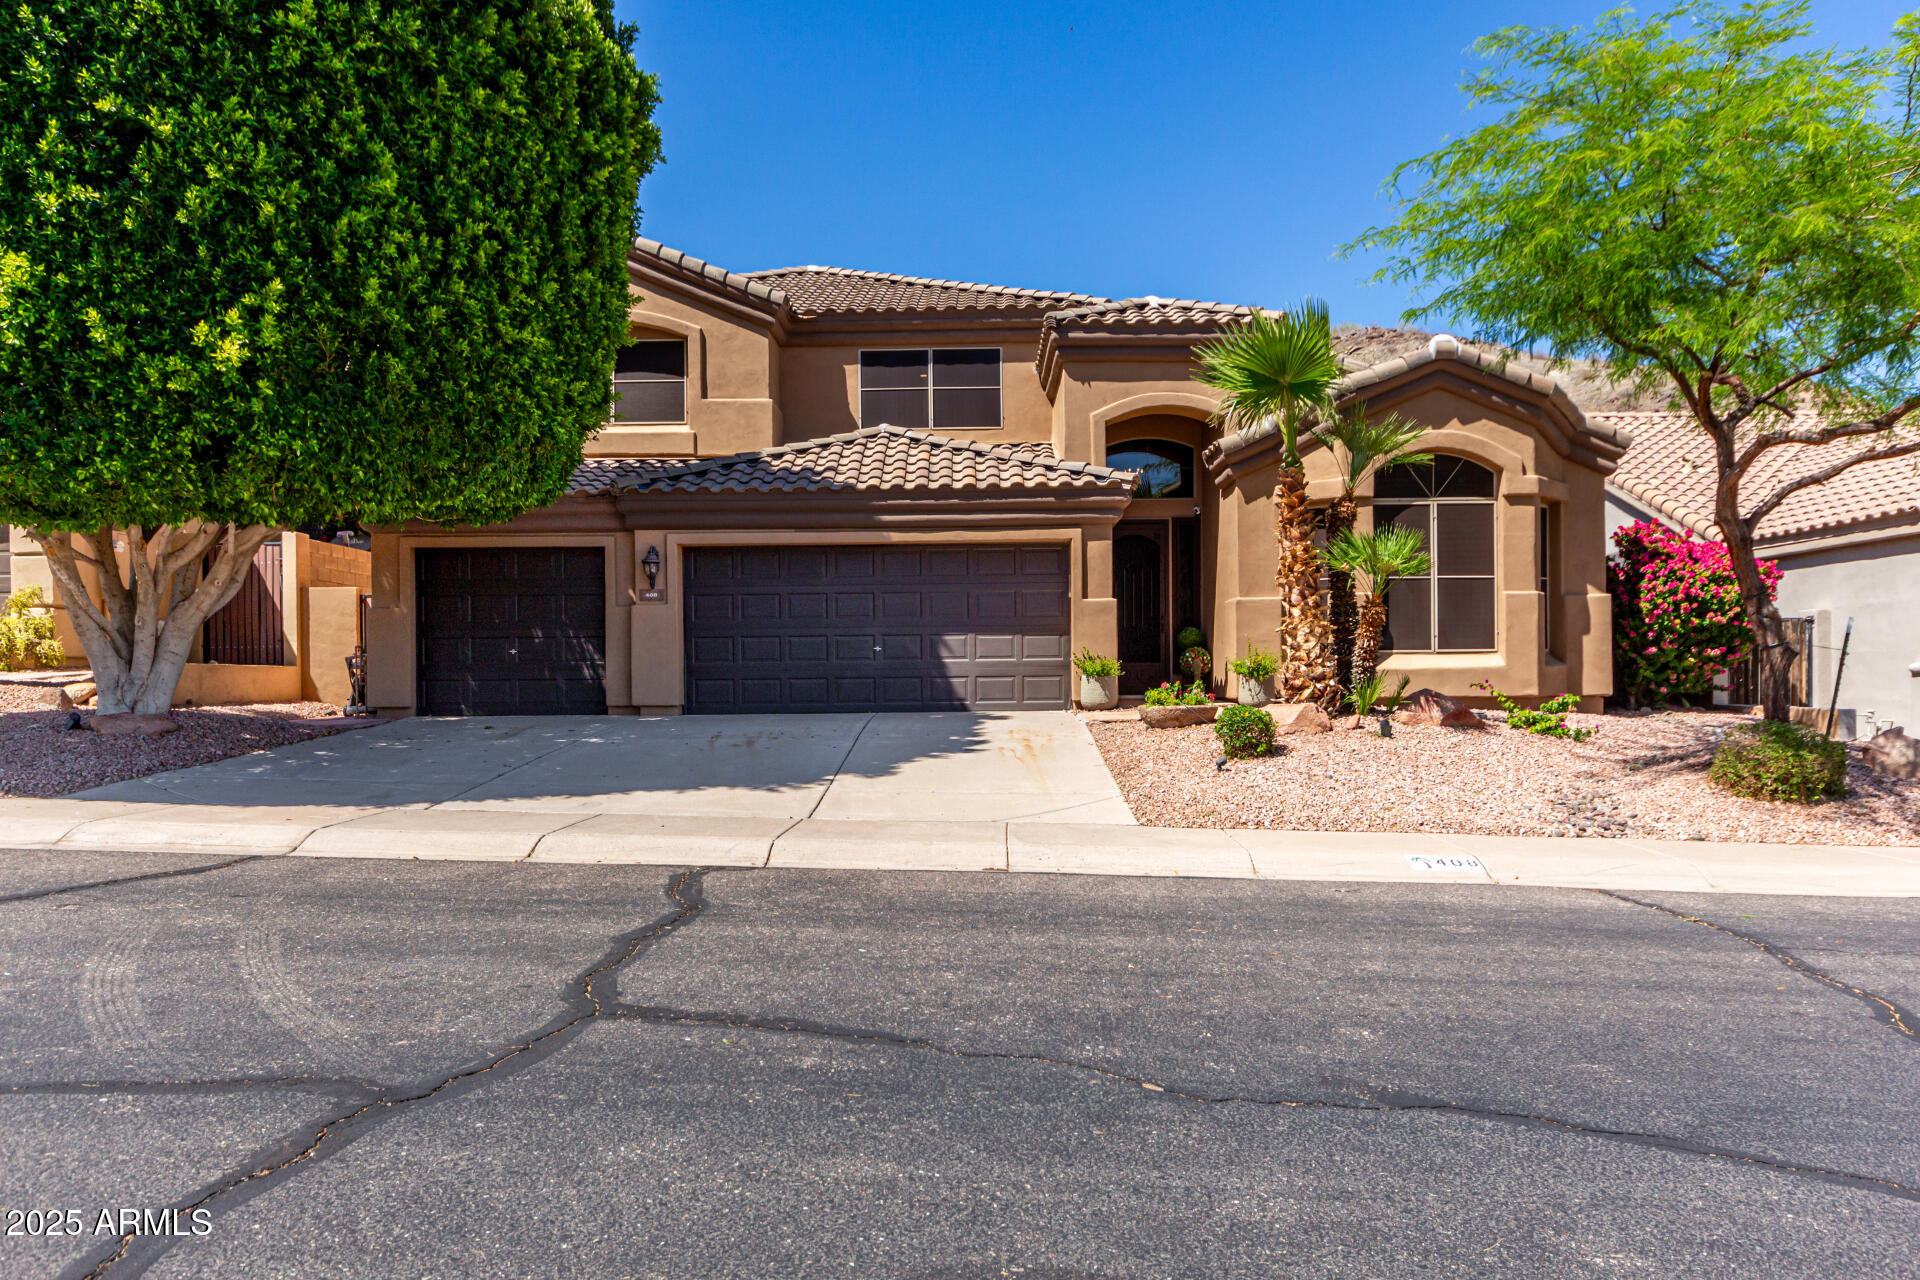
Active
$775,000
4
bds
|
3
ba
|
3,111
sqft
|
built
1997
408 E Silverwood Dr, Phoenix, AZ 85048
$-1,365
Cash flow
-9.2%
Cash-on-Cash Return
3.6%
Cap rate
0.5%
Rent to Value Ratio

Active
$1,628,000
4
bds
|
4
ba
|
2,552
sqft
|
built
2018
4132 N 42nd St, Phoenix, AZ 85018
$-4,657
Cash flow
-14.9%
Cash-on-Cash Return
2.2%
Cap rate
0.3%
Rent to Value Ratio

Active
$470,000
4
bds
|
2
ba
|
2,143
sqft
|
built
1960
3208 W Bloomfield Rd, Phoenix, AZ 85029
$-538
Cash flow
-6.0%
Cash-on-Cash Return
4.3%
Cap rate
0.6%
Rent to Value Ratio

Active
$375,000
3
bds
|
3
ba
|
1,605
sqft
|
built
2021
5741 W Warner St, Phoenix, AZ 85043
$-688
Cash flow
-9.6%
Cash-on-Cash Return
3.5%
Cap rate
0.5%
Rent to Value Ratio

Active
$830,000
5
bds
|
3
ba
|
3,076
sqft
|
built
1993
3132 E Wildwood Dr, Phoenix, AZ 85048
$-1,790
Cash flow
-11.3%
Cash-on-Cash Return
3.1%
Cap rate
0.4%
Rent to Value Ratio

Active
$675,000
3
bds
|
2
ba
|
1,563
sqft
|
built
1945
1444 E Coronado Rd, Phoenix, AZ 85006
$-1,380
Cash flow
-10.7%
Cash-on-Cash Return
3.2%
Cap rate
0.4%
Rent to Value Ratio
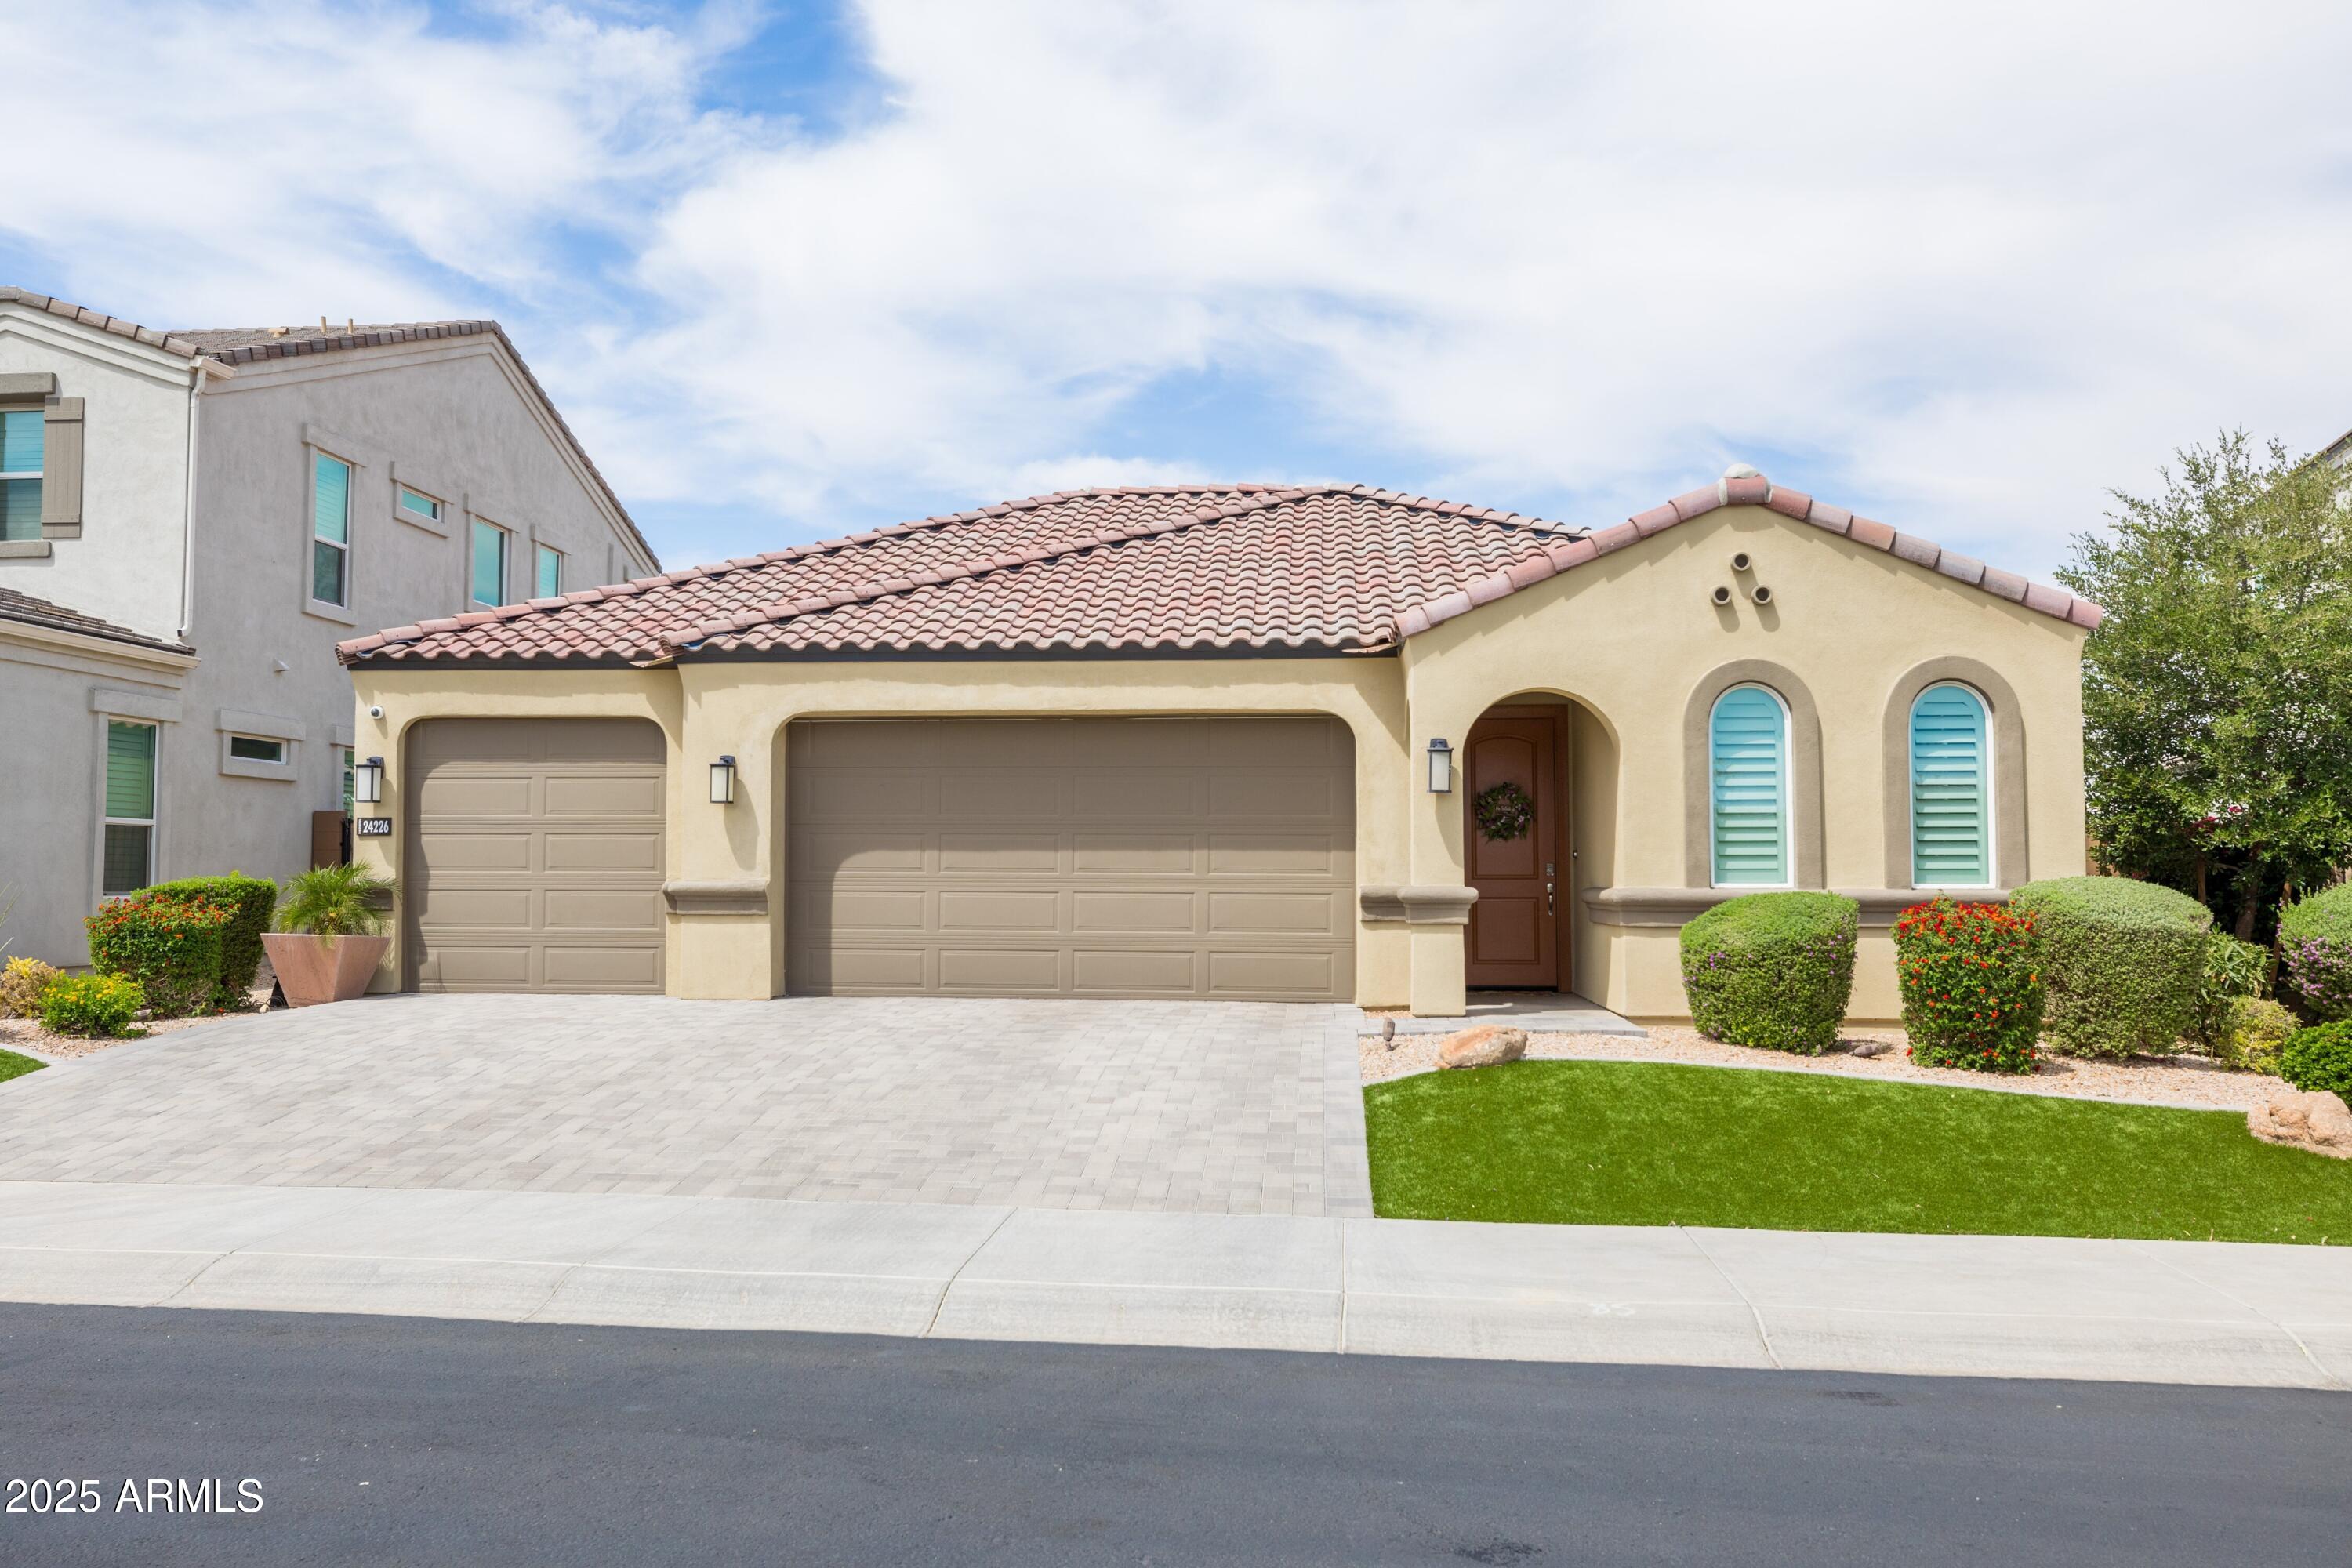
Active
$675,000
3
bds
|
2
ba
|
1,612
sqft
|
built
2019
24226 N 22nd St, Phoenix, AZ 85024
$-765
Cash flow
-5.9%
Cash-on-Cash Return
4.3%
Cap rate
0.6%
Rent to Value Ratio
Active
$369,900
4
bds
|
3
ba
|
2,461
sqft
|
built
2004
9456 W Jamestown Rd, Phoenix, AZ 85037
$-607
Cash flow
-8.6%
Cash-on-Cash Return
3.7%
Cap rate
0.5%
Rent to Value Ratio
Active
$574,900
5
bds
|
3
ba
|
2,065
sqft
|
built
1969
4202 W Purdue Ave, Phoenix, AZ 85051
$-1,046
Cash flow
-9.5%
Cash-on-Cash Return
3.5%
Cap rate
0.5%
Rent to Value Ratio
Active
$875,000
3
bds
|
2
ba
|
1,981
sqft
|
built
2017
4630 E Navigator Ln, Phoenix, AZ 85050
$-2,416
Cash flow
-14.4%
Cash-on-Cash Return
2.4%
Cap rate
0.4%
Rent to Value Ratio

Active
$275,000
1
bds
|
1
ba
|
739
sqft
|
built
1999
3633 N 3rd Ave, Phoenix, AZ 85013
$-557
Cash flow
-10.6%
Cash-on-Cash Return
3.2%
Cap rate
0.6%
Rent to Value Ratio
Active
$750,000
4
bds
|
3
ba
|
2,550
sqft
|
built
2007
29214 N 19th Ln, Phoenix, AZ 85085
$-1,277
Cash flow
-8.9%
Cash-on-Cash Return
3.6%
Cap rate
0.5%
Rent to Value Ratio

Active
$574,900
4
bds
|
2
ba
|
1,894
sqft
|
built
1983
9855 S 47th Pl, Phoenix, AZ 85044
$-1,537
Cash flow
-13.9%
Cash-on-Cash Return
2.5%
Cap rate
0.3%
Rent to Value Ratio

Active
$425,000
2
bds
|
3
ba
|
1,648
sqft
|
built
2001
3131 E Legacy Dr, Phoenix, AZ 85042
$-1,083
Cash flow
-13.3%
Cash-on-Cash Return
2.6%
Cap rate
0.5%
Rent to Value Ratio
Active
$449,000
5
bds
|
3
ba
|
1,940
sqft
|
built
2017
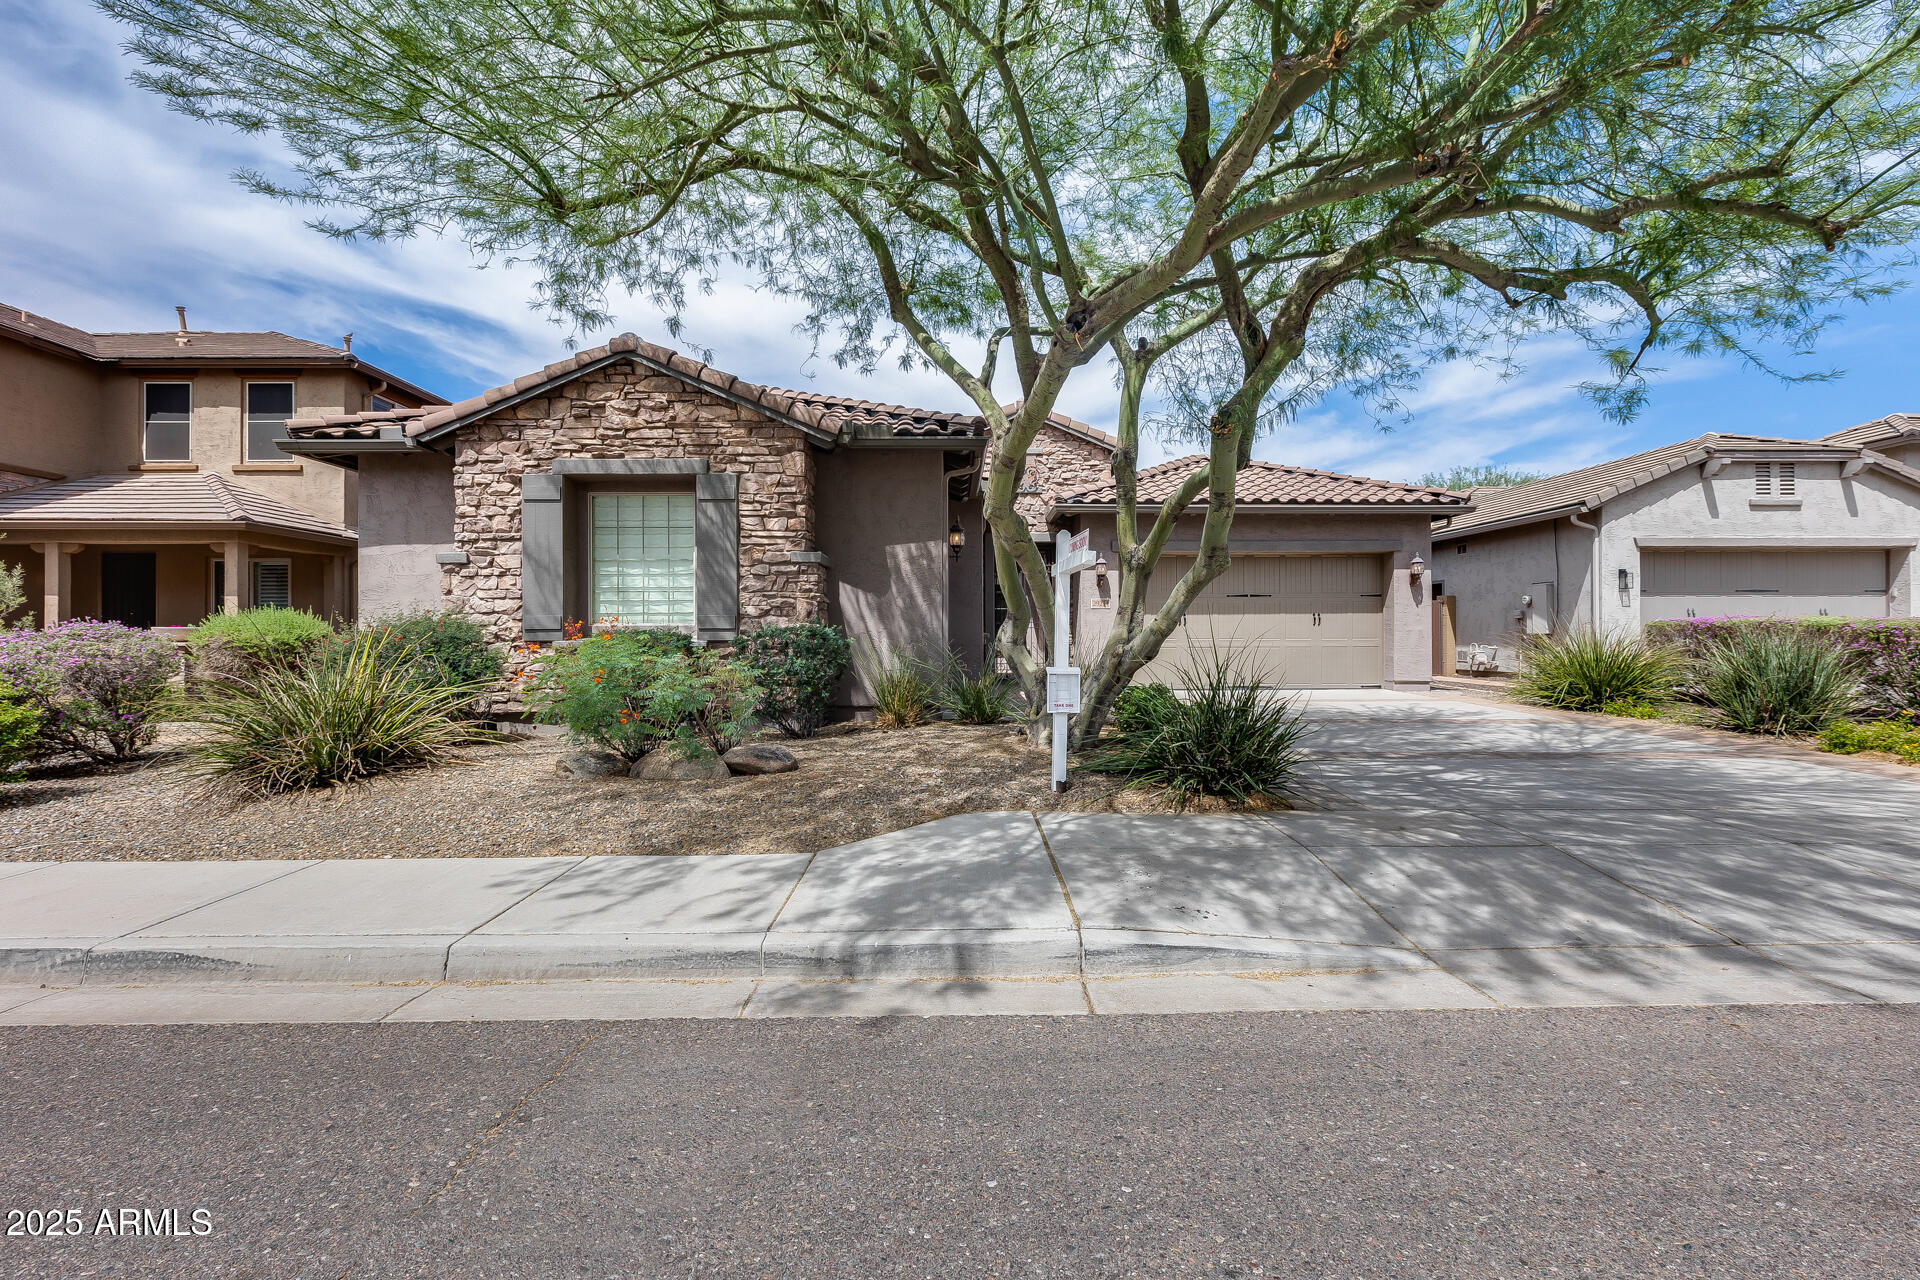
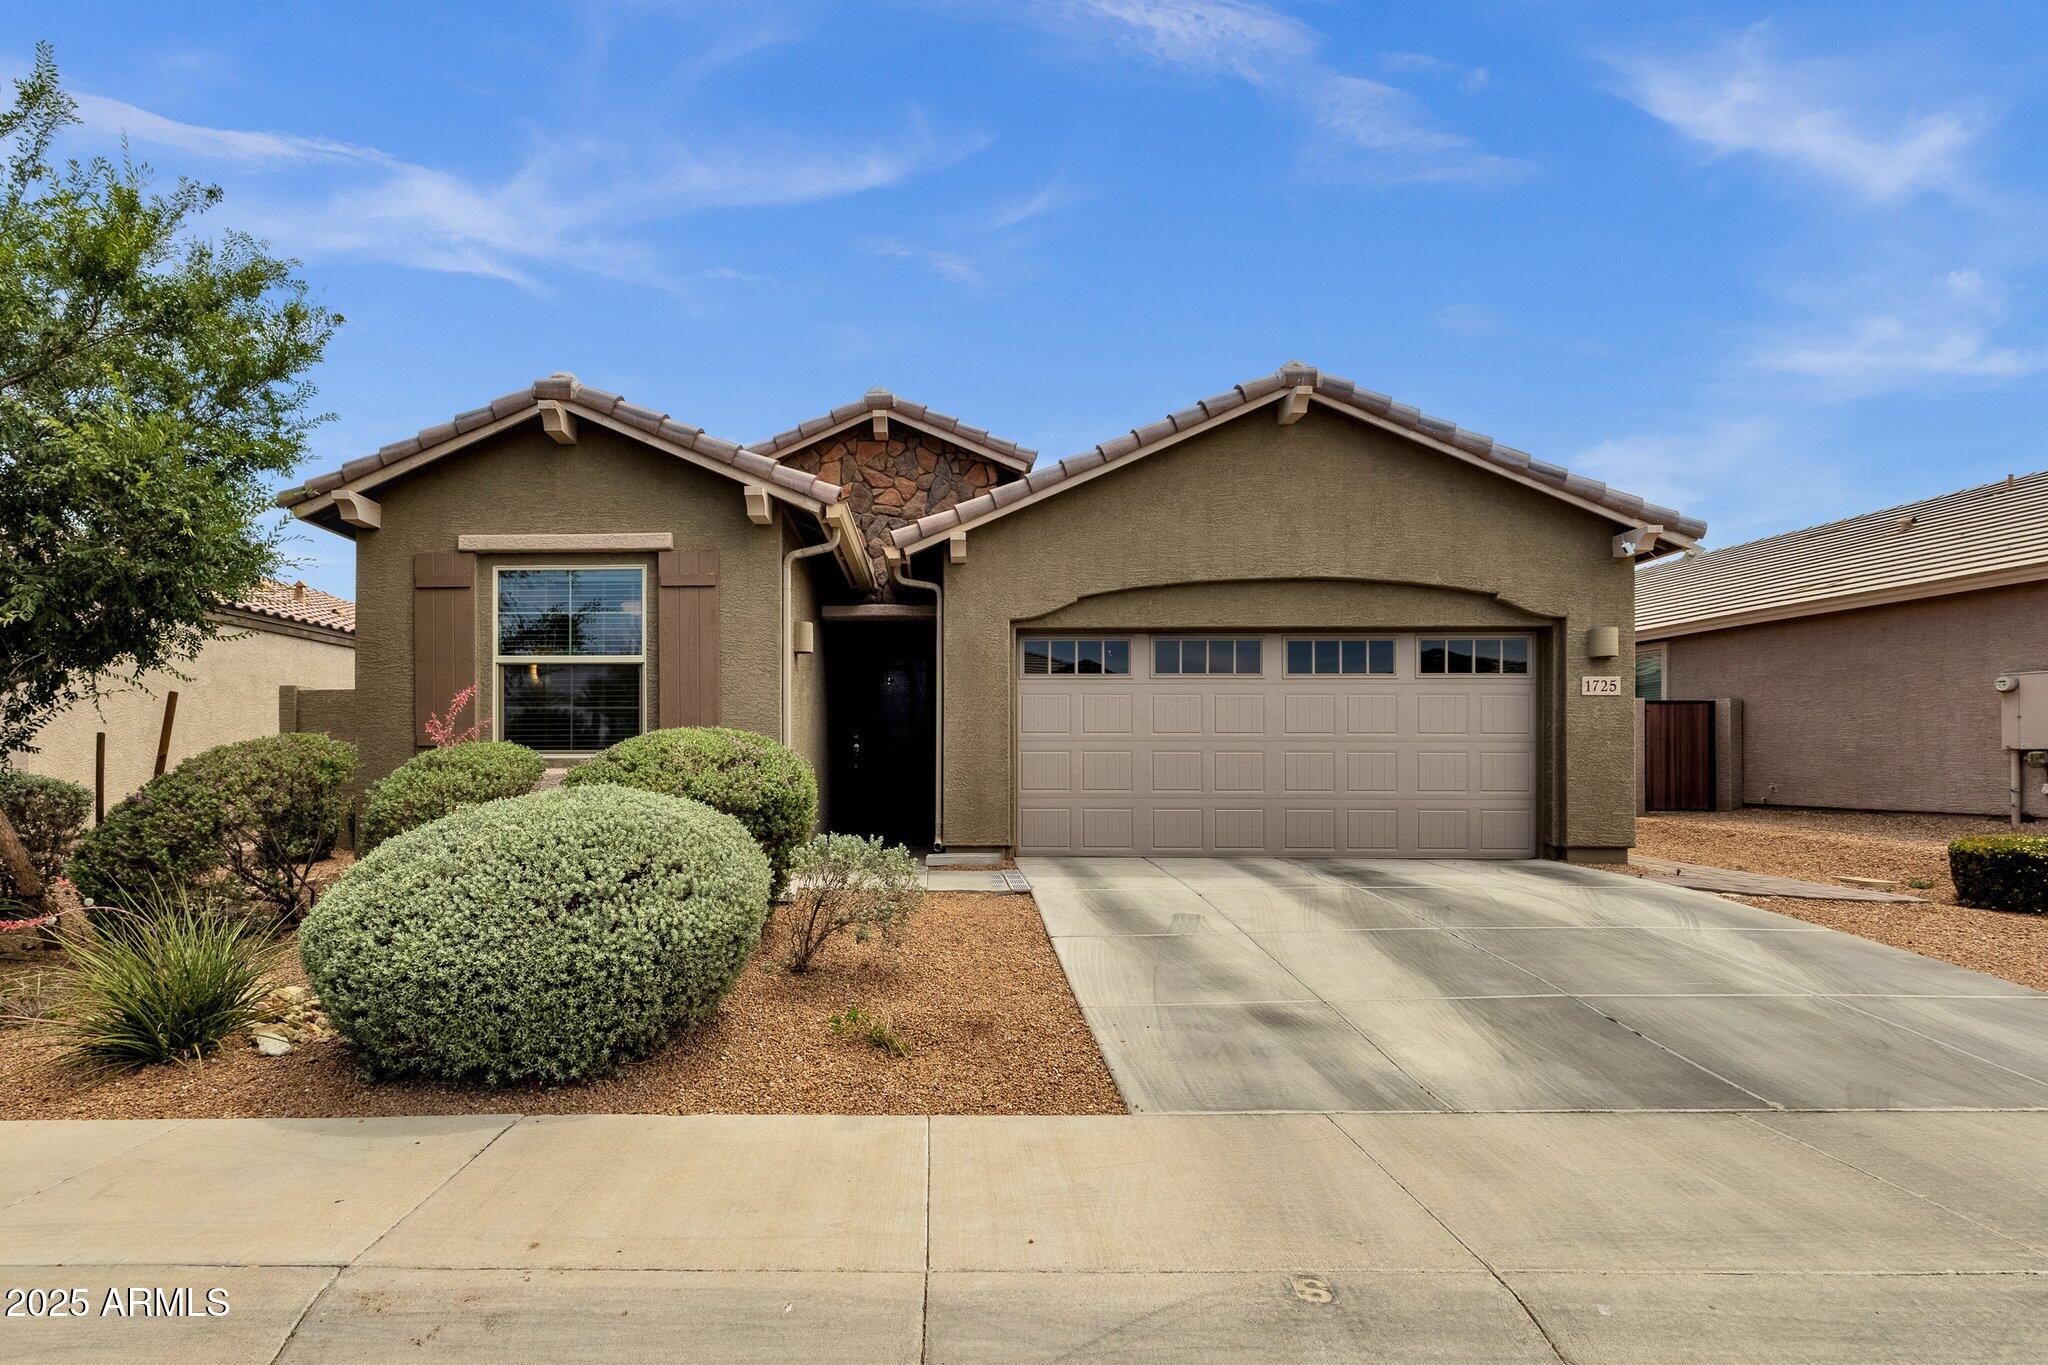
1725 E Chanute Pass, Phoenix, AZ 85040
$-697
Cash flow
-8.1%
Cash-on-Cash Return
3.8%
Cap rate
0.6%
Rent to Value Ratio
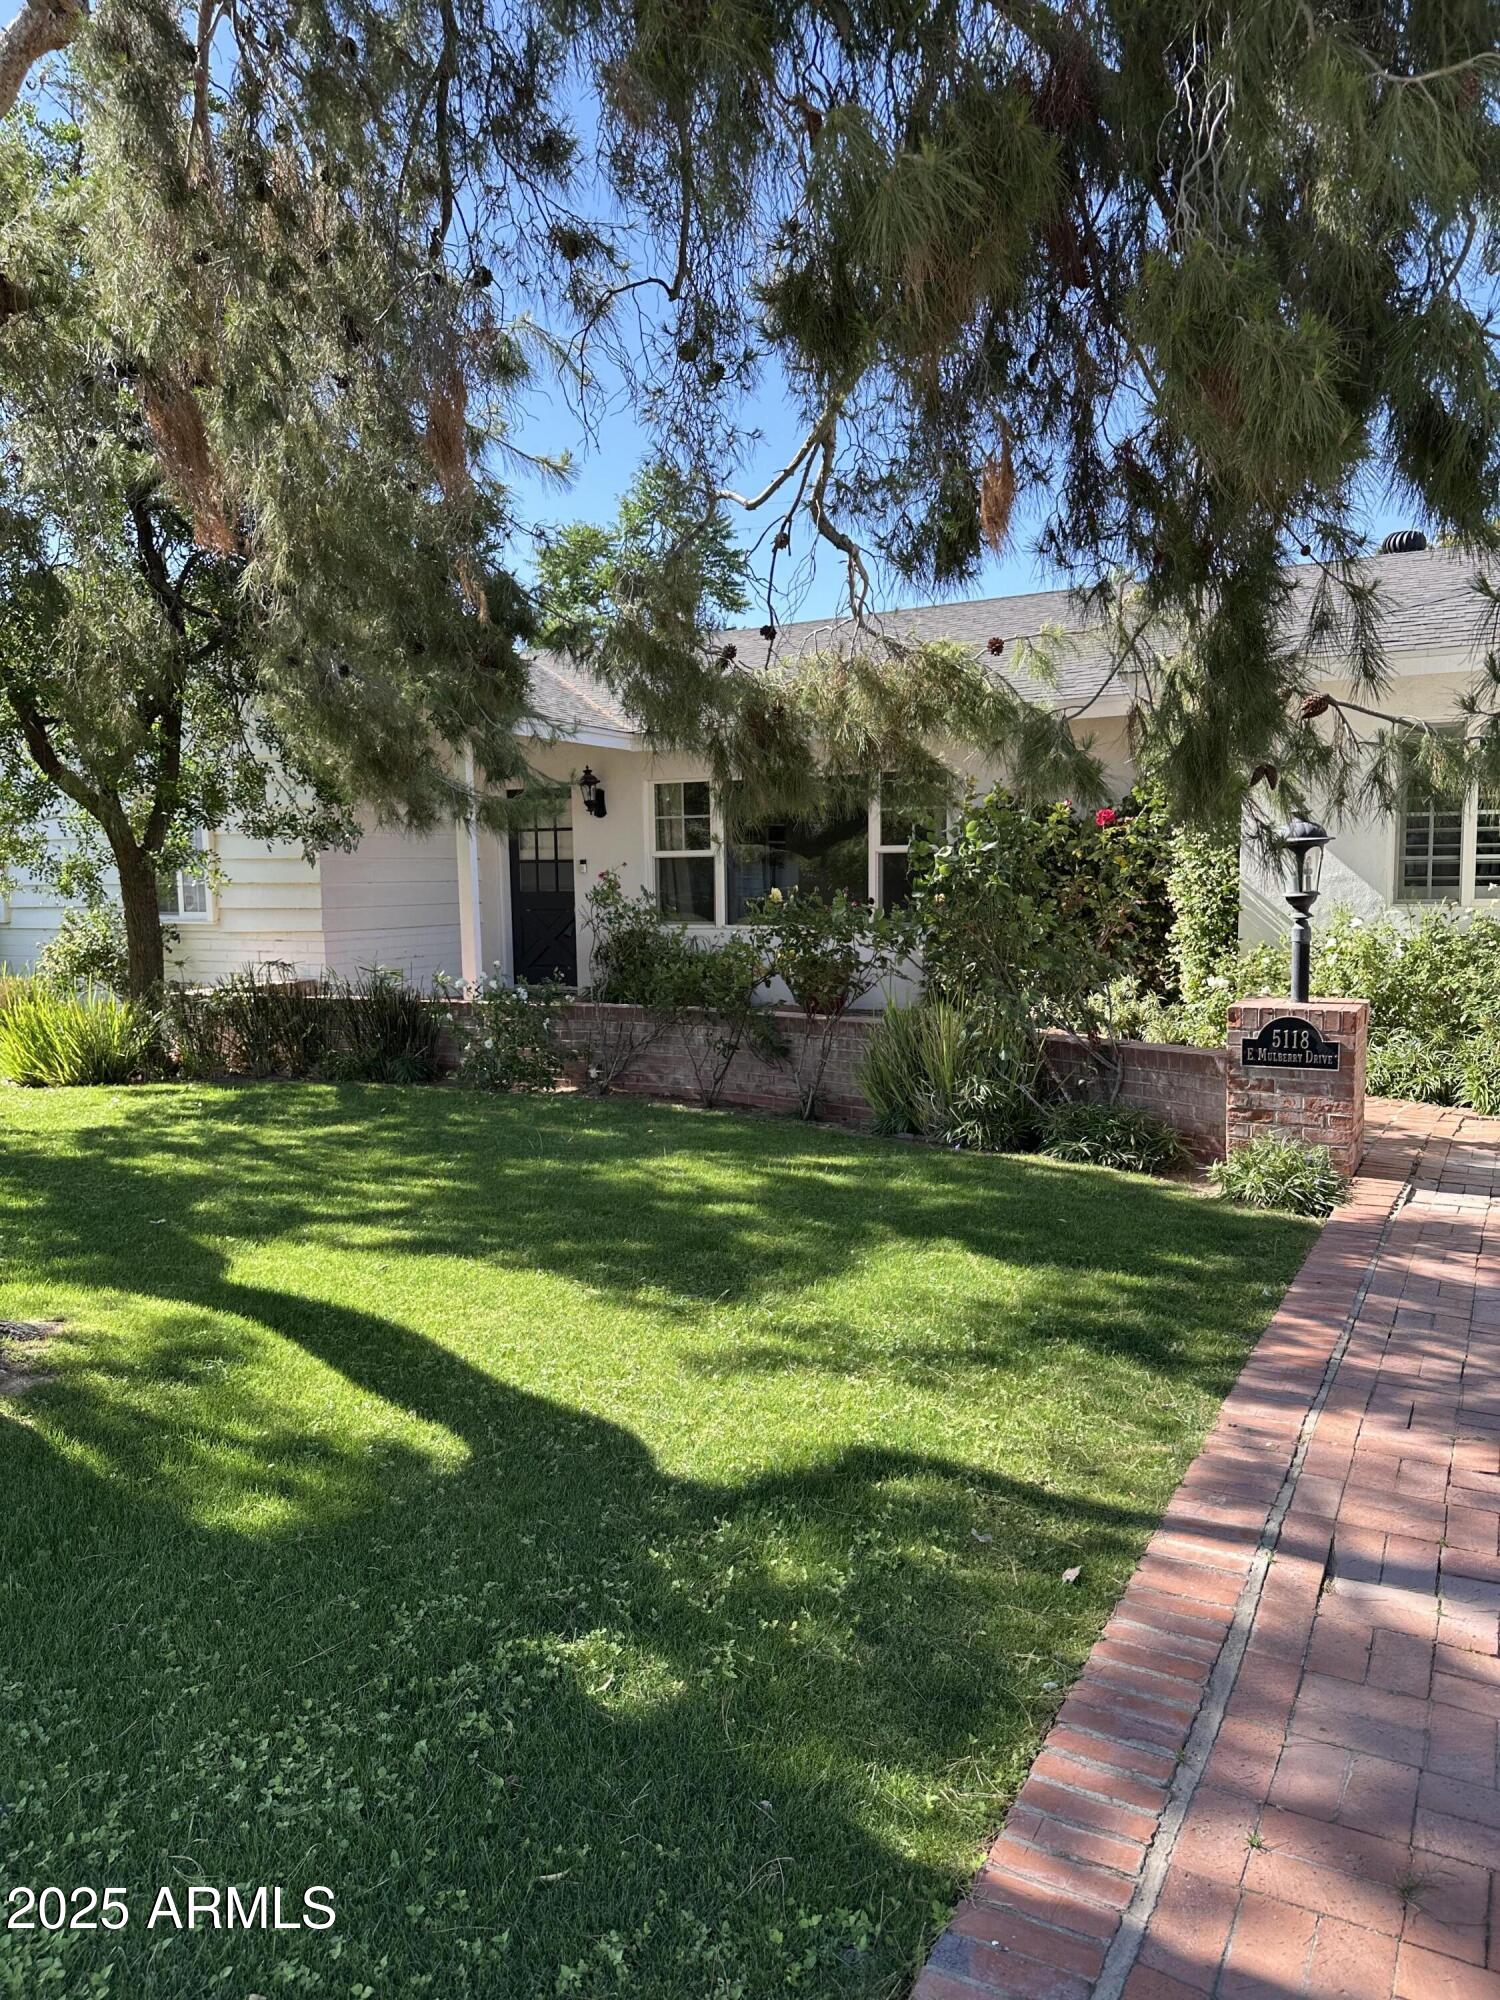
Active
$1,500,000
4
bds
|
3
ba
|
2,638
sqft
|
built
1957
5118 E Mulberry Dr, Phoenix, AZ 85018
$-4,561
Cash flow
-15.9%
Cash-on-Cash Return
2.0%
Cap rate
0.3%
Rent to Value Ratio
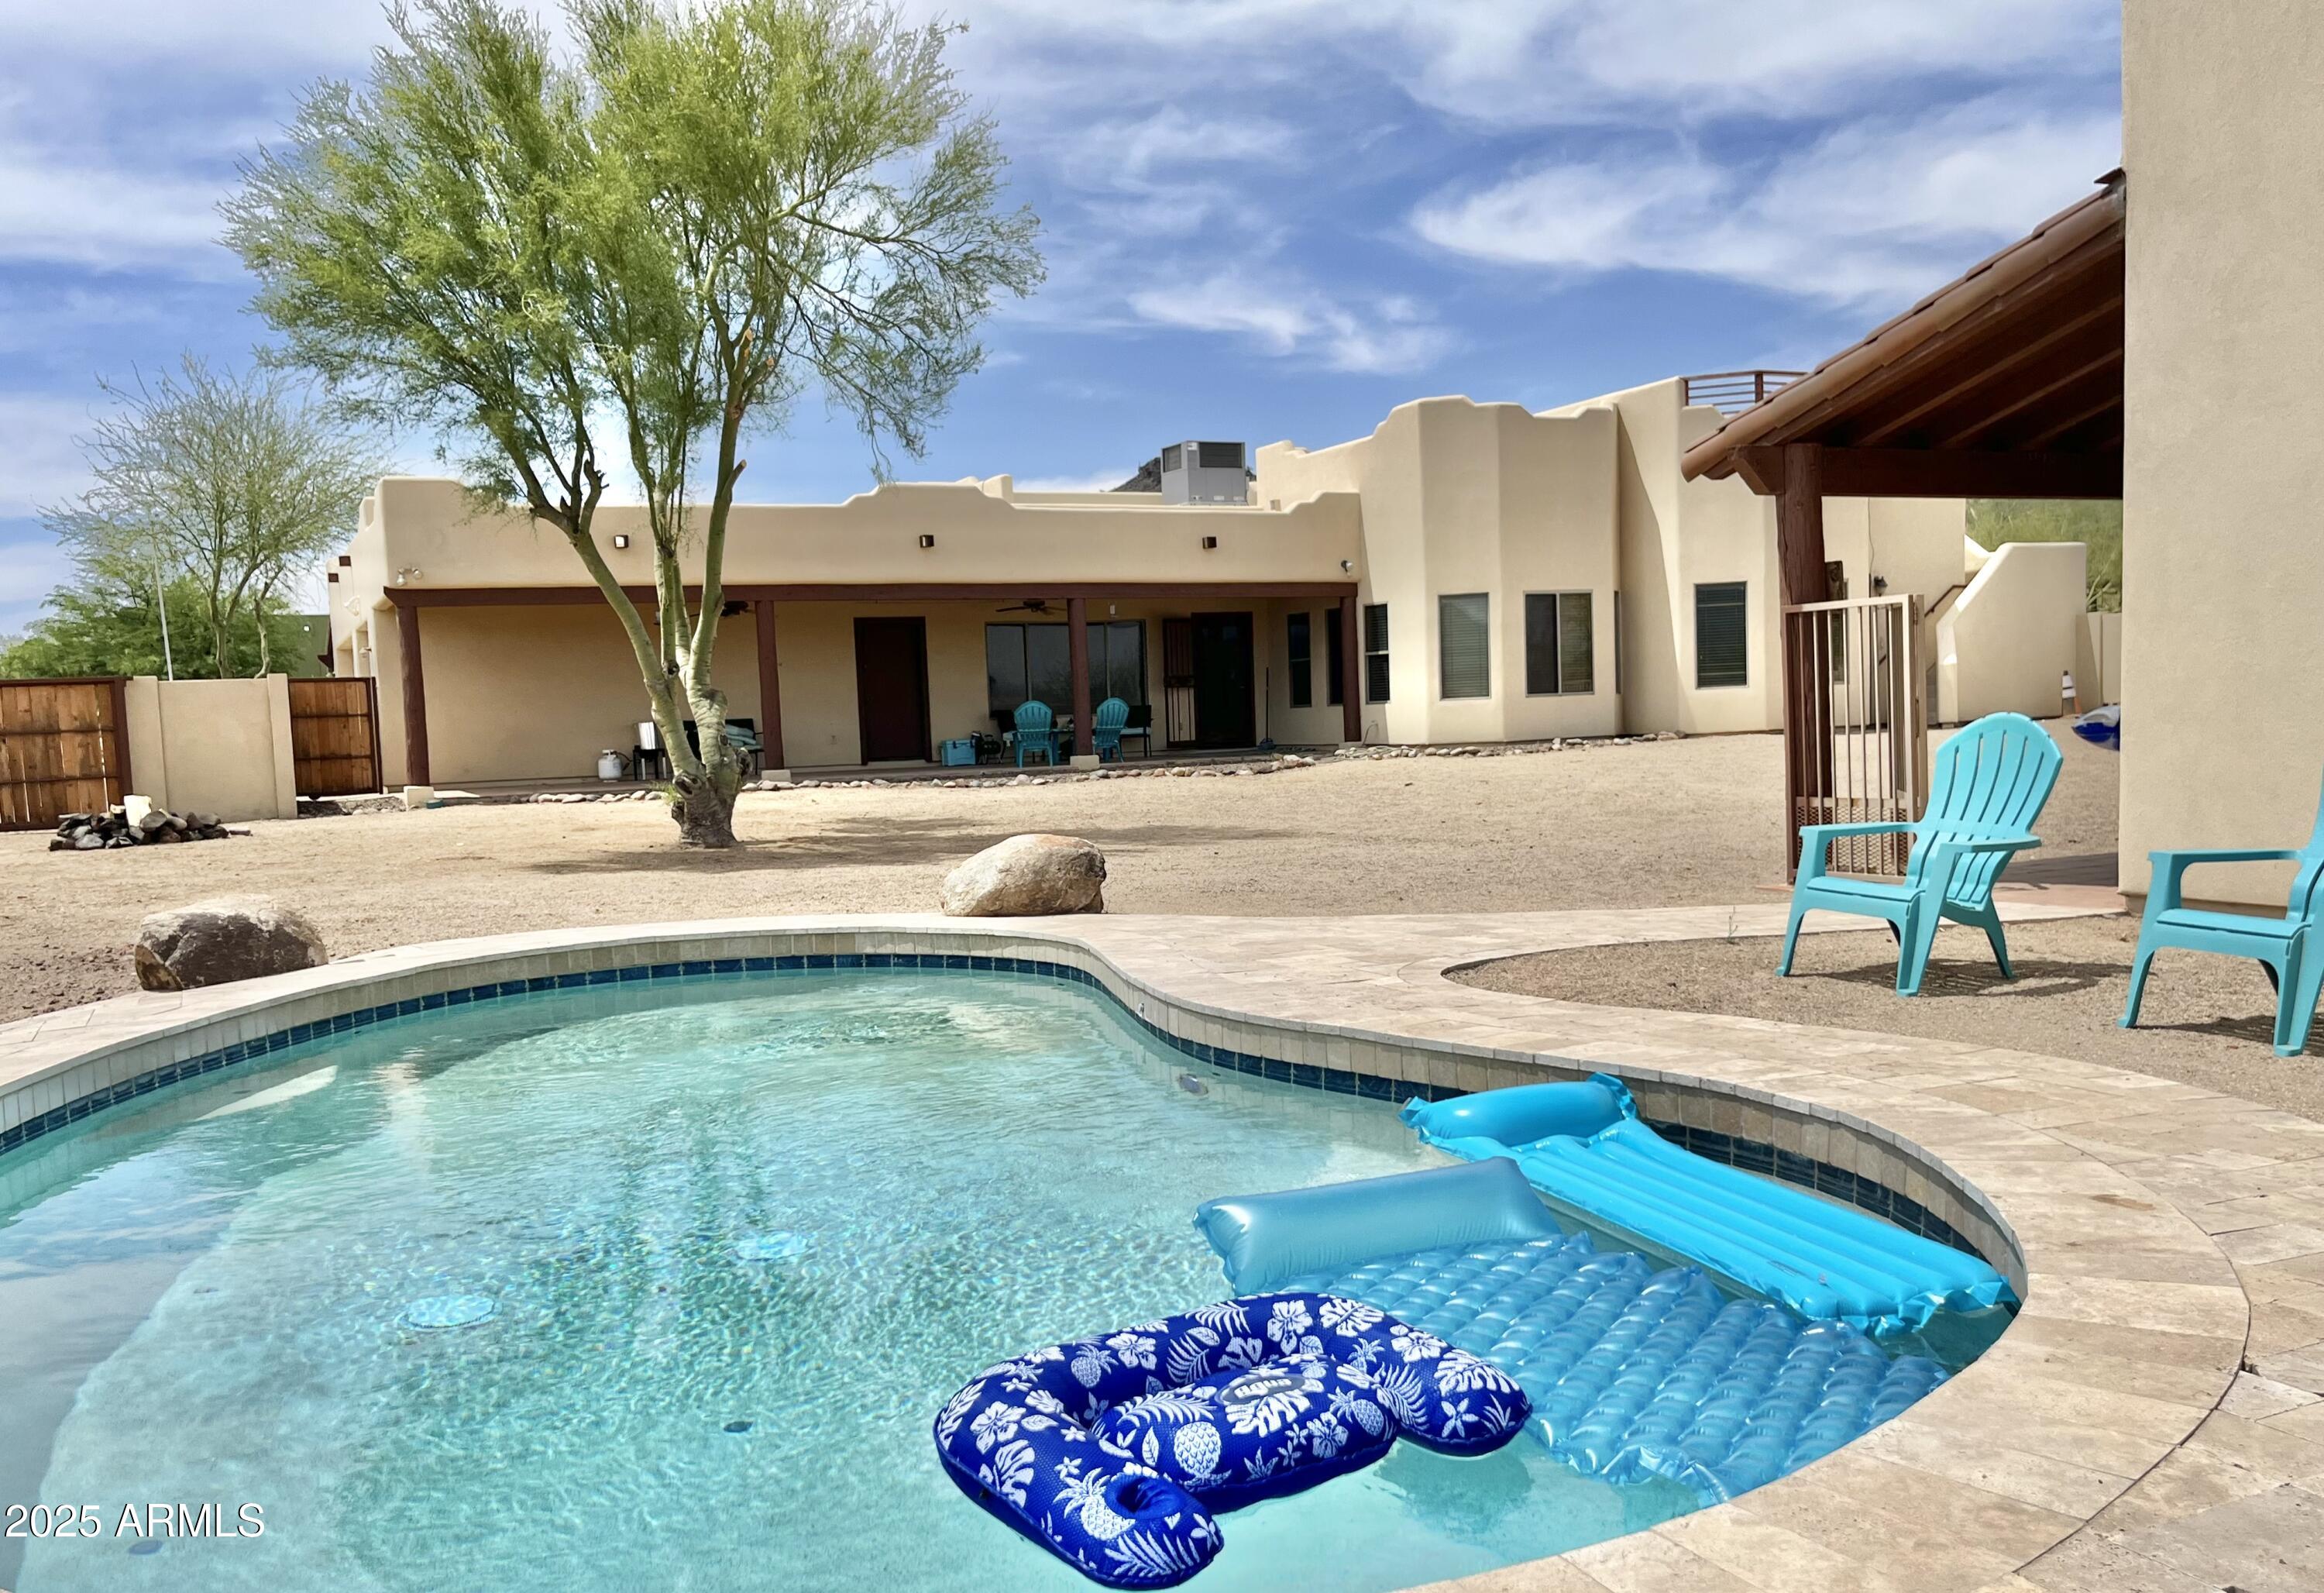
Active
$815,000
6
bds
|
3
ba
|
3,148
sqft
|
built
2000
36721 N 17th Ave, Phoenix, AZ 85086
$-1,739
Cash flow
-11.1%
Cash-on-Cash Return
3.1%
Cap rate
0.4%
Rent to Value Ratio

Active
$400,000
4
bds
|
3
ba
|
1,435
sqft
|
built
1957
4403 N 56th Dr, Phoenix, AZ 85031
$-728
Cash flow
-9.5%
Cash-on-Cash Return
3.5%
Cap rate
0.5%
Rent to Value Ratio