Phoenix, AZ Investment Properties for Sale
Browse homes for sale and investment properties in Phoenix, AZ. Refine your search by price, property type, or more.
Best cash flowing properties in Phoenix, AZ

Active
$259,990
3
bds
|
2
ba
|
1,298
sqft
|
built
1972
2645 W Elm St, Phoenix, AZ 85017
$-470
Cash flow
-9.4%
Cash-on-Cash Return
4.1%
Cap rate
0.7%
Rent to Value Ratio
Active
$275,000
2
bds
|
2
ba
|
790
sqft
|
built
2003
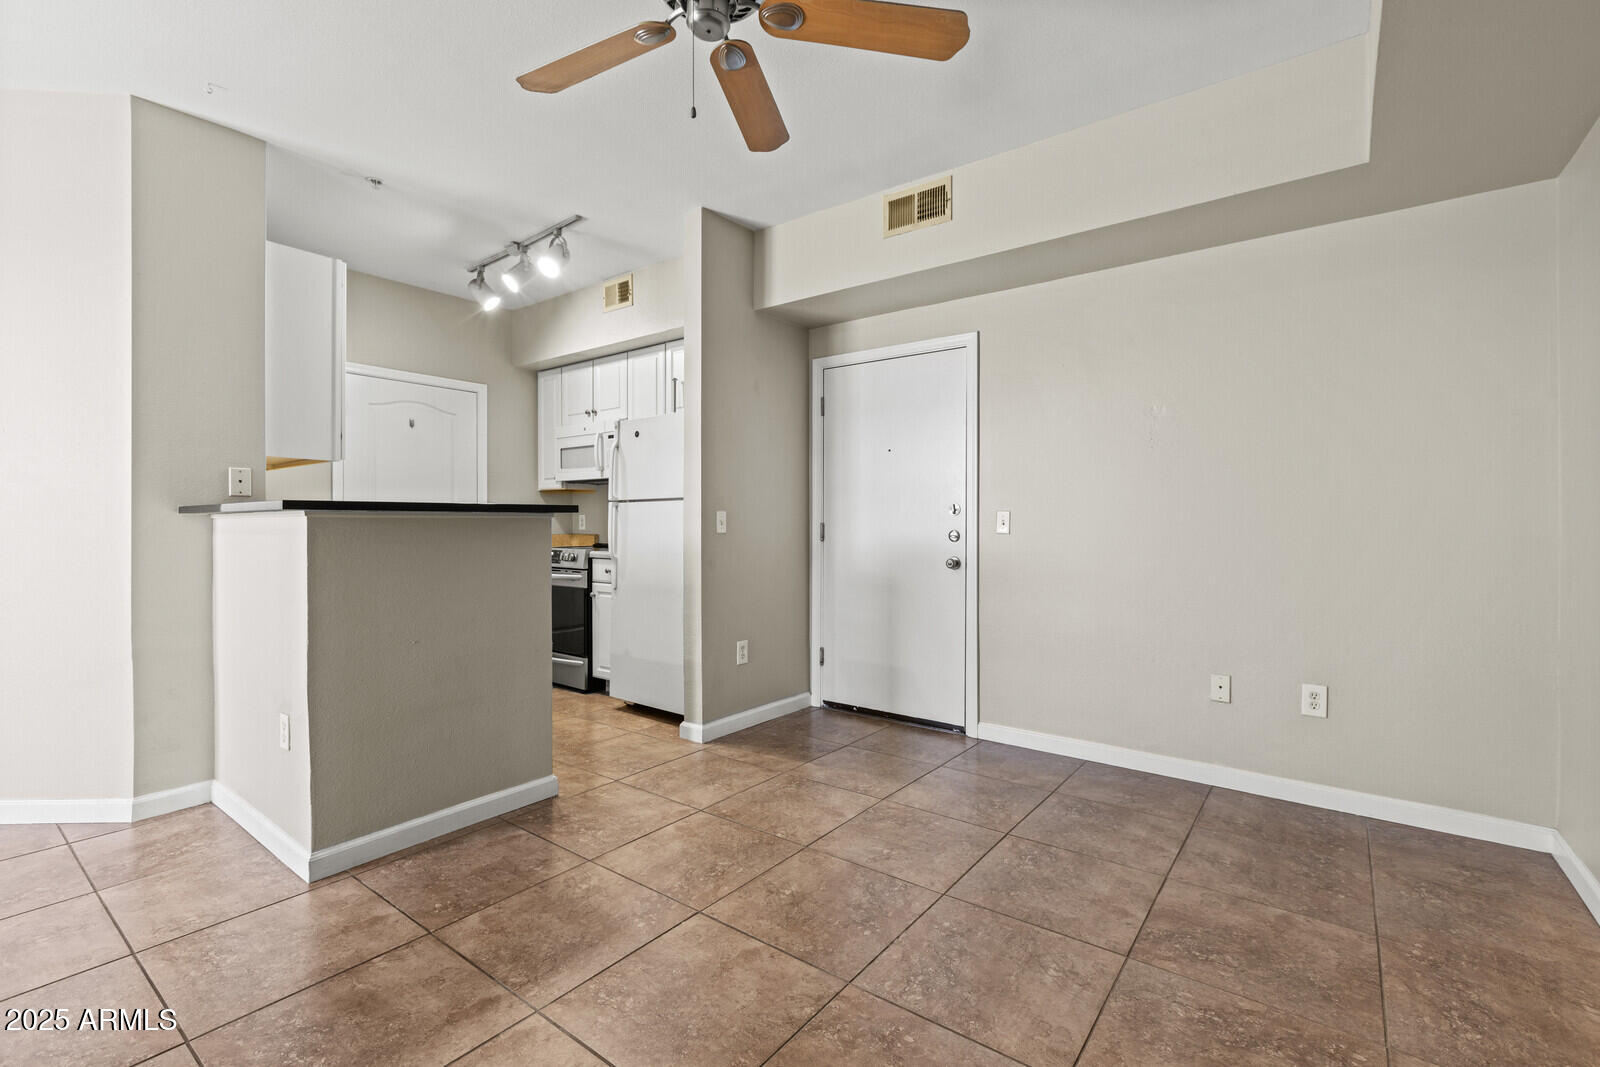
1701 E Colter St, Phoenix, AZ 85016
$-533
Cash flow
-10.1%
Cash-on-Cash Return
4.0%
Cap rate
0.7%
Rent to Value Ratio
3,615 out of 3,956 properties for sale in Phoenix, AZ
Limited Results Shown
Create a free account, or log in to reveal all property listings and enjoy the complete experience.

Active
$675,000
3
bds
|
2
ba
|
1,563
sqft
|
built
1945
1444 E Coronado Rd, Phoenix, AZ 85006
$-1,724
Cash flow
-13.3%
Cash-on-Cash Return
3.2%
Cap rate
0.4%
Rent to Value Ratio
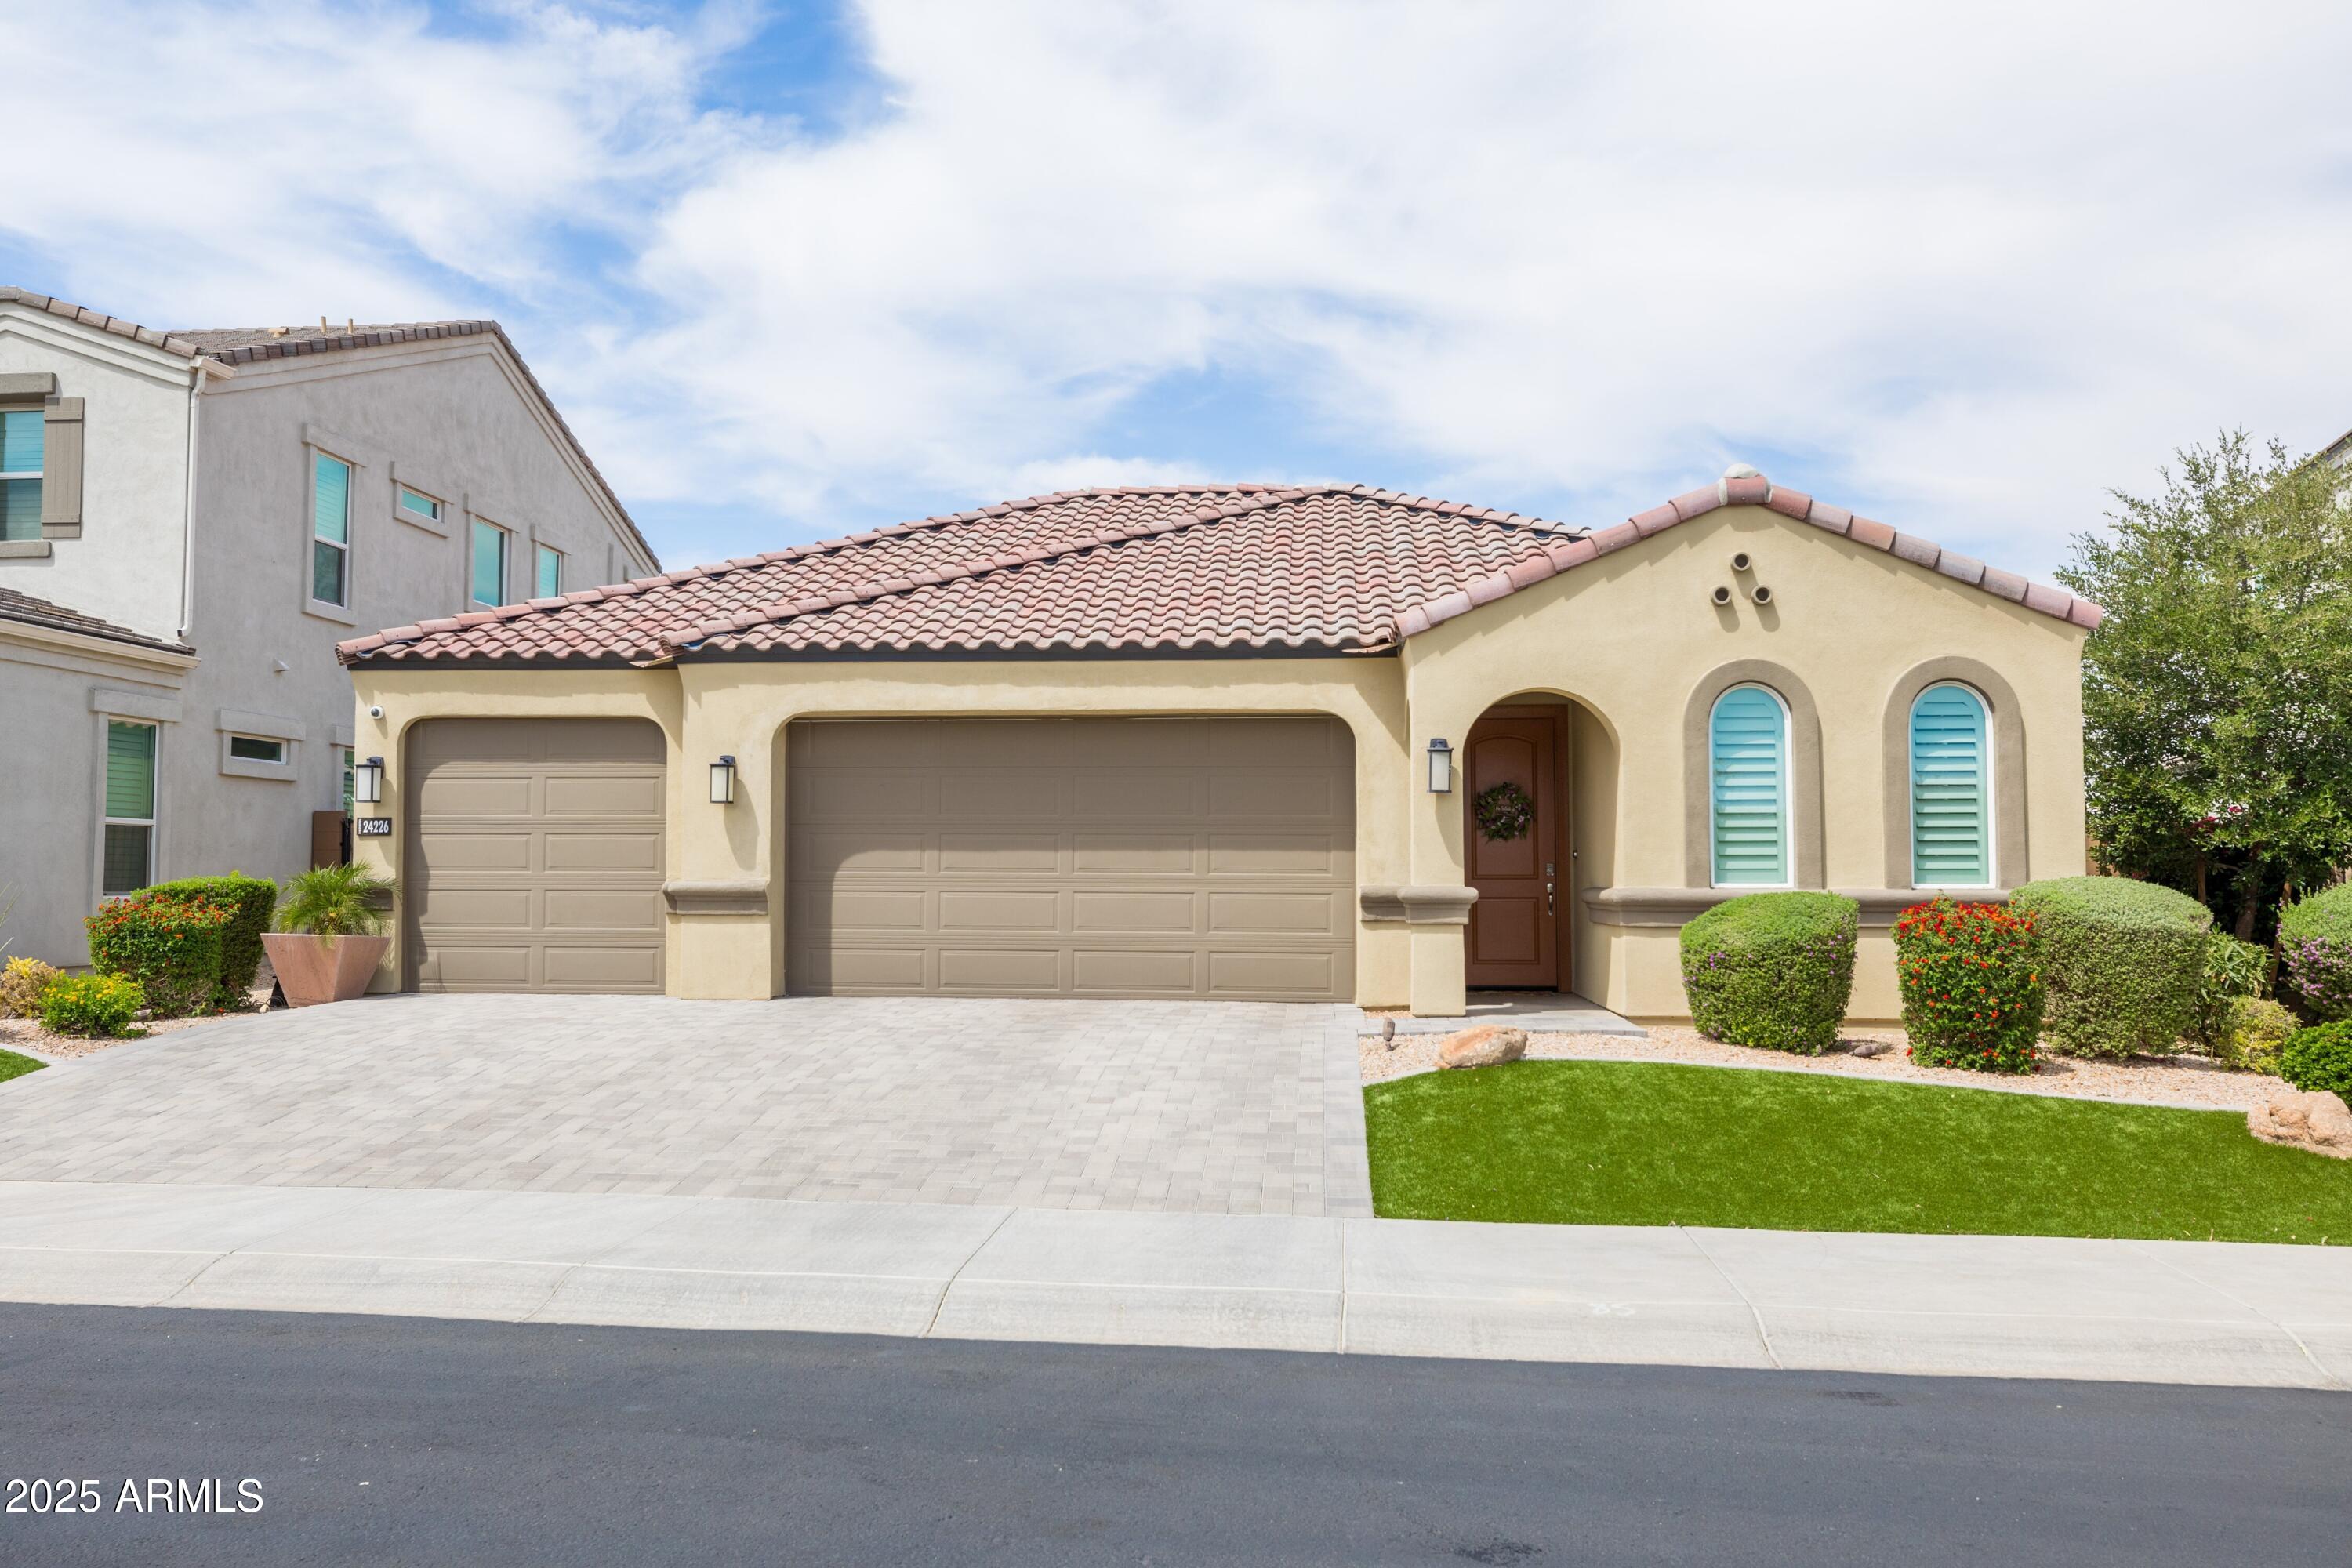
Active
$675,000
3
bds
|
2
ba
|
1,612
sqft
|
built
2019
24226 N 22nd St, Phoenix, AZ 85024
$-1,109
Cash flow
-8.6%
Cash-on-Cash Return
4.3%
Cap rate
0.6%
Rent to Value Ratio
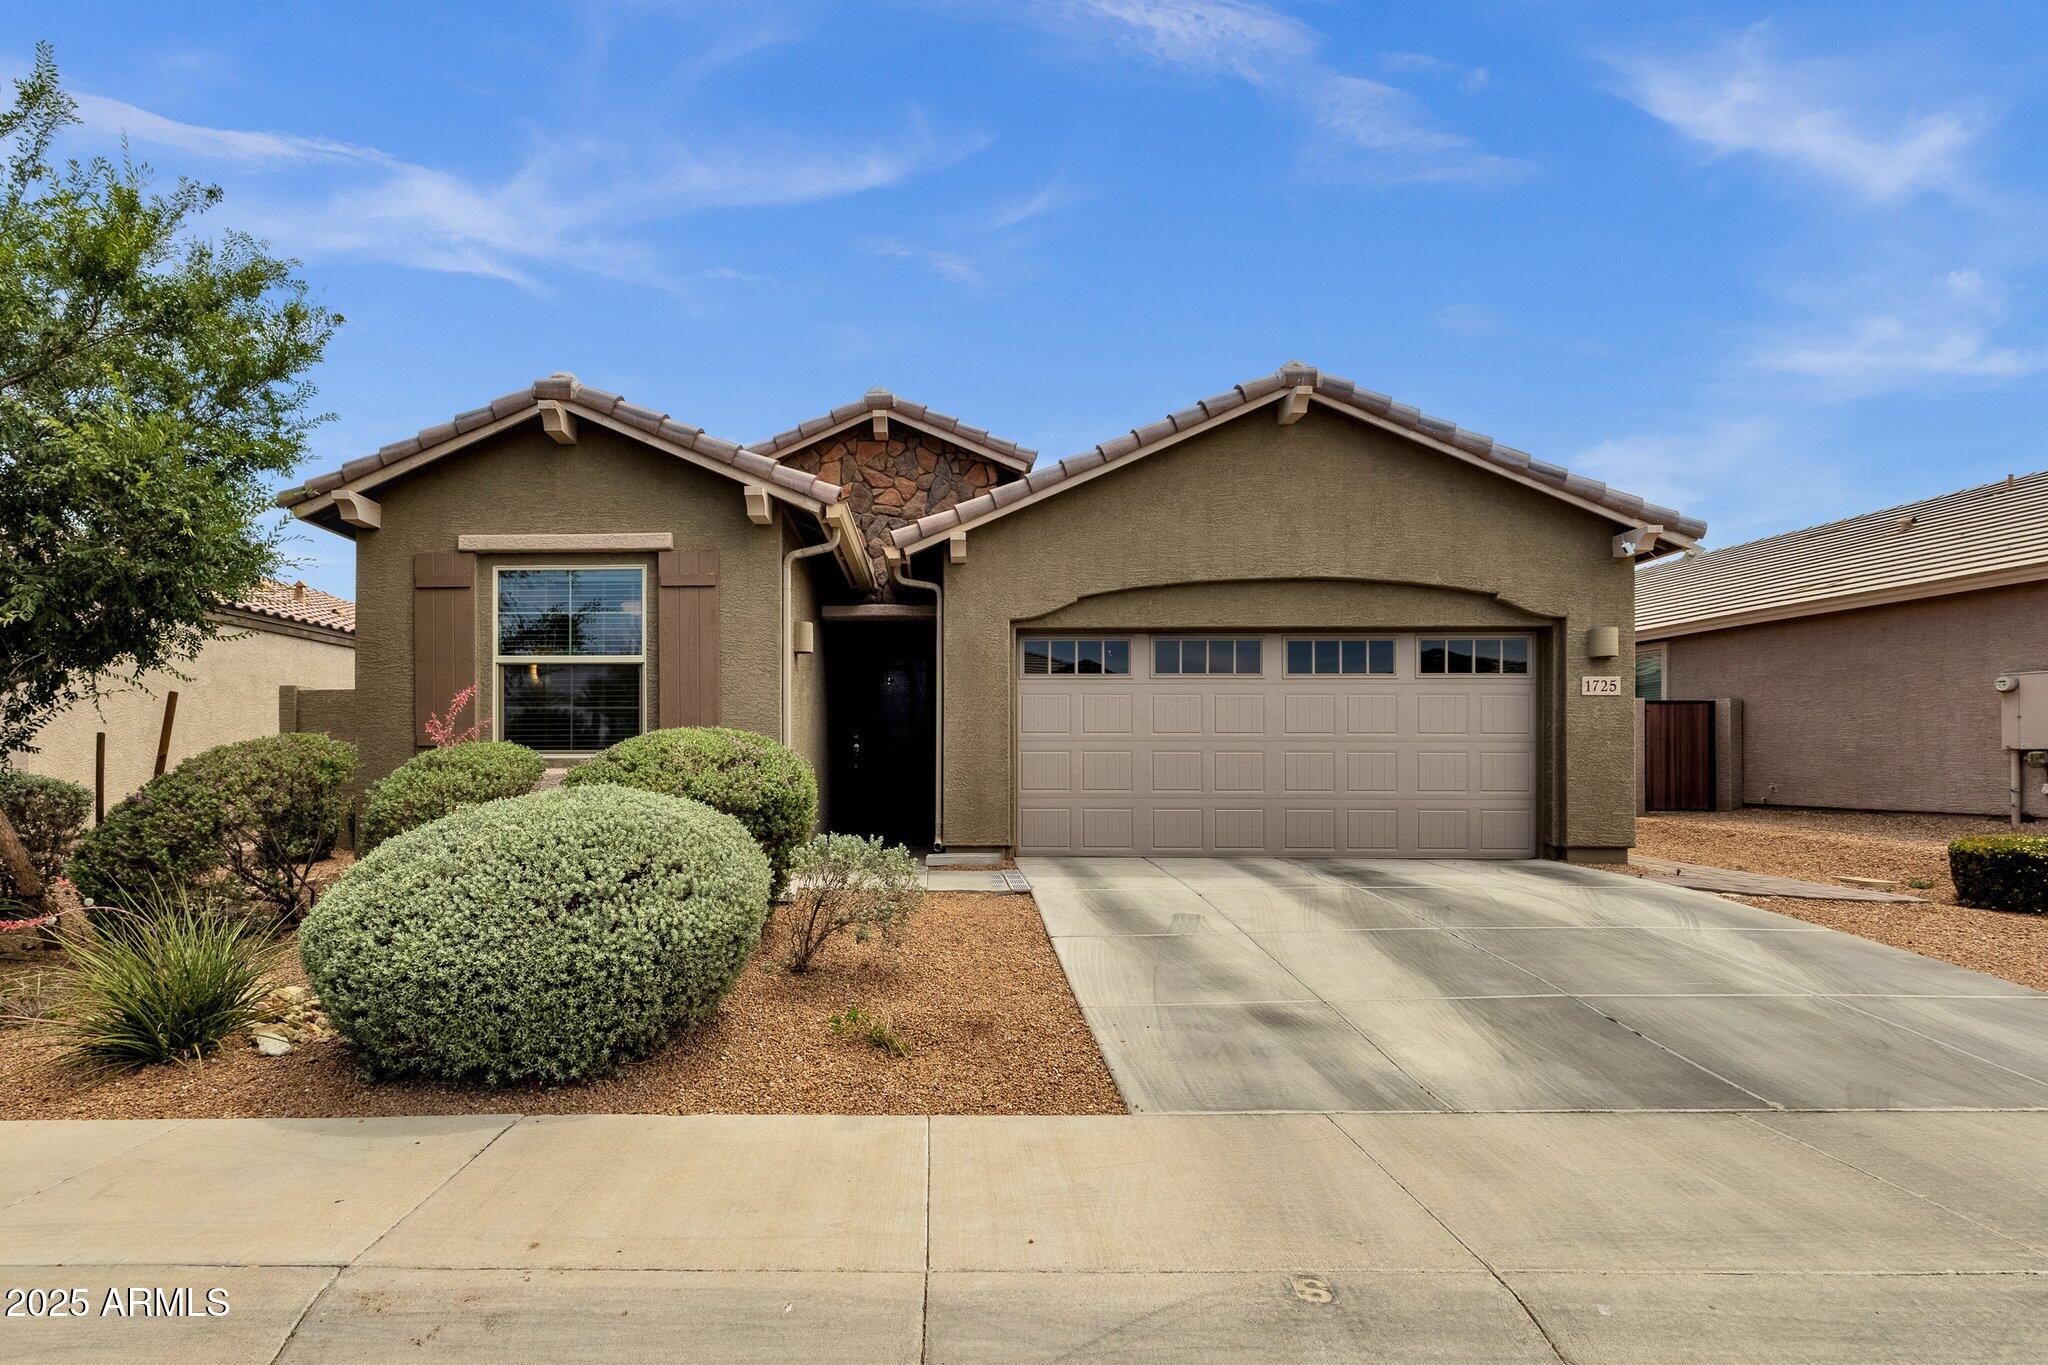
Active
$449,000
5
bds
|
3
ba
|
1,940
sqft
|
built
2017
1725 E Chanute Pass, Phoenix, AZ 85040
$-926
Cash flow
-10.8%
Cash-on-Cash Return
3.8%
Cap rate
0.6%
Rent to Value Ratio

Active
$425,000
2
bds
|
3
ba
|
1,648
sqft
|
built
2001
3131 E Legacy Dr, Phoenix, AZ 85042
$-1,300
Cash flow
-16.0%
Cash-on-Cash Return
2.6%
Cap rate
0.5%
Rent to Value Ratio
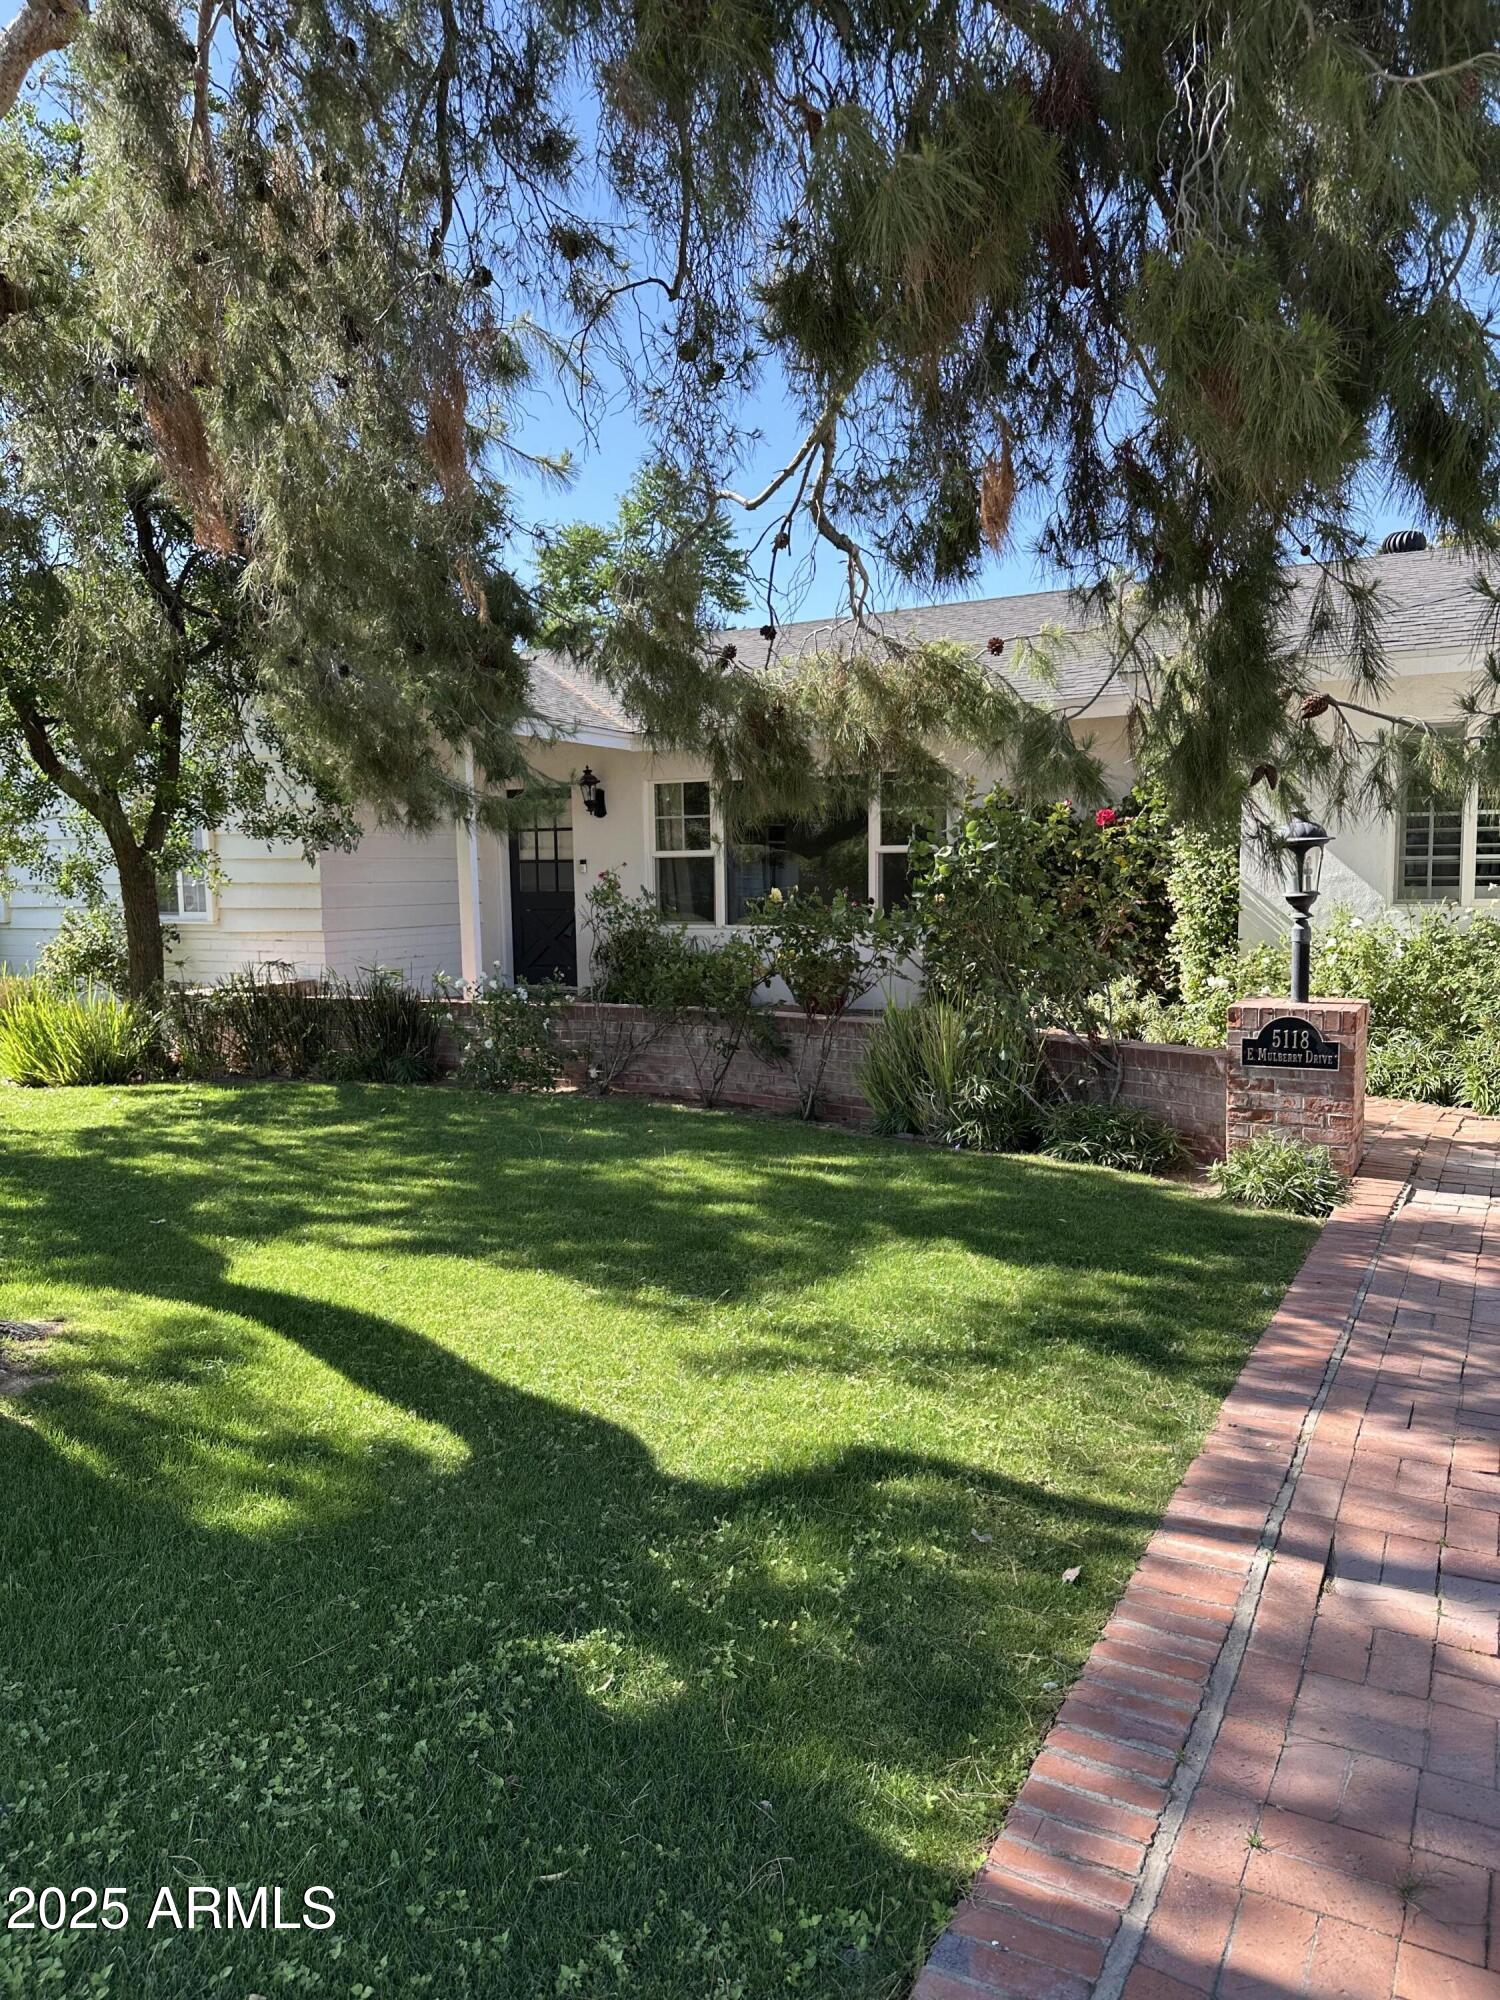
Active
$1,500,000
4
bds
|
3
ba
|
2,638
sqft
|
built
1957
5118 E Mulberry Dr, Phoenix, AZ 85018
$-5,326
Cash flow
-18.5%
Cash-on-Cash Return
2.0%
Cap rate
0.3%
Rent to Value Ratio
Active
$369,900
4
bds
|
3
ba
|
2,461
sqft
|
built
2004
9456 W Jamestown Rd, Phoenix, AZ 85037
$-796
Cash flow
-11.2%
Cash-on-Cash Return
3.7%
Cap rate
0.5%
Rent to Value Ratio
Active
$574,900
5
bds
|
3
ba
|
2,065
sqft
|
built
1969
4202 W Purdue Ave, Phoenix, AZ 85051
$-1,339
Cash flow
-12.2%
Cash-on-Cash Return
3.5%
Cap rate
0.5%
Rent to Value Ratio

Active
$574,900
4
bds
|
2
ba
|
1,894
sqft
|
built
1983
9855 S 47th Pl, Phoenix, AZ 85044
$-1,830
Cash flow
-16.6%
Cash-on-Cash Return
2.5%
Cap rate
0.3%
Rent to Value Ratio
Active
$875,000
3
bds
|
2
ba
|
1,981
sqft
|
built
2017
4630 E Navigator Ln, Phoenix, AZ 85050
$-2,862
Cash flow
-17.1%
Cash-on-Cash Return
2.4%
Cap rate
0.4%
Rent to Value Ratio

Active
$275,000
1
bds
|
1
ba
|
739
sqft
|
built
1999
3633 N 3rd Ave, Phoenix, AZ 85013
$-698
Cash flow
-13.2%
Cash-on-Cash Return
3.2%
Cap rate
0.6%
Rent to Value Ratio
Active
$750,000
4
bds
|
3
ba
|
2,550
sqft
|
built
2007
29214 N 19th Ln, Phoenix, AZ 85085
$-1,660
Cash flow
-11.5%
Cash-on-Cash Return
3.6%
Cap rate
0.5%
Rent to Value Ratio
Active
$815,000
6
bds
|
3
ba
|
3,148
sqft
|
built
2000
36721 N 17th Ave, Phoenix, AZ 85086
$-2,154
Cash flow
-13.8%
Cash-on-Cash Return
3.1%
Cap rate
0.4%
Rent to Value Ratio

Active
$400,000
4
bds
|
3
ba
|
1,435
sqft
|
built
1957
4403 N 56th Dr, Phoenix, AZ 85031
$-932
Cash flow
-12.2%
Cash-on-Cash Return
3.5%
Cap rate
0.5%
Rent to Value Ratio

Active
$975,000
4
bds
|
4
ba
|
2,331
sqft
|
built
1974
11007 N 26th St, Phoenix, AZ 85028
$-3,136
Cash flow
-16.8%
Cash-on-Cash Return
2.4%
Cap rate
0.3%
Rent to Value Ratio
Active
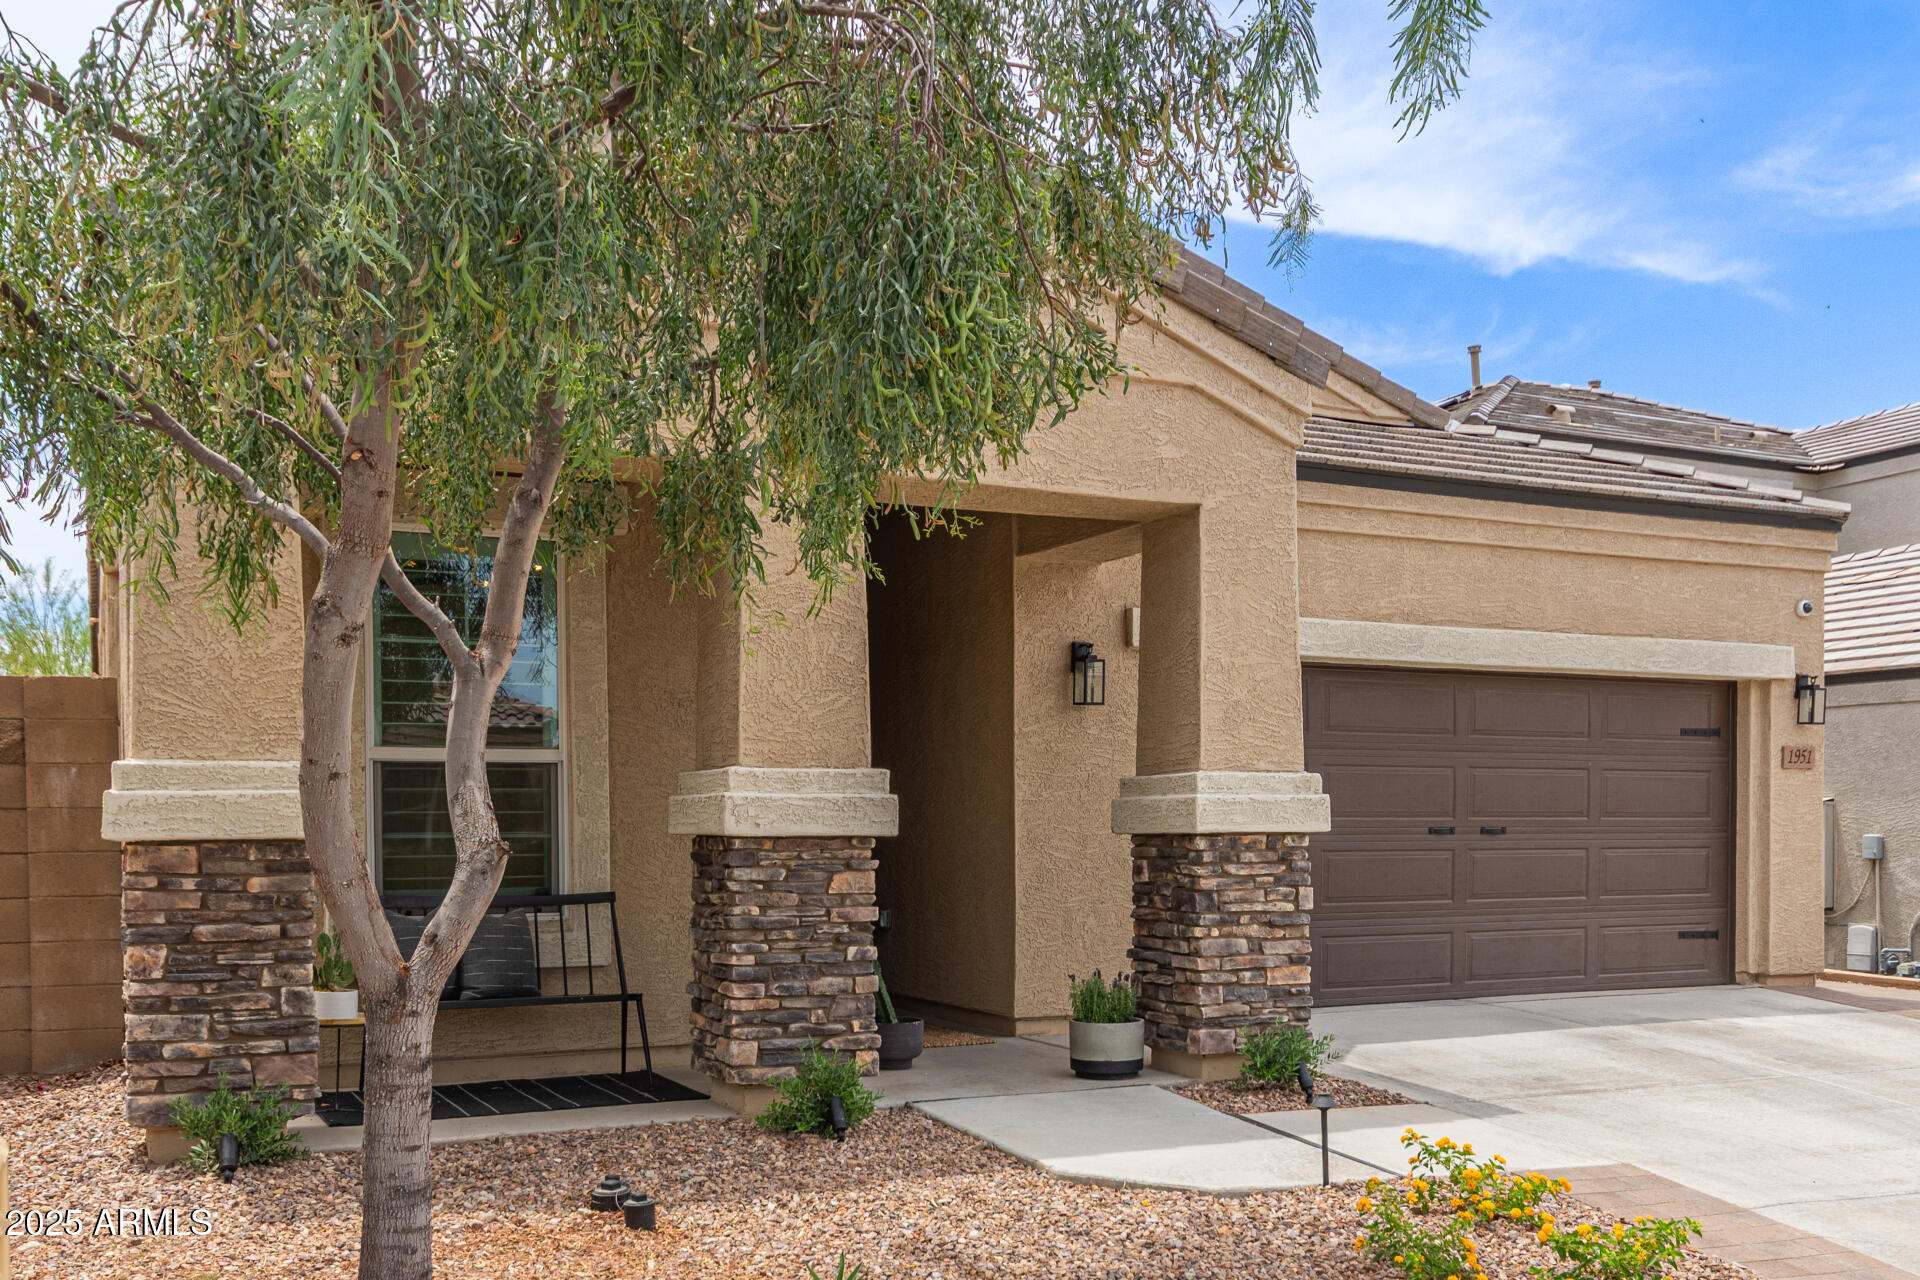
$699,000
4
bds
|
3
ba
|
2,022
sqft
|
built
2020
1951 W Plum Rd, Phoenix, AZ 85085
$-2,140
Cash flow
-16.0%
Cash-on-Cash Return
2.6%
Cap rate
0.4%
Rent to Value Ratio

Active
$305,000
1
bds
|
1
ba
|
844
sqft
|
built
2001
4455 E Paradise Village Pkwy S, Phoenix, AZ 85032
$-802
Cash flow
-13.7%
Cash-on-Cash Return
3.1%
Cap rate
0.5%
Rent to Value Ratio
Active
$399,900
4
bds
|
2
ba
|
1,470
sqft
|
built
2021
4732 S 38th Dr, Phoenix, AZ 85041
$-990
Cash flow
-12.9%
Cash-on-Cash Return
3.3%
Cap rate
0.5%
Rent to Value Ratio
Active
$1,390,000
4
bds
|
3
ba
|
3,886
sqft
|
built
2001
136 E Desert Wind Dr, Phoenix, AZ 85048
$-5,259
Cash flow
-19.7%
Cash-on-Cash Return
1.7%
Cap rate
0.3%
Rent to Value Ratio

Active
$949,999
3
bds
|
2
ba
|
2,032
sqft
|
built
1950
1029 E Palo Verde Dr, Phoenix, AZ 85014
$-2,635
Cash flow
-14.5%
Cash-on-Cash Return
3.0%
Cap rate
0.4%
Rent to Value Ratio

Active
$749,900
2
bds
|
2
ba
|
1,407
sqft
|
built
1981
2413 E Rancho Dr, Phoenix, AZ 85016
$-2,820
Cash flow
-19.6%
Cash-on-Cash Return
1.8%
Cap rate
0.4%
Rent to Value Ratio
Active
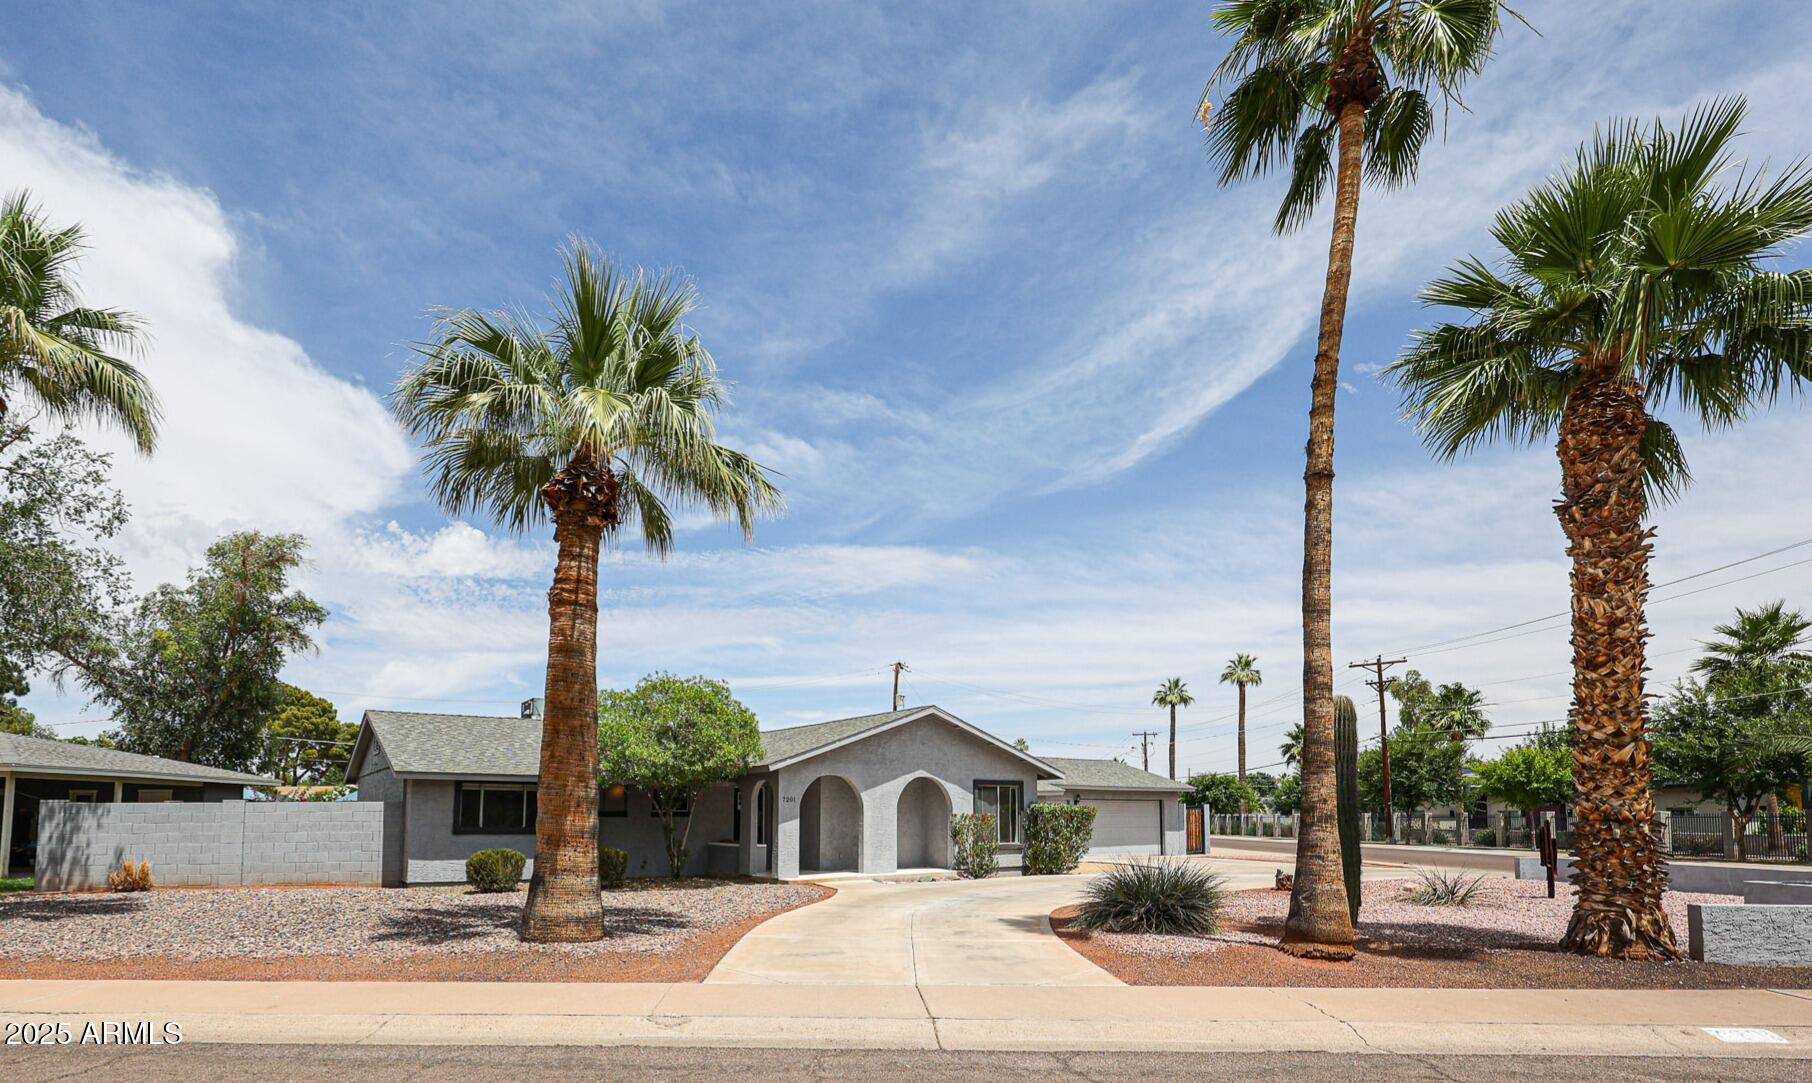
$750,000
4
bds
|
3
ba
|
2,413
sqft
|
built
1956
7201 N 16th Dr, Phoenix, AZ 85021
$-1,793
Cash flow
-12.5%
Cash-on-Cash Return
3.4%
Cap rate
0.5%
Rent to Value Ratio
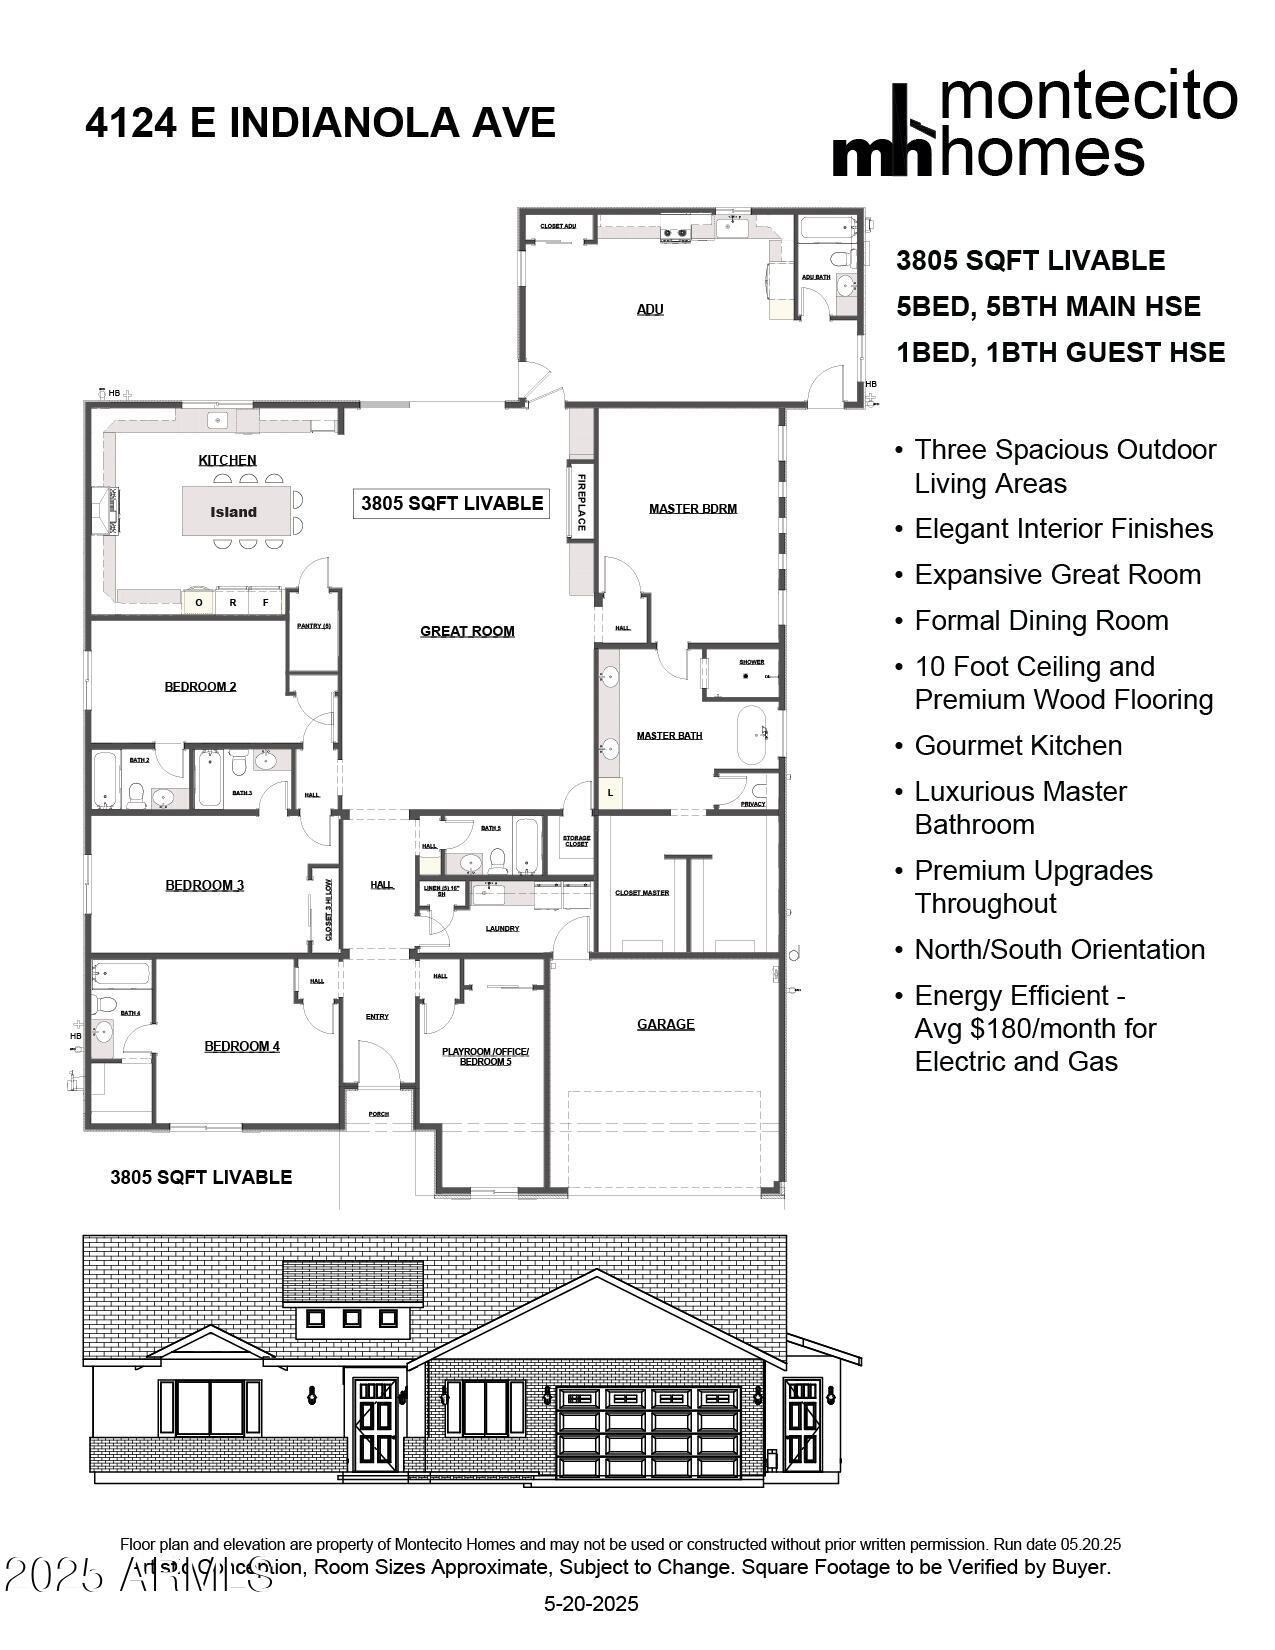
Active
$1,995,000
5
bds
|
5
ba
|
3,805
sqft
|
built
2025
4124 E Indianola Ave, Phoenix, AZ 85018
$-9,036
Cash flow
-23.6%
Cash-on-Cash Return
0.9%
Cap rate
0.1%
Rent to Value Ratio
Active
$950,000
3
bds
|
2
ba
|
2,042
sqft
|
built
2020
3411 E Louise Dr, Phoenix, AZ 85050
$-2,577
Cash flow
-14.2%
Cash-on-Cash Return
3.0%
Cap rate
0.4%
Rent to Value Ratio

Active
$620,000
4
bds
|
3
ba
|
2,303
sqft
|
built
1950
3115 N 26th St, Phoenix, AZ 85016
$-1,673
Cash flow
-14.1%
Cash-on-Cash Return
3.1%
Cap rate
0.4%
Rent to Value Ratio
Active
$325,000
2
bds
|
2
ba
|
950
sqft
|
built
1984
7557 N Dreamy Draw Dr, Phoenix, AZ 85020
$-941
Cash flow
-15.1%
Cash-on-Cash Return
2.8%
Cap rate
0.5%
Rent to Value Ratio
Active
$267,000
2
bds
|
2
ba
|
1,038
sqft
|
built
1986
10410 N Cave Creek Rd, Phoenix, AZ 85020
$-571
Cash flow
-11.2%
Cash-on-Cash Return
3.7%
Cap rate
0.7%
Rent to Value Ratio
Active
$1,350,000
4
bds
|
3
ba
|
3,545
sqft
|
built
2004
39419 N 7th Ave, Phoenix, AZ 85086
$-4,533
Cash flow
-17.5%
Cash-on-Cash Return
2.3%
Cap rate
0.3%
Rent to Value Ratio

Active
$724,900
5
bds
|
3
ba
|
2,839
sqft
|
built
1999
1834 W Nighthawk Way, Phoenix, AZ 85045
$-1,675
Cash flow
-12.1%
Cash-on-Cash Return
3.5%
Cap rate
0.5%
Rent to Value Ratio
Active
$500,000
2
bds
|
1
ba
|
896
sqft
|
built
1955
4832 E Cambridge Ave, Phoenix, AZ 85008
$-1,489
Cash flow
-15.5%
Cash-on-Cash Return
2.7%
Cap rate
0.4%
Rent to Value Ratio
Active
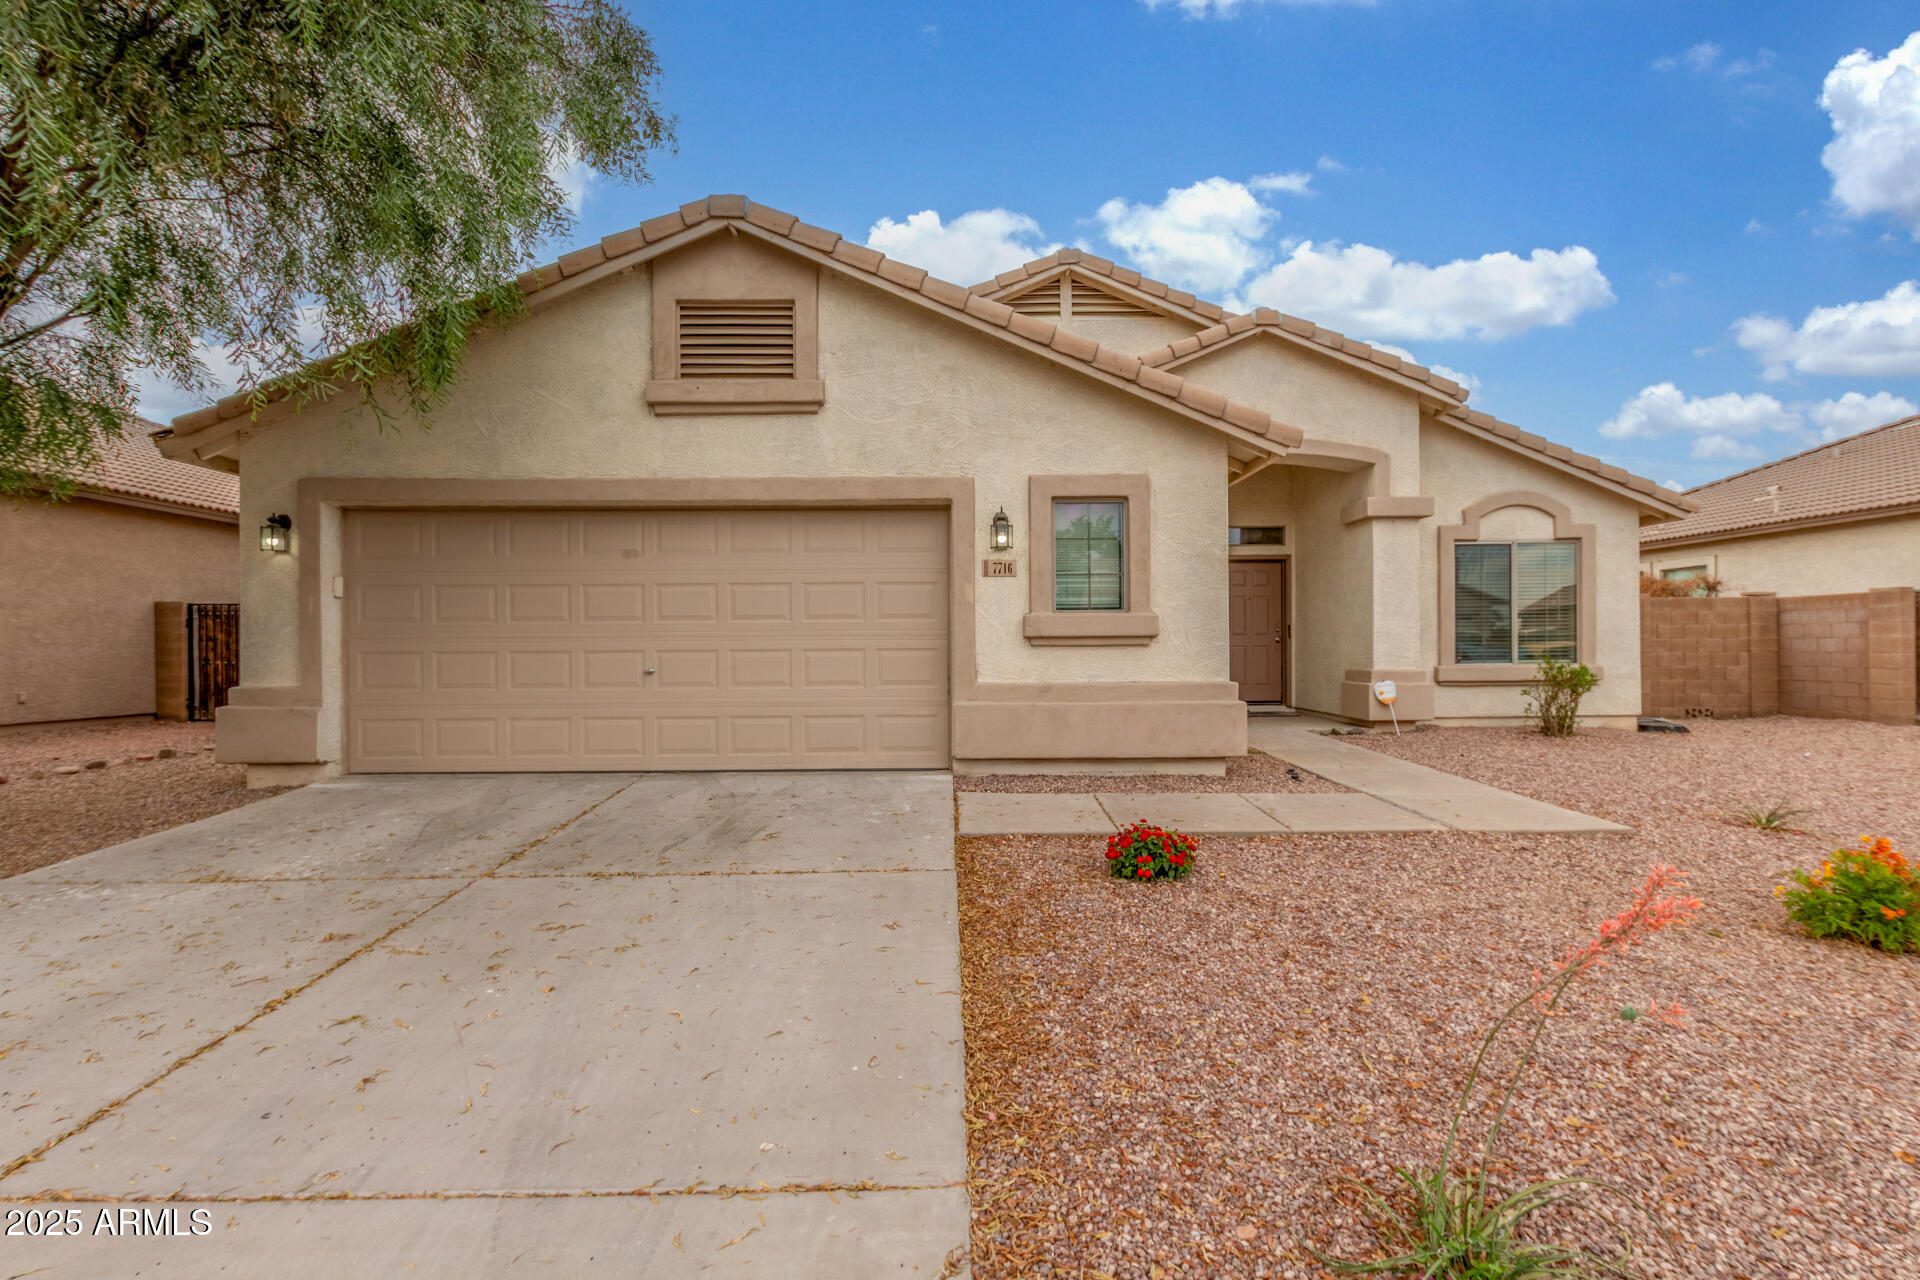
$400,000
4
bds
|
2
ba
|
2,031
sqft
|
built
2004
7716 W Pueblo Ave, Phoenix, AZ 85043
$-952
Cash flow
-12.4%
Cash-on-Cash Return
3.4%
Cap rate
0.5%
Rent to Value Ratio
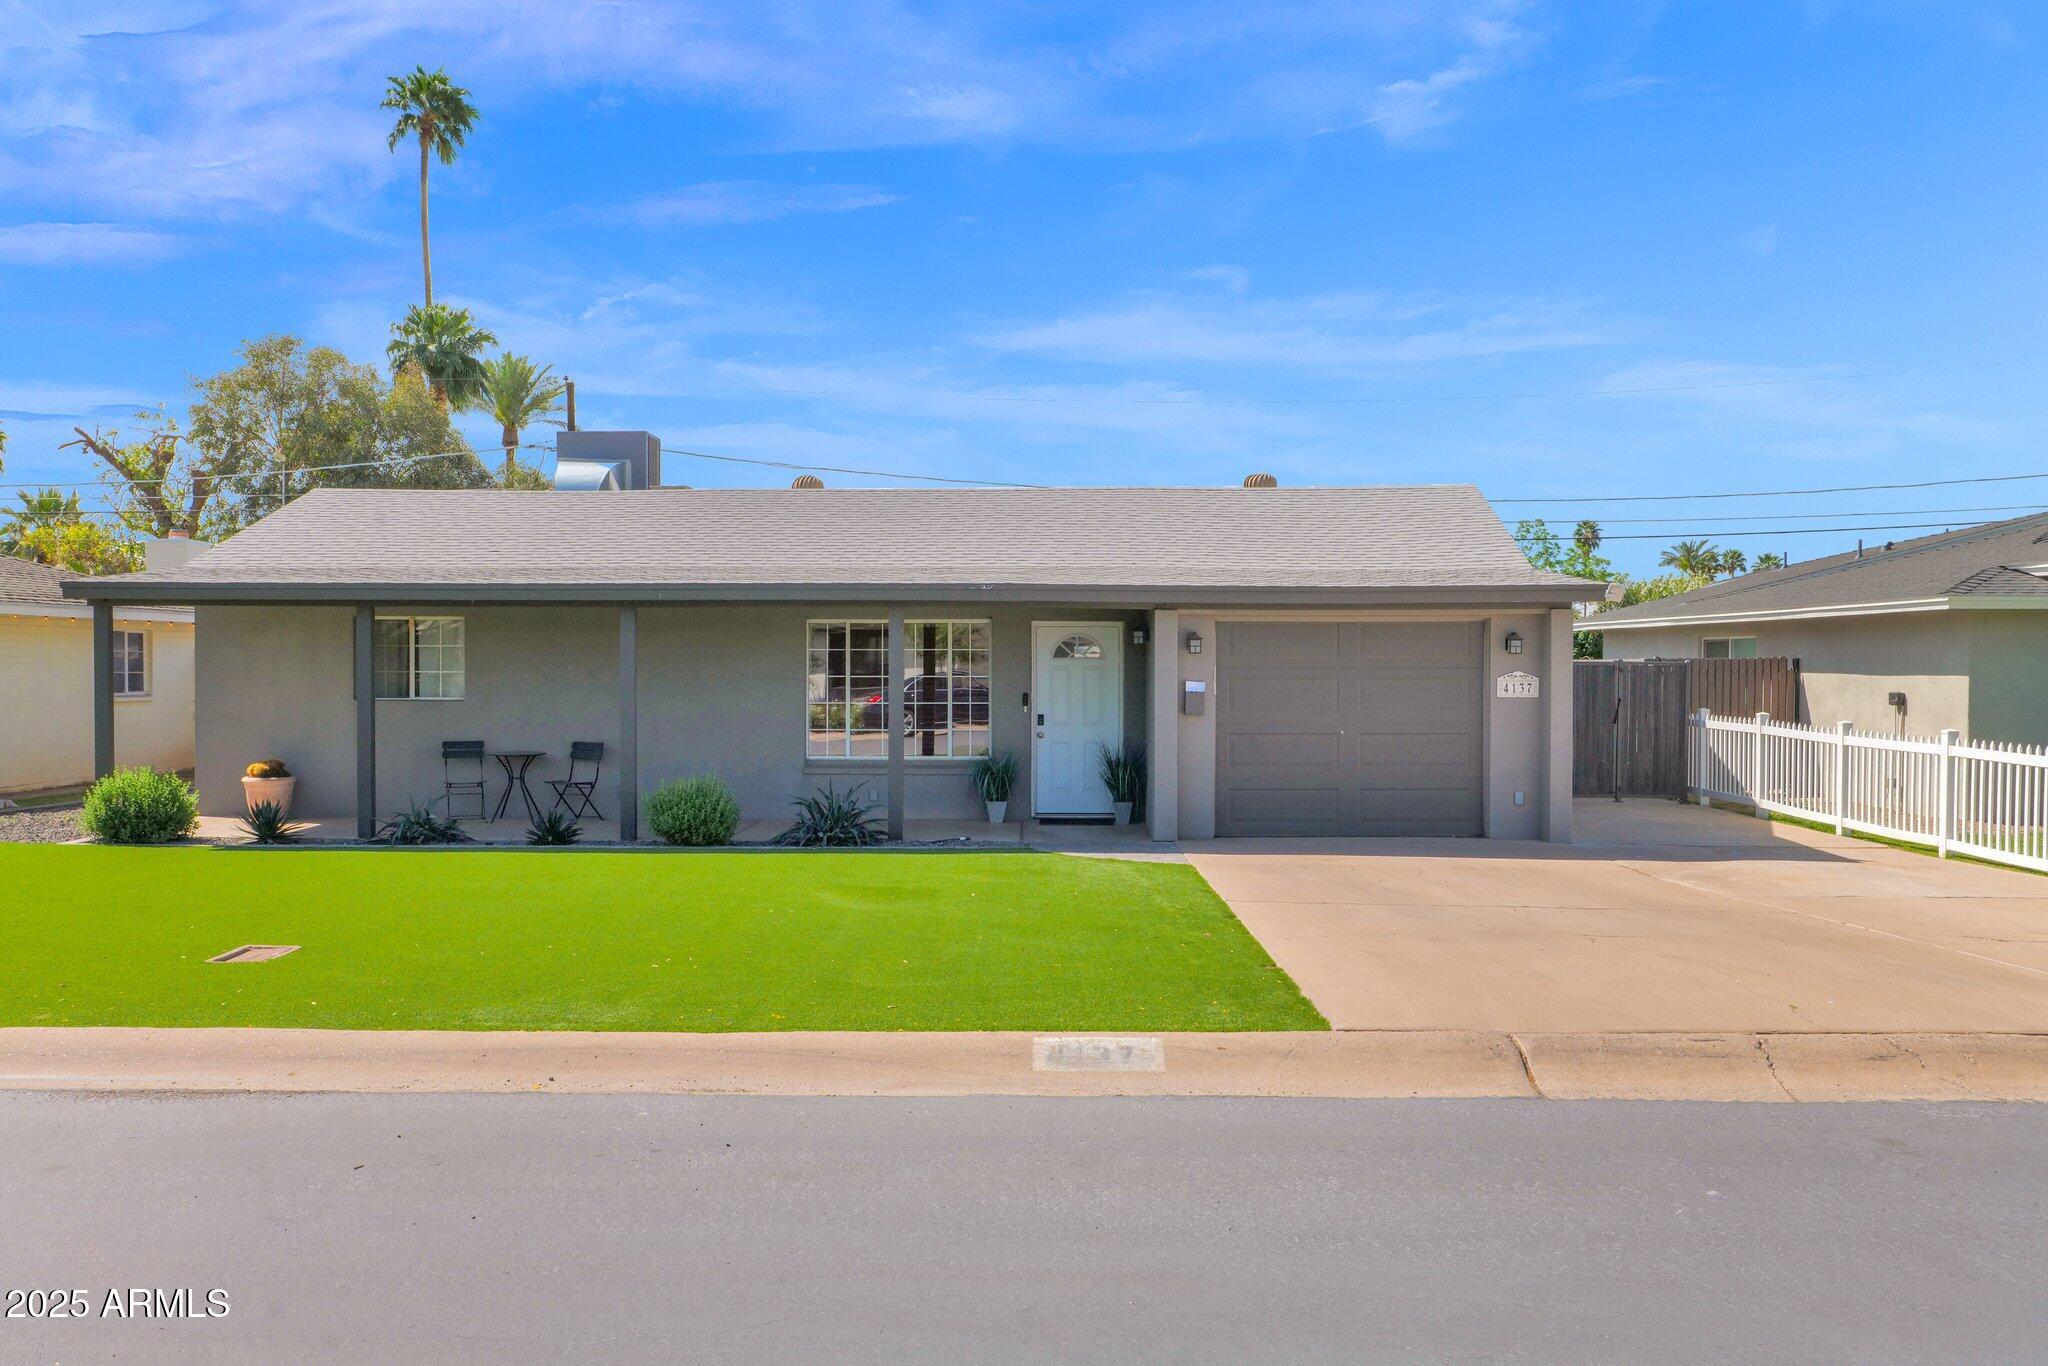
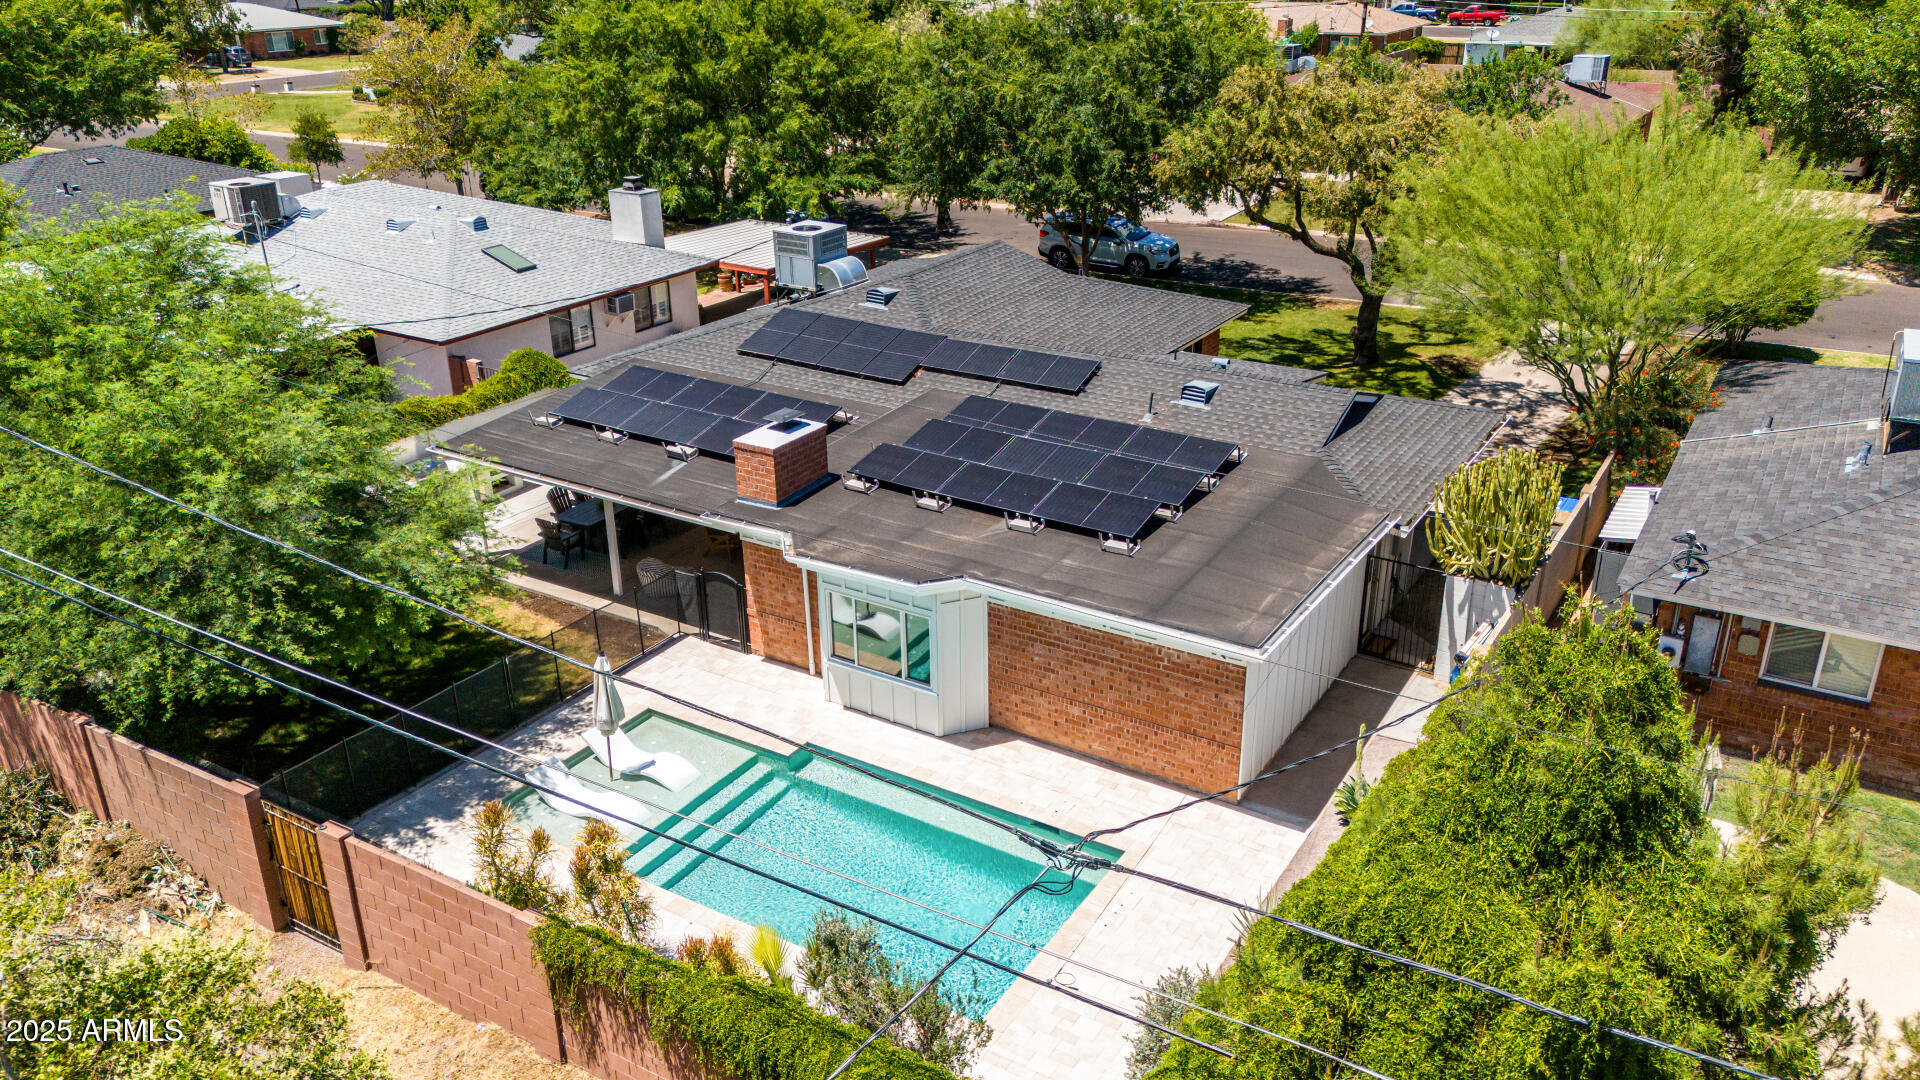
Active
$850,000
3
bds
|
2
ba
|
1,046
sqft
|
built
1955
4137 E Sells Dr, Phoenix, AZ 85018
$-2,605
Cash flow
-16.0%
Cash-on-Cash Return
2.6%
Cap rate
0.3%
Rent to Value Ratio
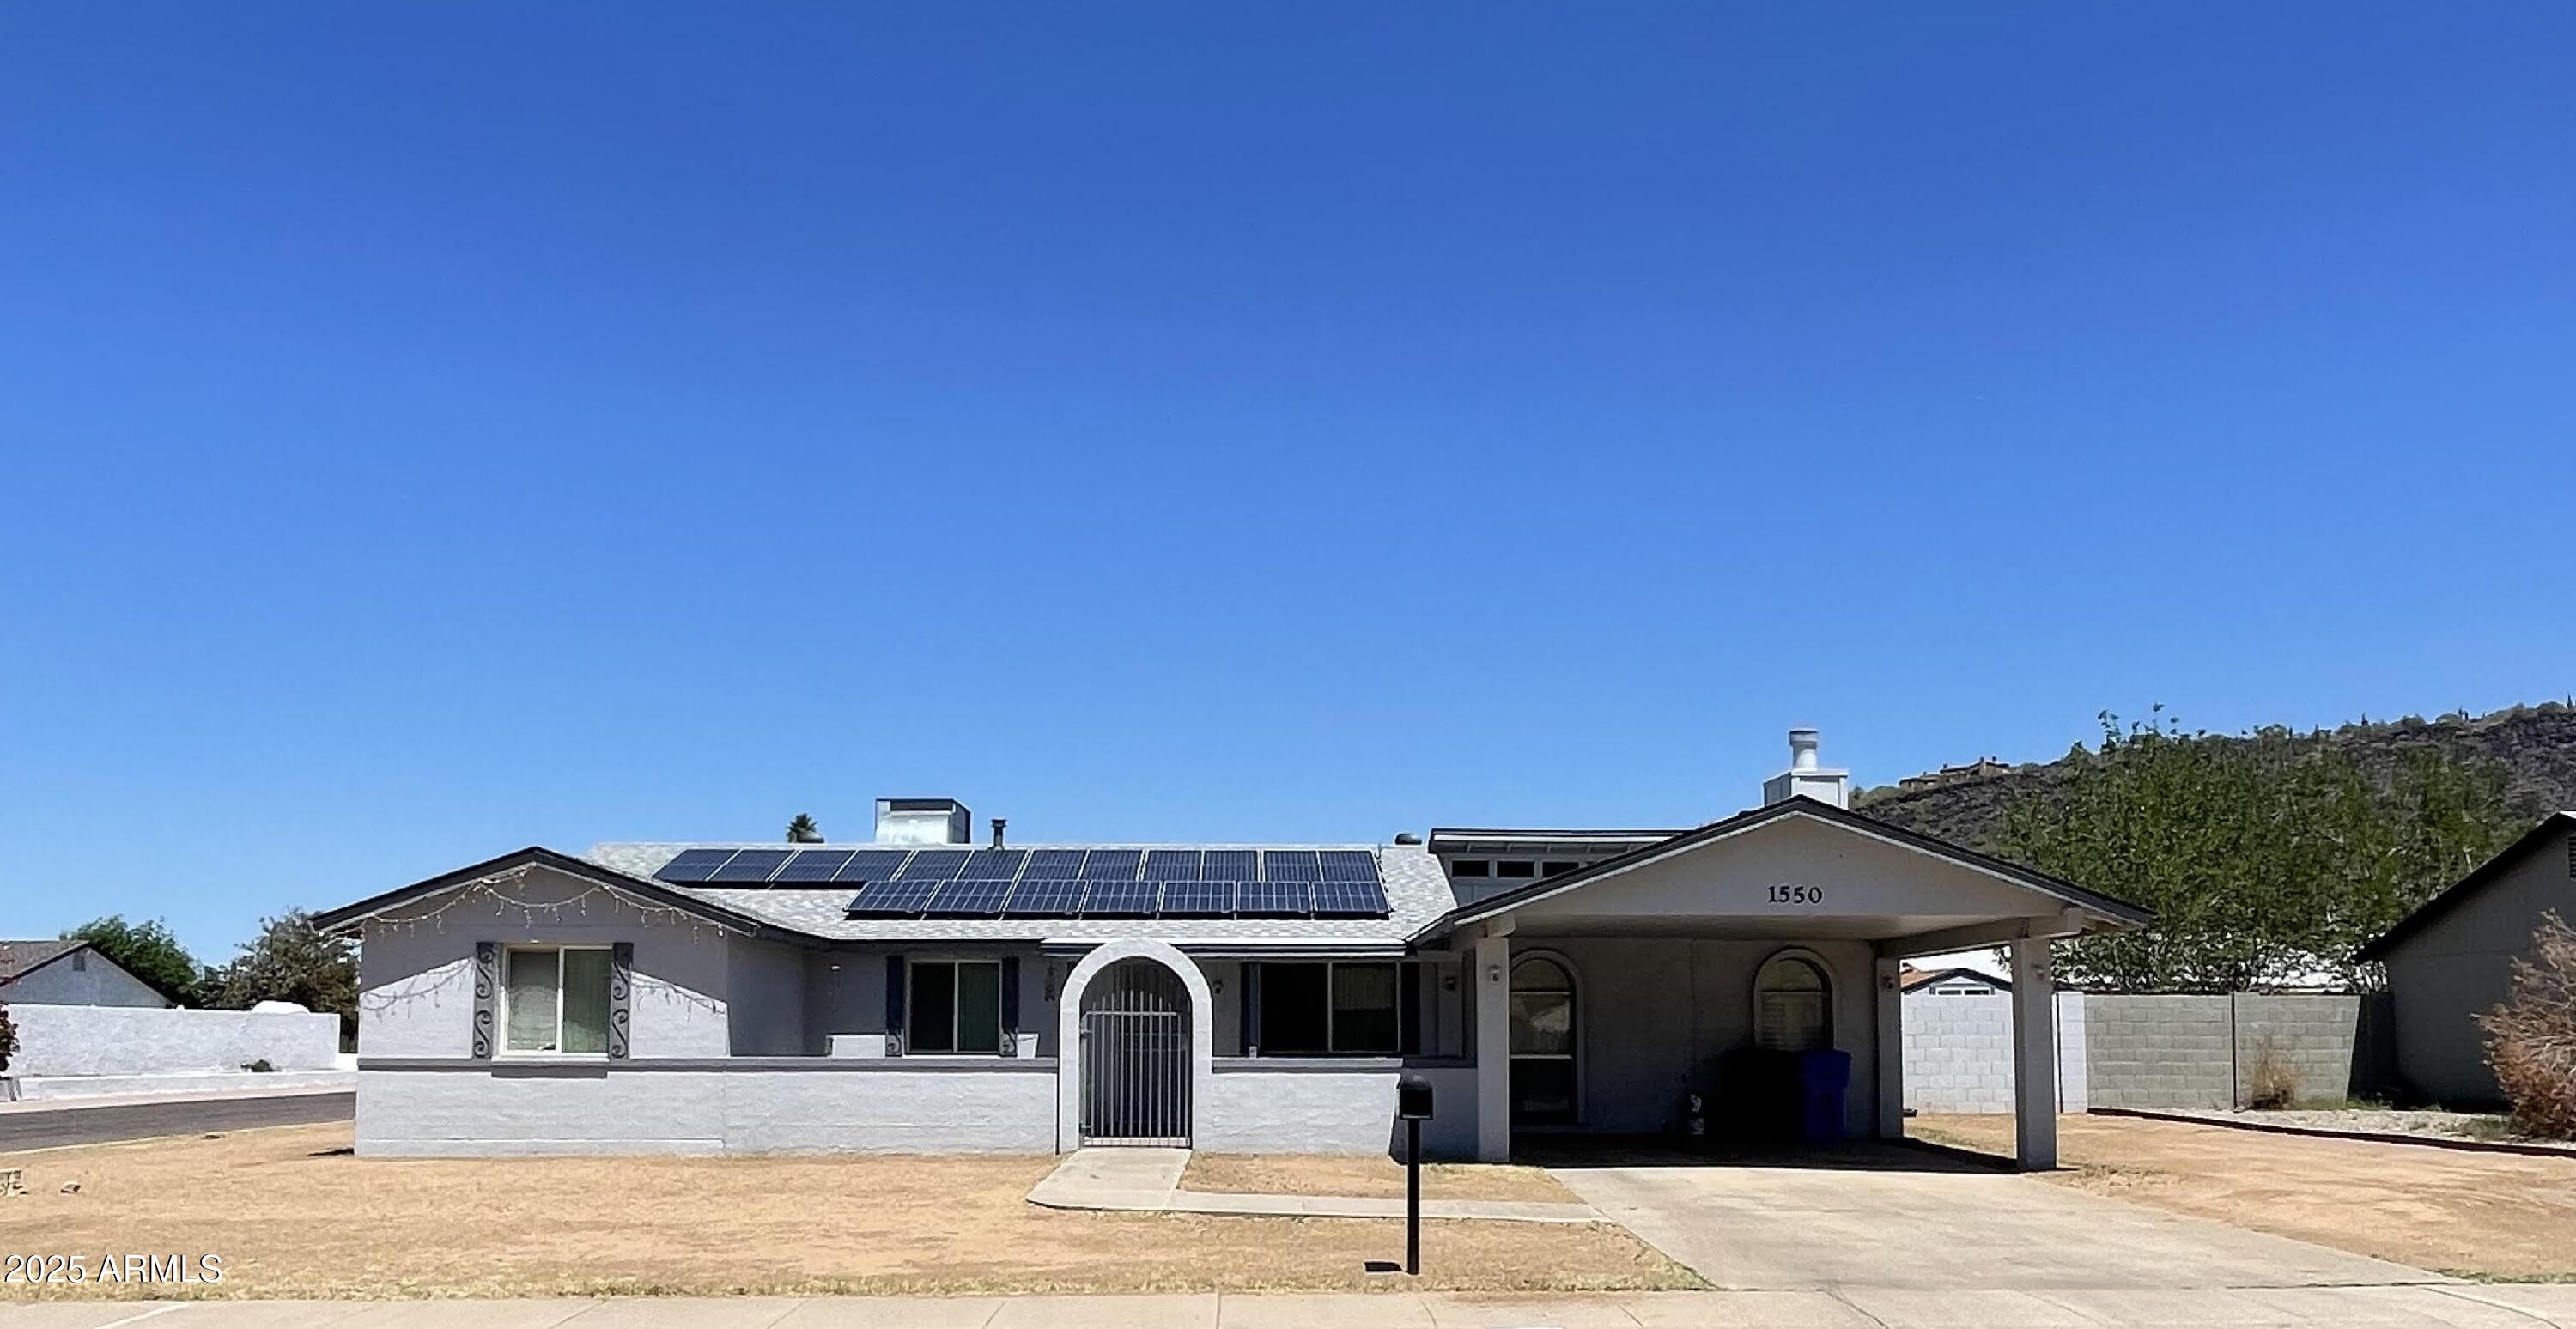
Active
$435,000
4
bds
|
2
ba
|
2,262
sqft
|
built
1970
1550 W Willow Ave, Phoenix, AZ 85029
$-1,051
Cash flow
-12.6%
Cash-on-Cash Return
3.4%
Cap rate
0.5%
Rent to Value Ratio
Active
$259,990
3
bds
|
2
ba
|
1,298
sqft
|
built
1972
2645 W Elm St, Phoenix, AZ 85017
$-470
Cash flow
-9.4%
Cash-on-Cash Return
4.1%
Cap rate
0.7%
Rent to Value Ratio
Active
$899,000
3
bds
|
2
ba
|
1,977
sqft
|
built
1952
1839 E Palo Verde Dr, Phoenix, AZ 85016
$-2,261
Cash flow
-13.1%
Cash-on-Cash Return
3.3%
Cap rate
0.4%
Rent to Value Ratio
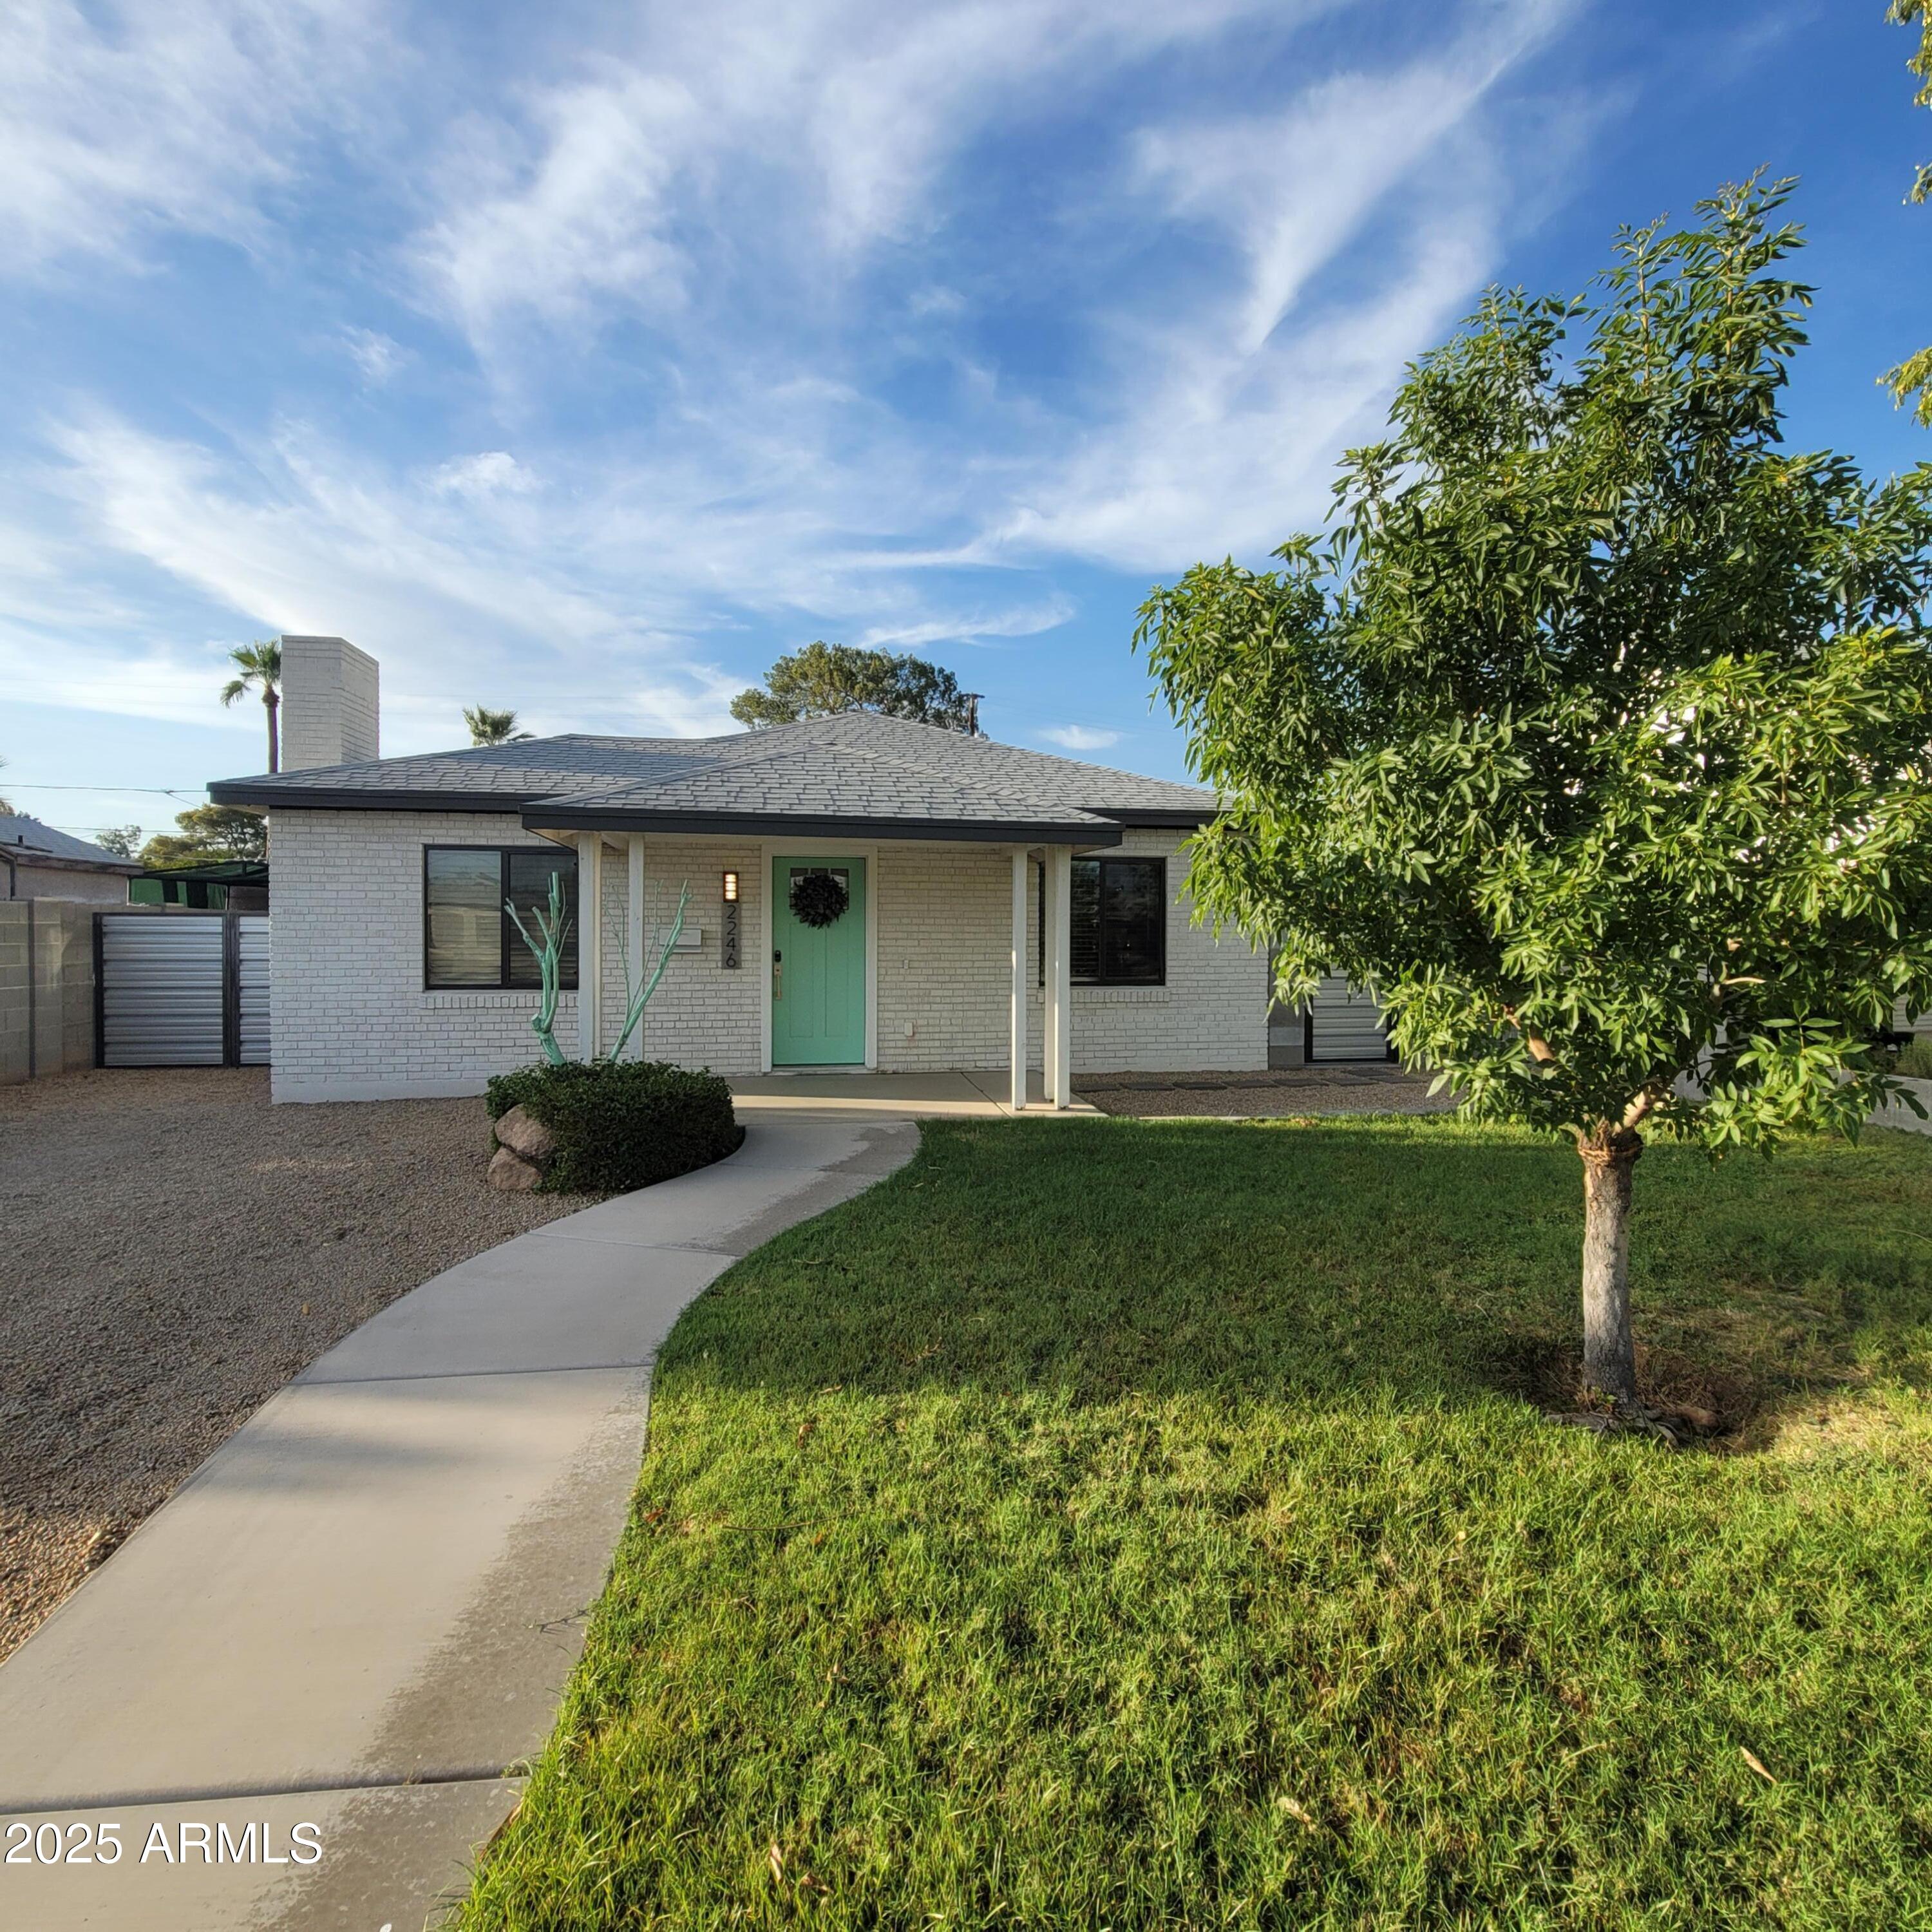
Active
$445,000
2
bds
|
1
ba
|
1,009
sqft
|
built
1940
2246 E Yale St, Phoenix, AZ 85006
$-651
Cash flow
-7.6%
Cash-on-Cash Return
4.5%
Cap rate
0.6%
Rent to Value Ratio
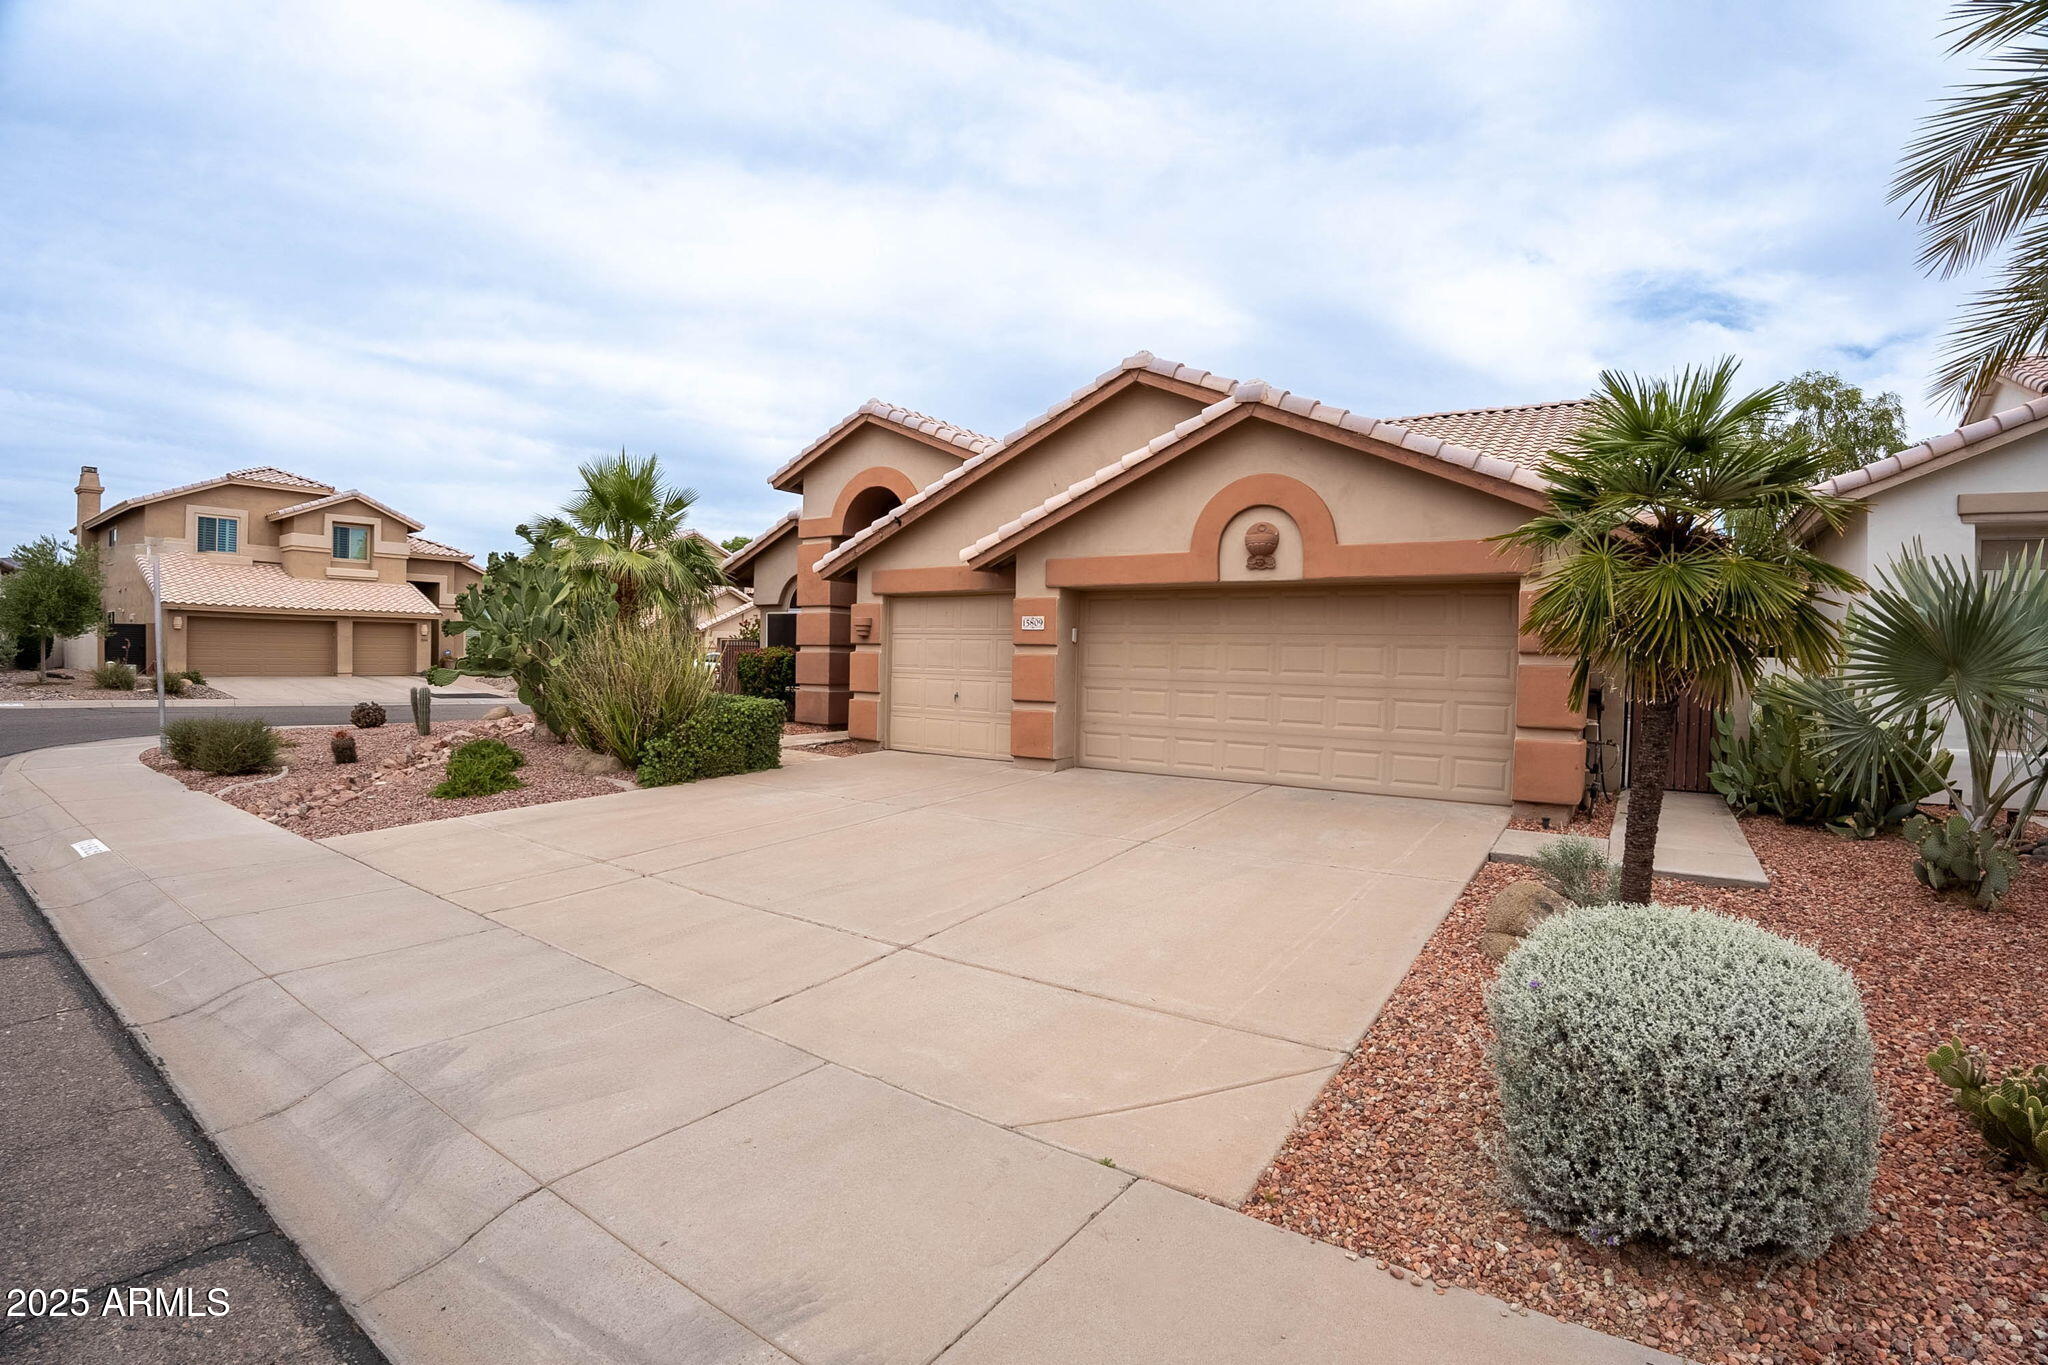
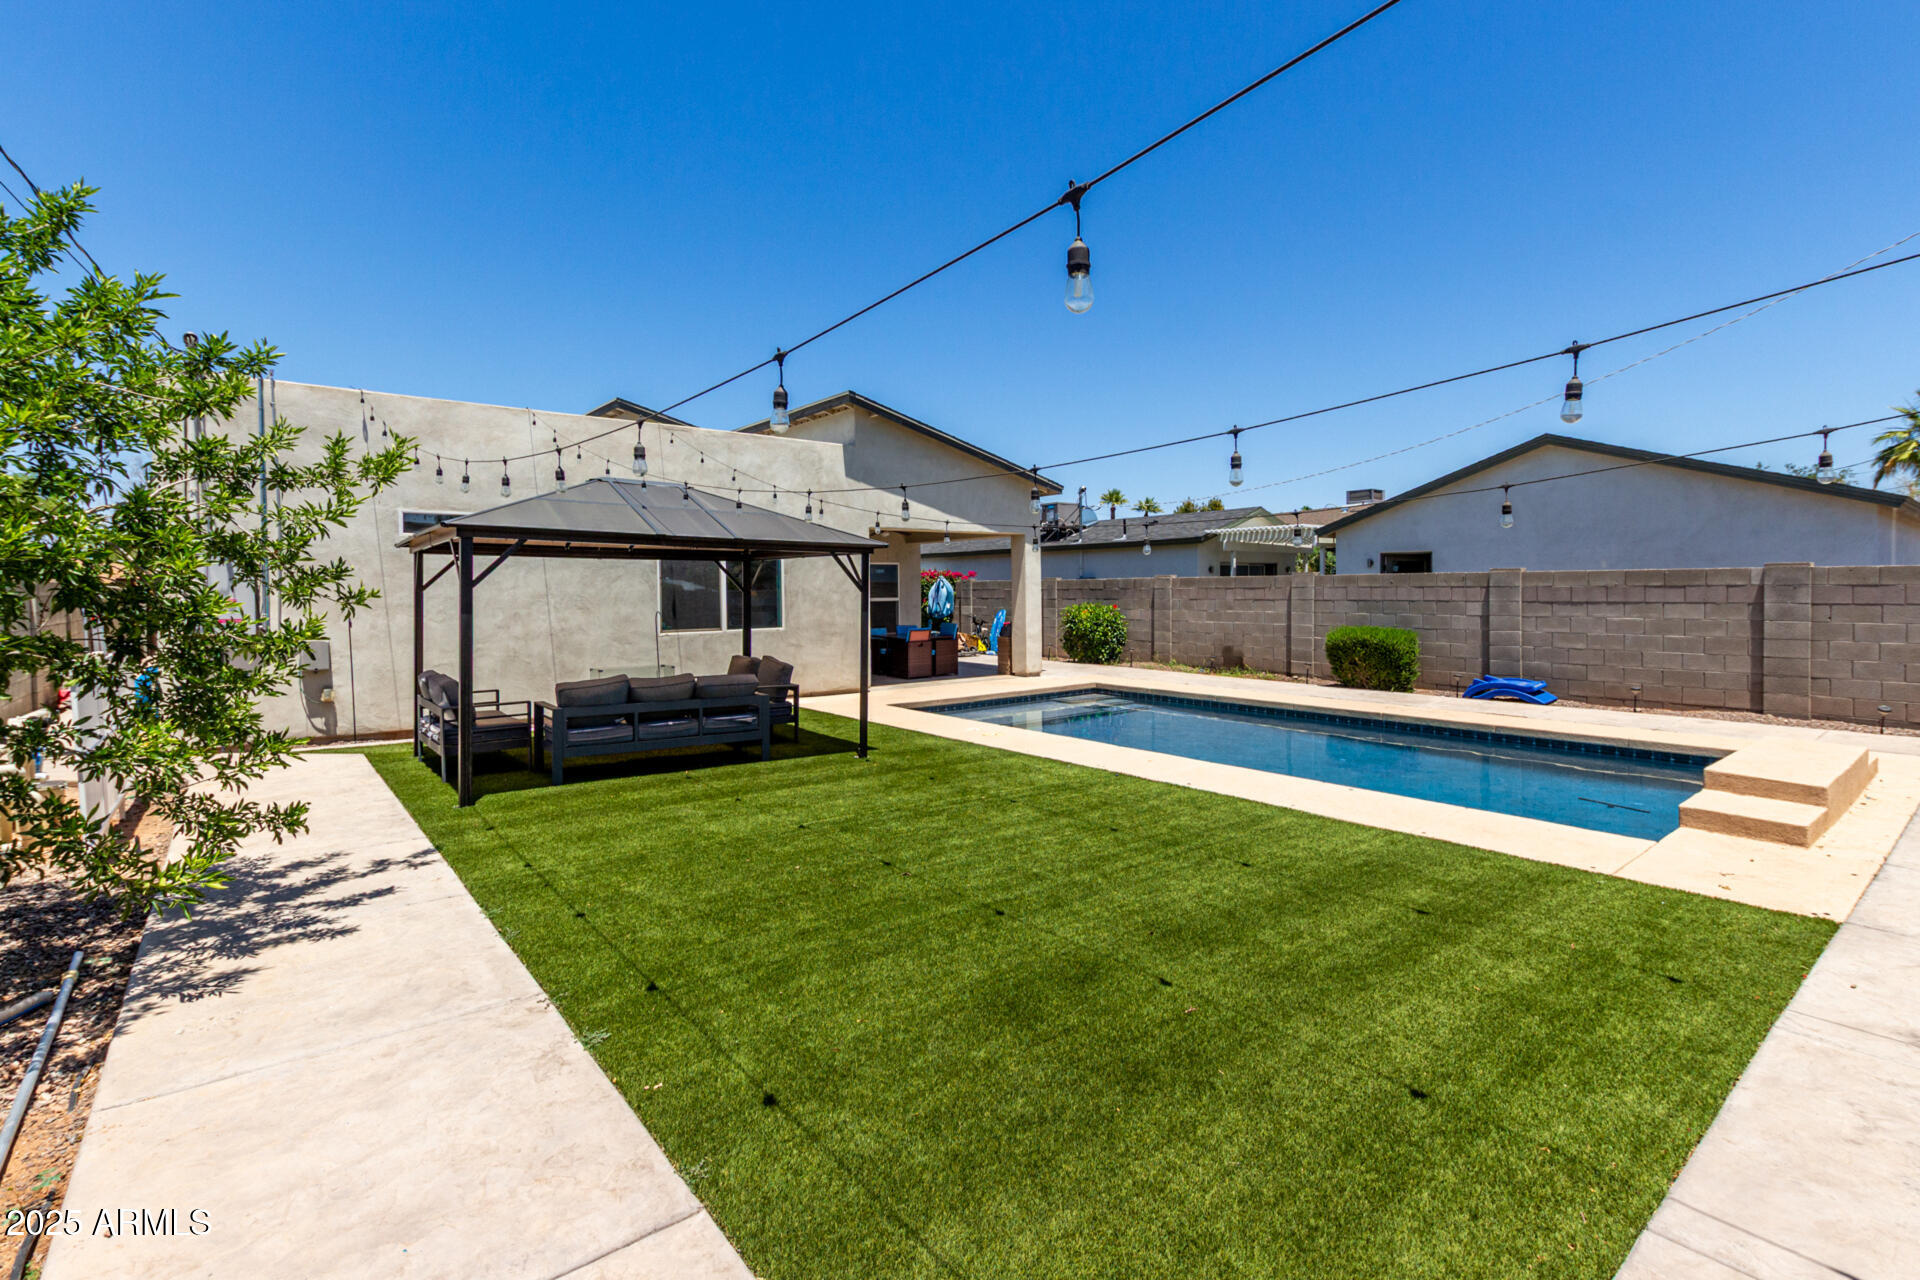
Active
$675,000
4
bds
|
2
ba
|
2,236
sqft
|
built
1995
15809 S 31st St, Phoenix, AZ 85048
$-1,844
Cash flow
-14.3%
Cash-on-Cash Return
3.0%
Cap rate
0.4%
Rent to Value Ratio

Active
$570,000
3
bds
|
3
ba
|
2,177
sqft
|
built
1988
33 W Missouri Ave, Phoenix, AZ 85013
$-1,963
Cash flow
-18.0%
Cash-on-Cash Return
2.2%
Cap rate
0.5%
Rent to Value Ratio
Active
$275,000
2
bds
|
2
ba
|
790
sqft
|
built
2003
1701 E Colter St, Phoenix, AZ 85016
$-533
Cash flow
-10.1%
Cash-on-Cash Return
4.0%
Cap rate
0.7%
Rent to Value Ratio

Active
$999,000
4
bds
|
3
ba
|
2,859
sqft
|
built
1975
7232 N 22nd St, Phoenix, AZ 85020
$-2,704
Cash flow
-14.1%
Cash-on-Cash Return
3.0%
Cap rate
0.4%
Rent to Value Ratio
Active
$889,000
4
bds
|
4
ba
|
2,070
sqft
|
built
2018
1005 E Weldon Ave, Phoenix, AZ 85014
$-2,121
Cash flow
-12.4%
Cash-on-Cash Return
3.4%
Cap rate
0.5%
Rent to Value Ratio