Phoenix, AZ Investment Properties for Sale
Browse homes for sale and investment properties in Phoenix, AZ. Refine your search by price, property type, or more.
Best cash flowing properties in Phoenix, AZ
Active
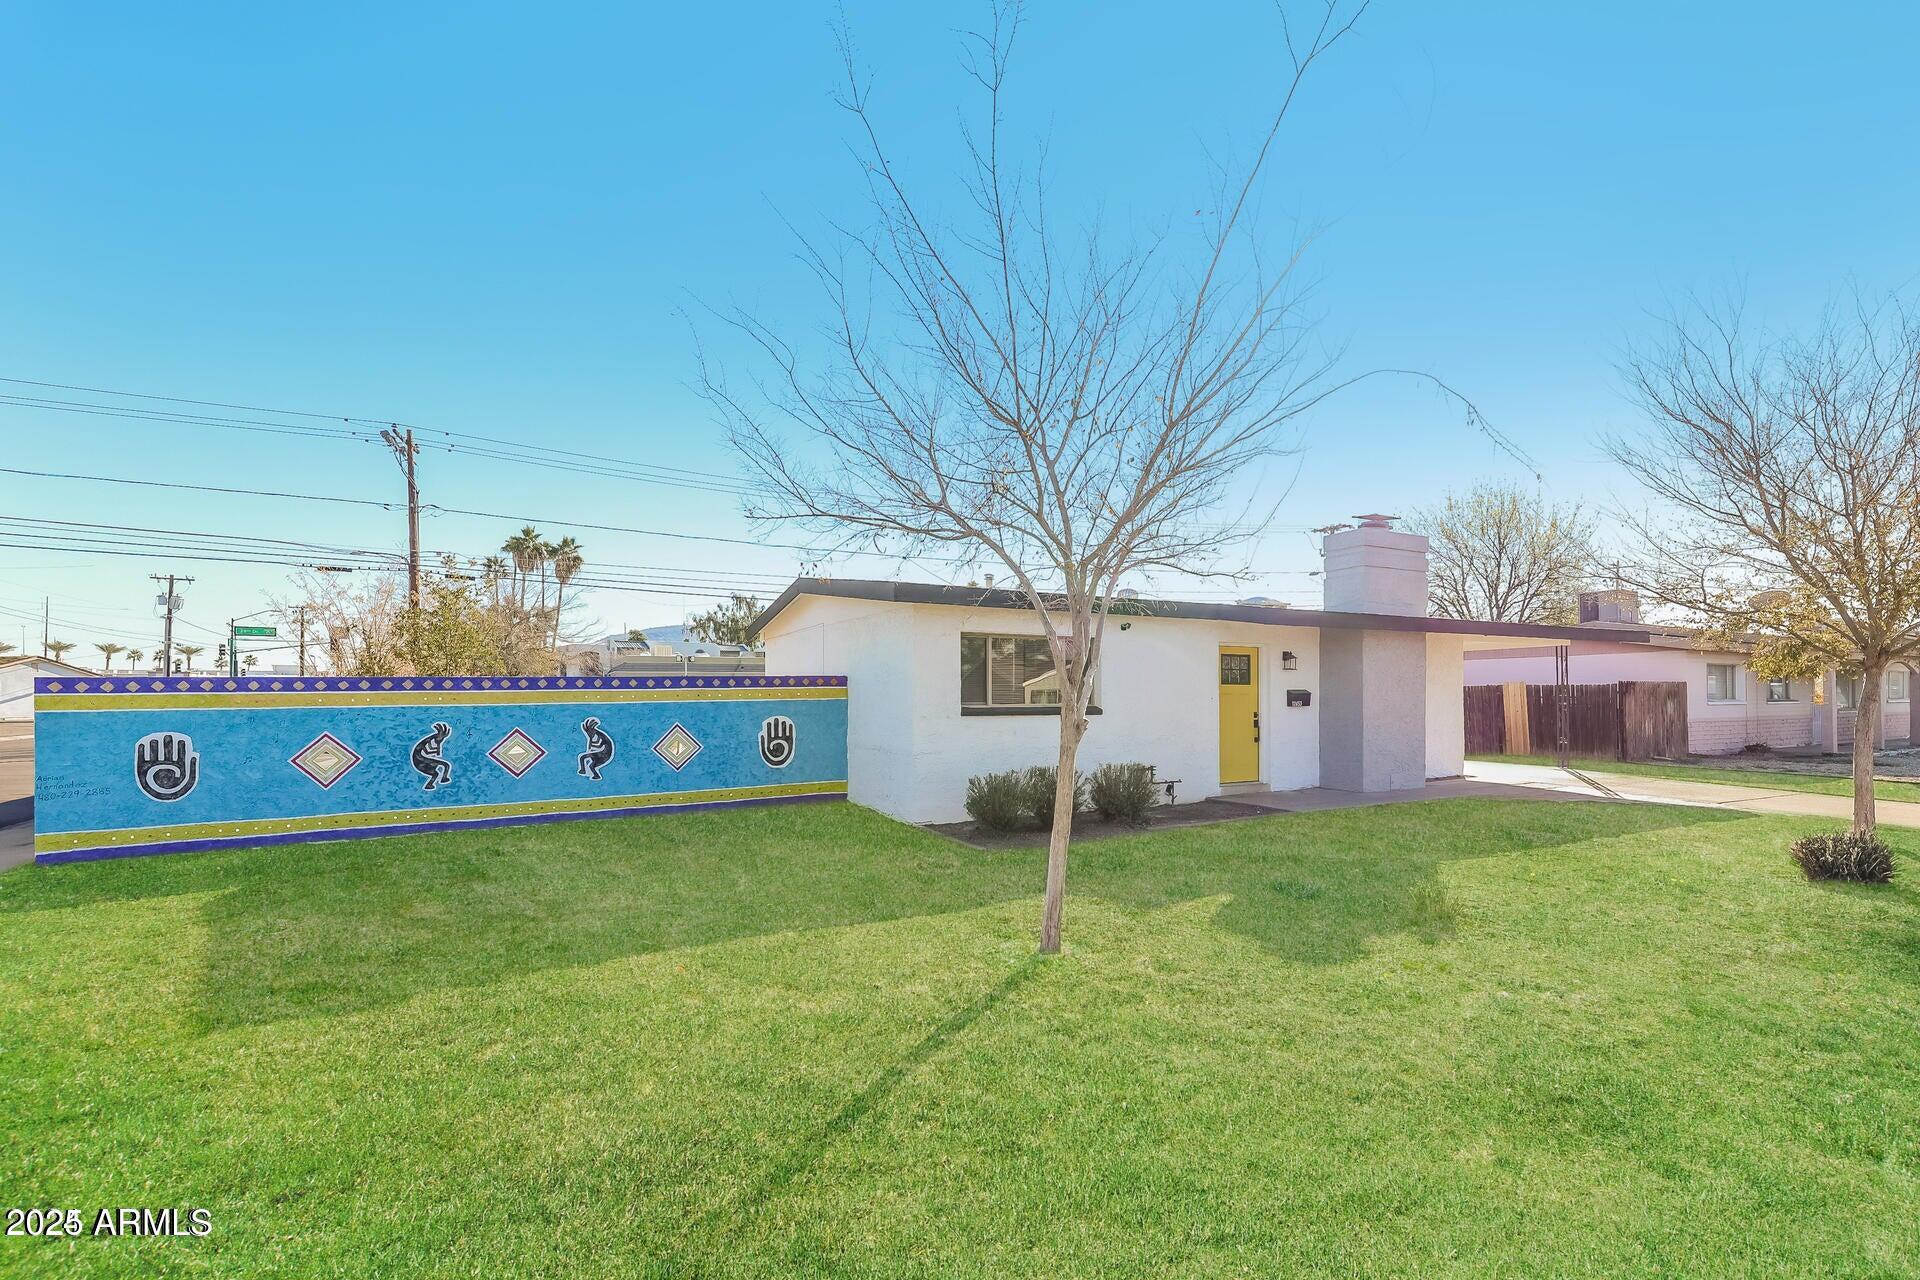
$300,000
2
bds
|
1
ba
|
816
sqft
|
built
1962
12453 N 29th Ave, Phoenix, AZ 85029
$-233
Cash flow
-4.1%
Cash-on-Cash Return
4.7%
Cap rate
0.6%
Rent to Value Ratio
Active
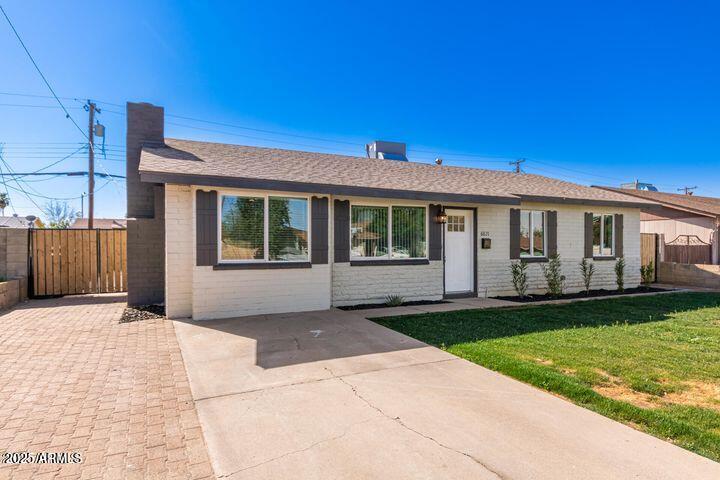
$398,000
5
bds
|
2
ba
|
1,674
sqft
|
built
1960
6821 W Mariposa St, Phoenix, AZ 85033
$-254
Cash flow
-3.3%
Cash-on-Cash Return
4.9%
Cap rate
0.6%
Rent to Value Ratio
3,630 out of 3,913 properties for sale in Phoenix, AZ
Limited Results Shown
Create a free account, or log in to reveal all property listings and enjoy the complete experience.
Active
$375,000
3
bds
|
2
ba
|
1,320
sqft
|
built
1958
5029 W Osborn Rd, Phoenix, AZ 85031
$-734
Cash flow
-10.2%
Cash-on-Cash Return
3.3%
Cap rate
0.4%
Rent to Value Ratio
Active
$520,000
3
bds
|
2
ba
|
1,944
sqft
|
built
1979
2847 E Acoma Dr, Phoenix, AZ 85032
$-752
Cash flow
-7.5%
Cash-on-Cash Return
3.9%
Cap rate
0.5%
Rent to Value Ratio
Active
$897,000
5
bds
|
4
ba
|
3,613
sqft
|
built
2006
6619 W Cordia Ln, Phoenix, AZ 85083
$-2,243
Cash flow
-13.0%
Cash-on-Cash Return
2.7%
Cap rate
0.4%
Rent to Value Ratio
Active
$10,995,000
7
bds
|
9
ba
|
8,302
sqft
|
built
2023
4763 N 53rd St, Phoenix, AZ 85018
$-46,884
Cash flow
-22.2%
Cash-on-Cash Return
0.6%
Cap rate
0.1%
Rent to Value Ratio

Active
$469,999
4
bds
|
2
ba
|
1,930
sqft
|
built
2023
2335 W Sunland Ave, Phoenix, AZ 85041
$-945
Cash flow
-10.5%
Cash-on-Cash Return
3.3%
Cap rate
0.5%
Rent to Value Ratio
Active
$440,000
4
bds
|
2
ba
|
1,709
sqft
|
built
2018
802 W Buist Ave, Phoenix, AZ 85041
$-705
Cash flow
-8.4%
Cash-on-Cash Return
3.8%
Cap rate
0.5%
Rent to Value Ratio
Active
$409,000
2
bds
|
2
ba
|
953
sqft
|
built
2005
114 W Adams St, Phoenix, AZ 85003
$-1,539
Cash flow
-19.6%
Cash-on-Cash Return
1.2%
Cap rate
0.5%
Rent to Value Ratio
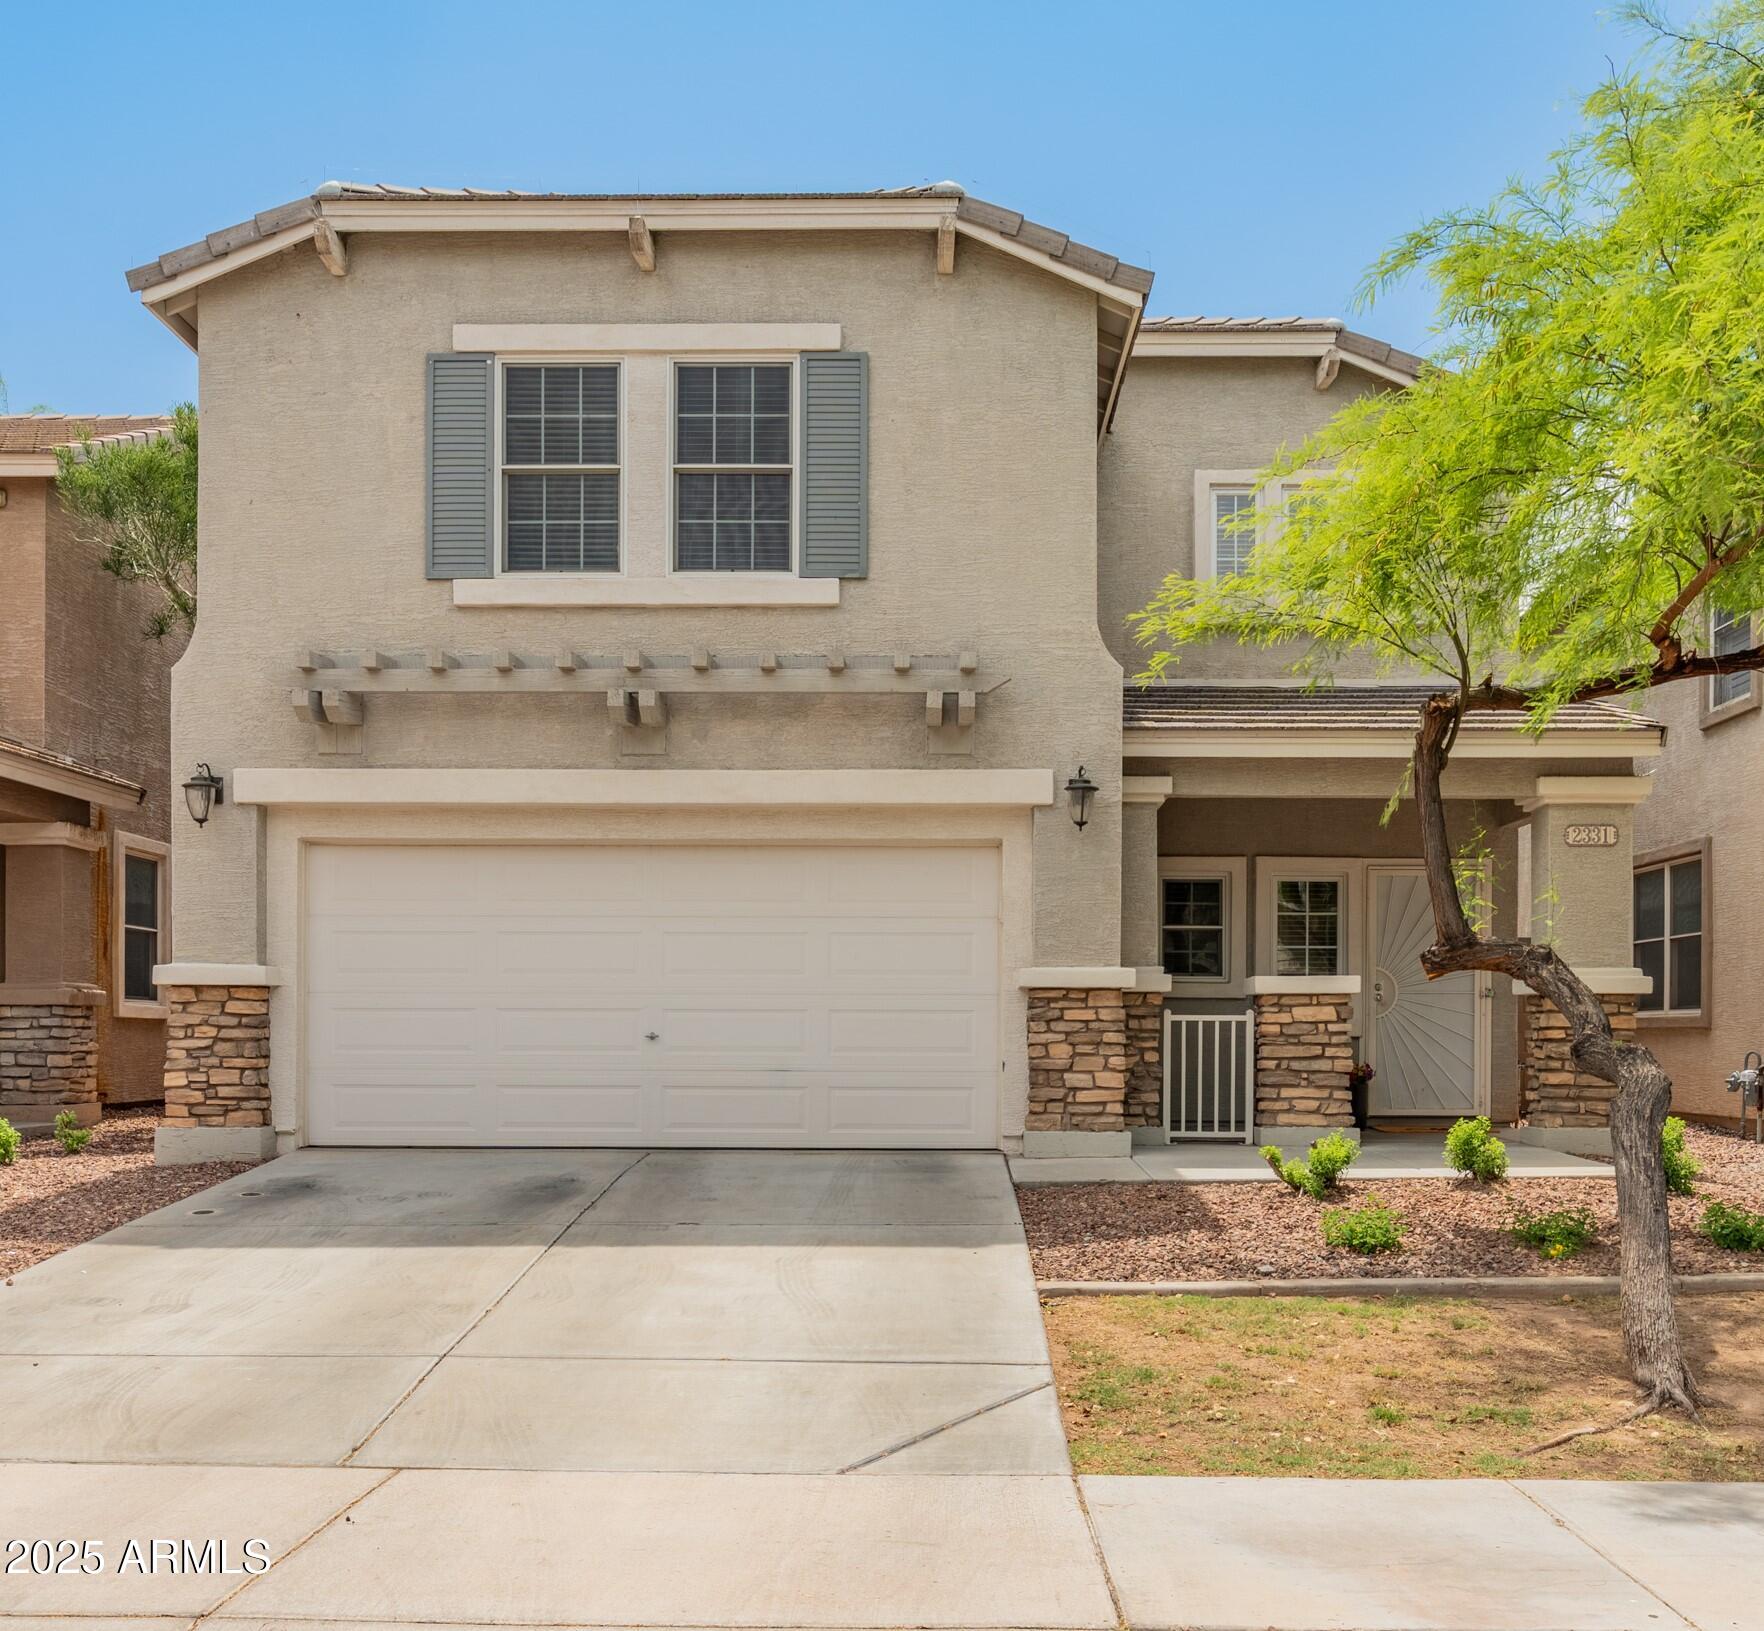
Active
$395,000
3
bds
|
3
ba
|
1,532
sqft
|
built
2006
2331 E Sunland Ave, Phoenix, AZ 85040
$-863
Cash flow
-11.4%
Cash-on-Cash Return
3.1%
Cap rate
0.5%
Rent to Value Ratio
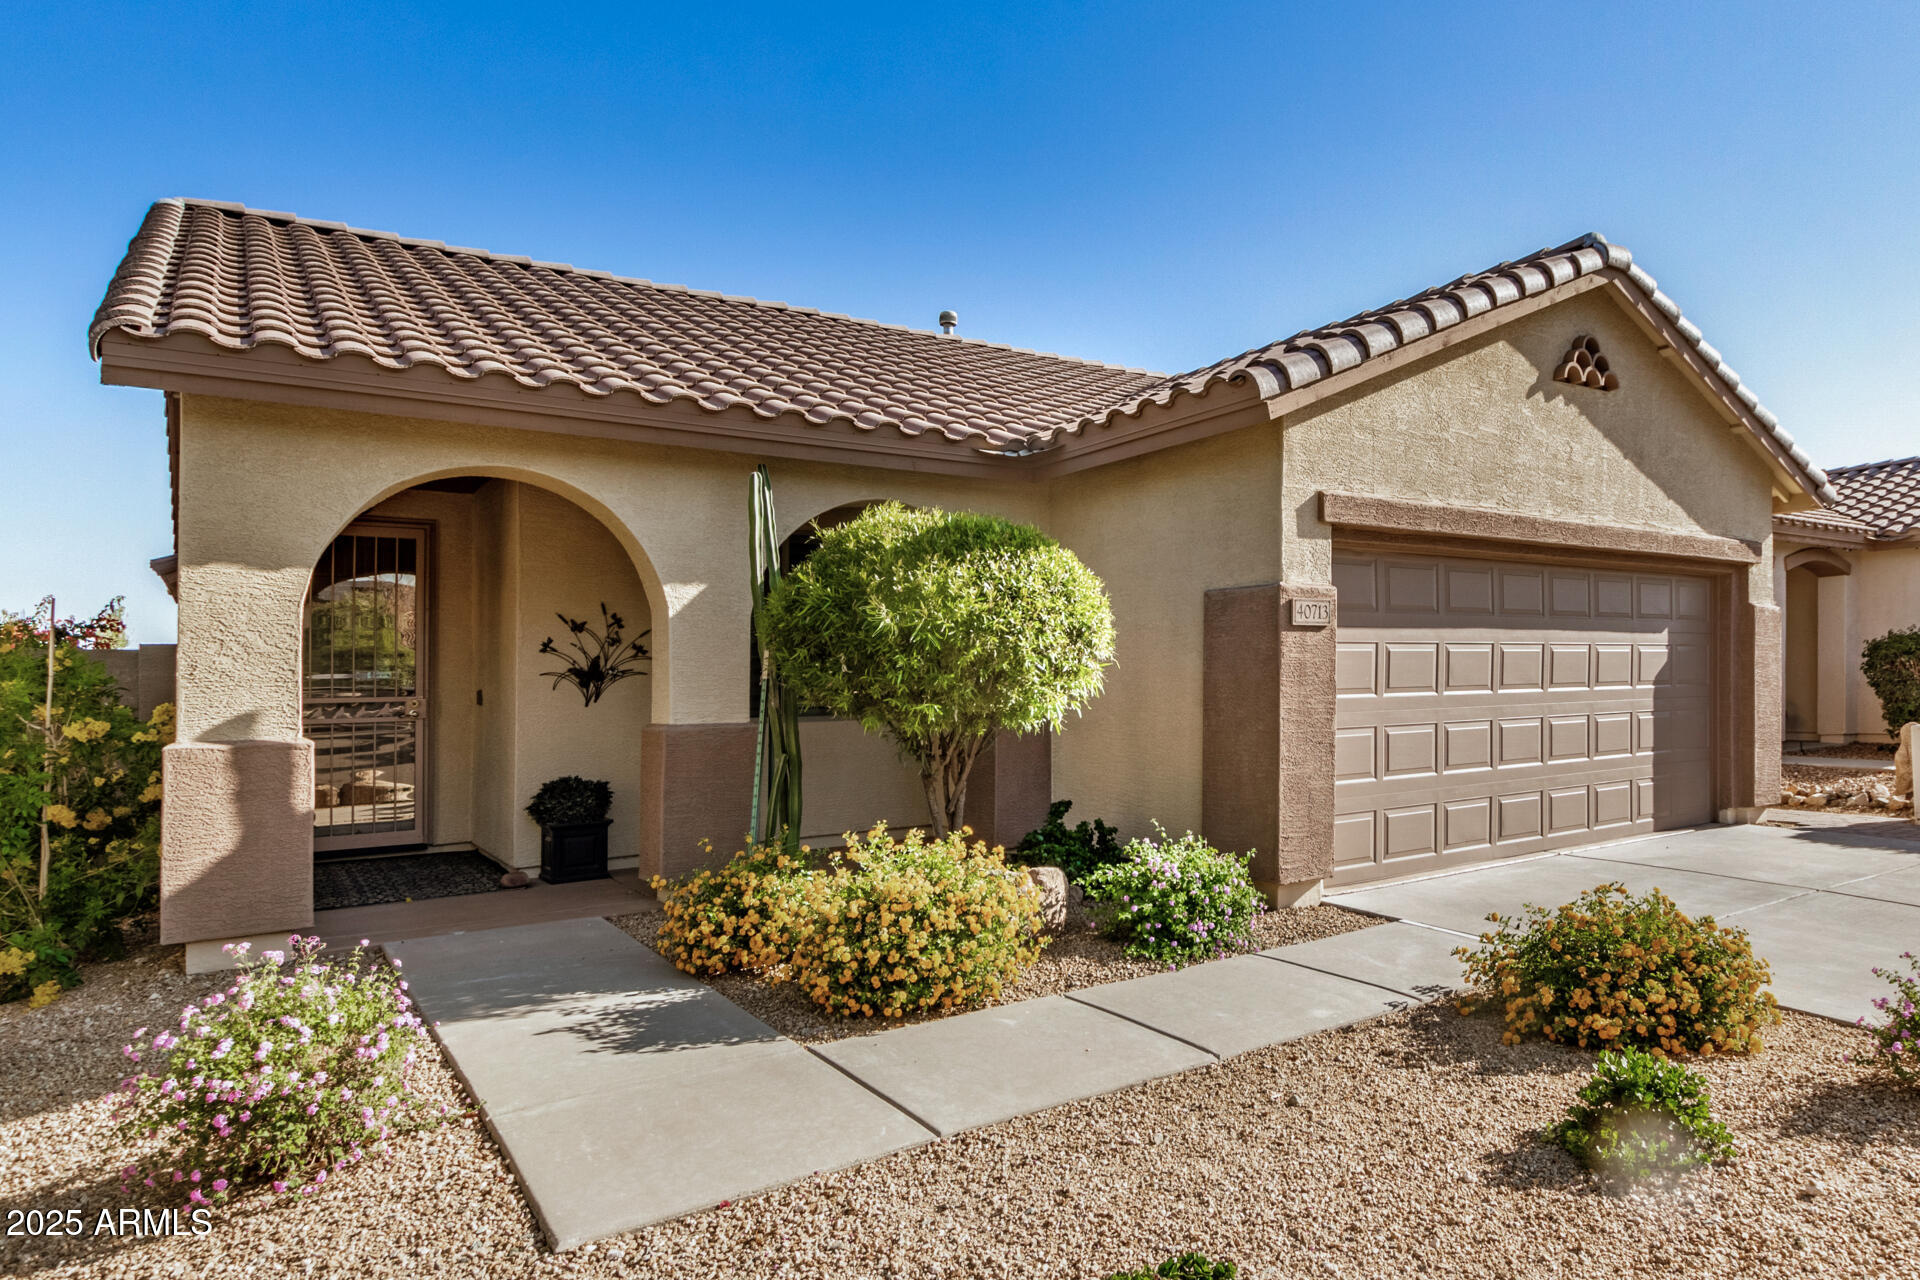
Active
$430,000
2
bds
|
2
ba
|
1,432
sqft
|
built
2003
40713 N Citrus Canyon Trl, Phoenix, AZ 85086
$-777
Cash flow
-9.4%
Cash-on-Cash Return
3.5%
Cap rate
0.5%
Rent to Value Ratio
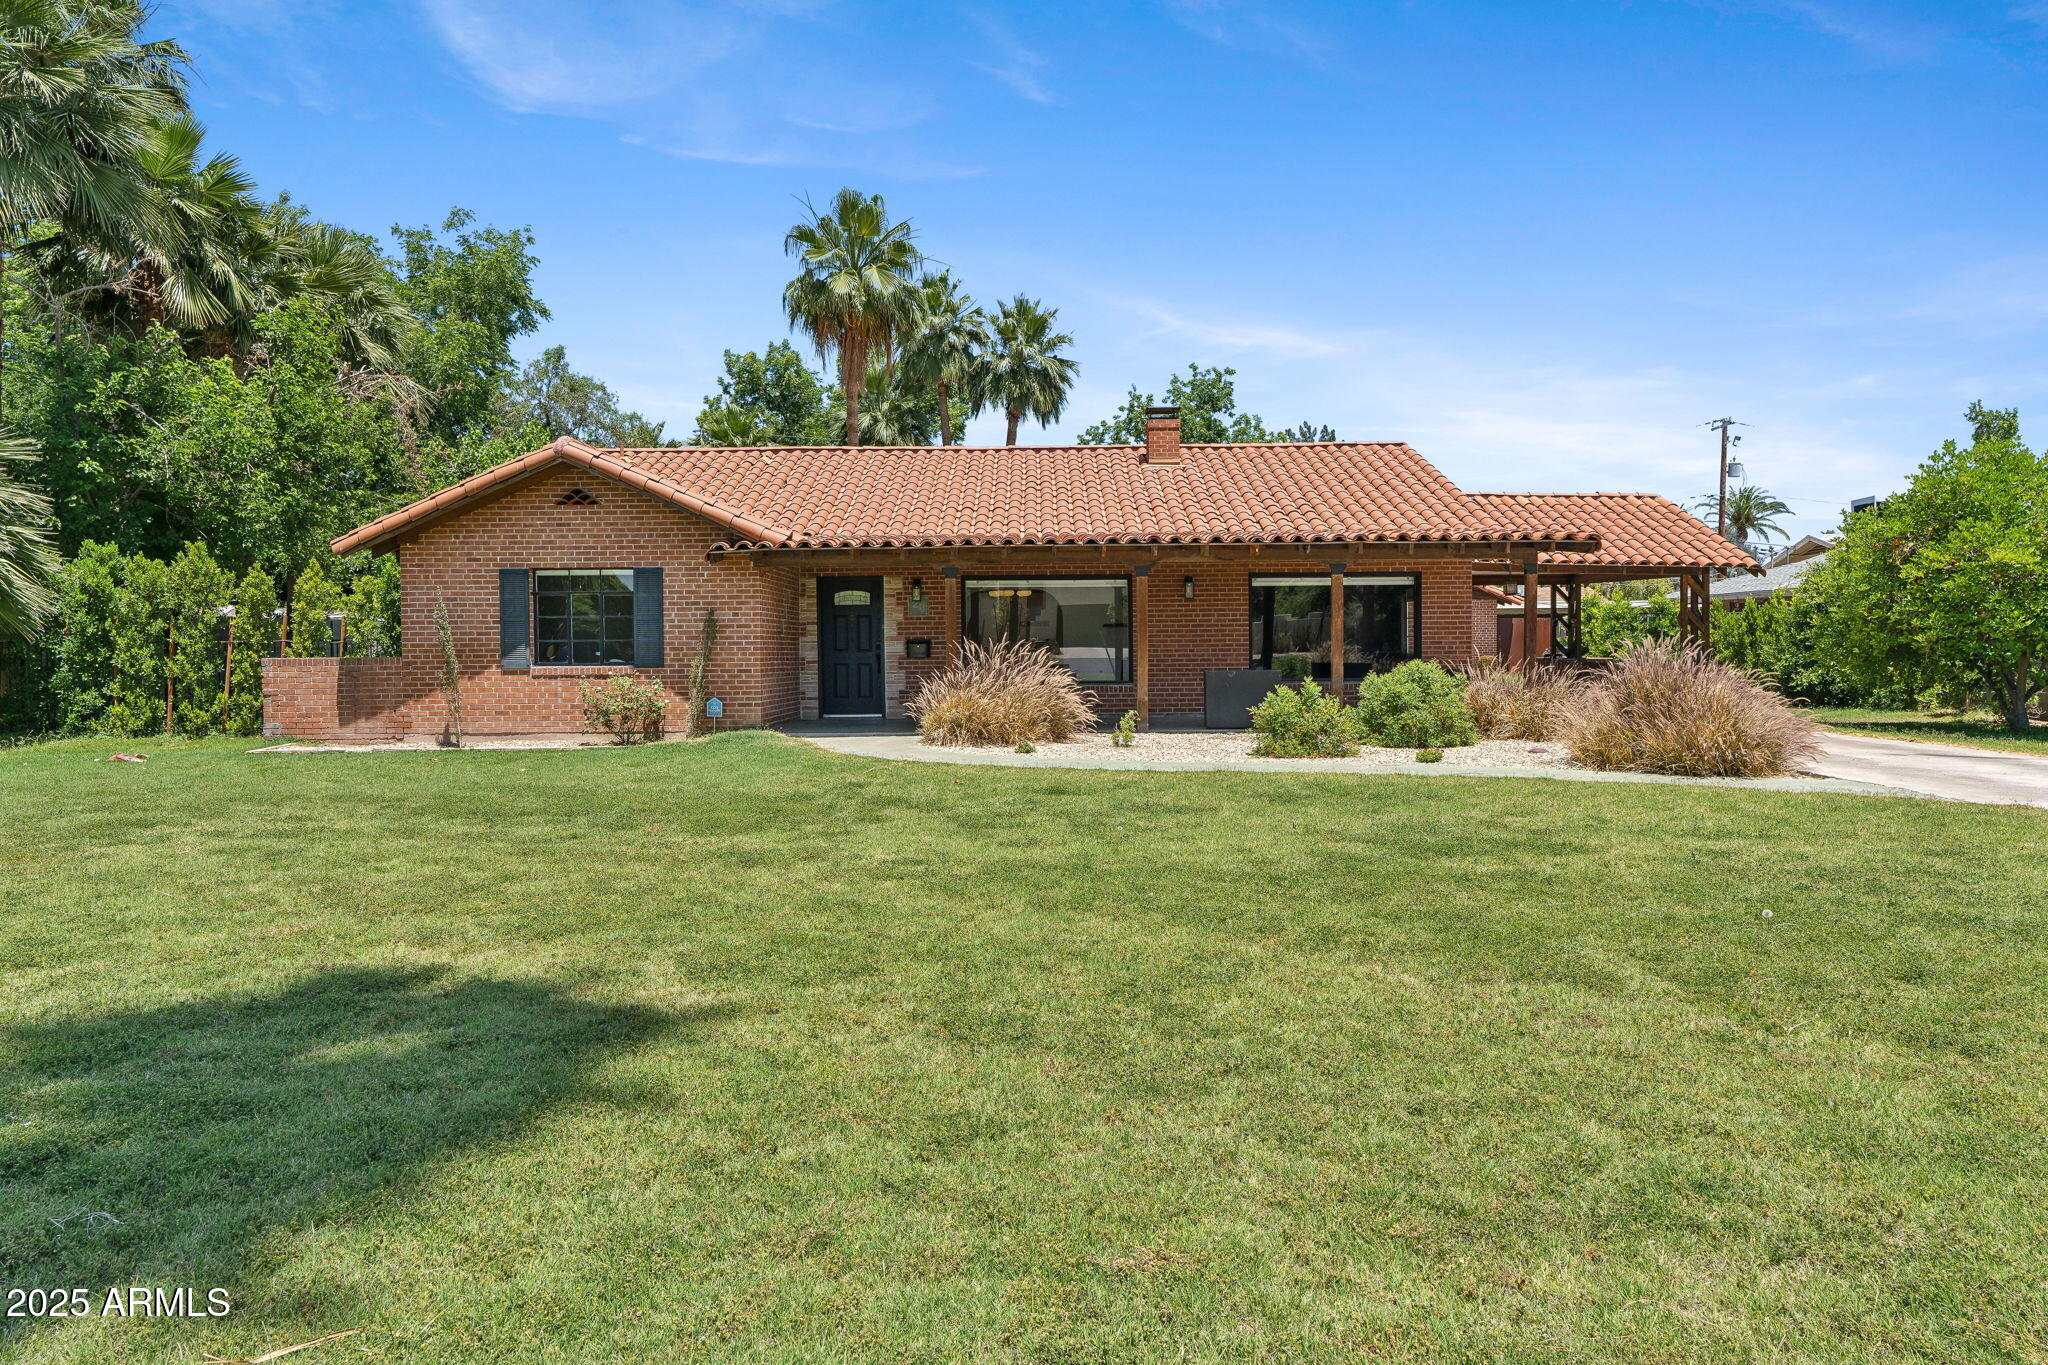
Active
$1,195,000
4
bds
|
3
ba
|
1,667
sqft
|
built
1949
20 W Pasadena Ave, Phoenix, AZ 85013
$-2,828
Cash flow
-12.3%
Cash-on-Cash Return
2.8%
Cap rate
0.4%
Rent to Value Ratio
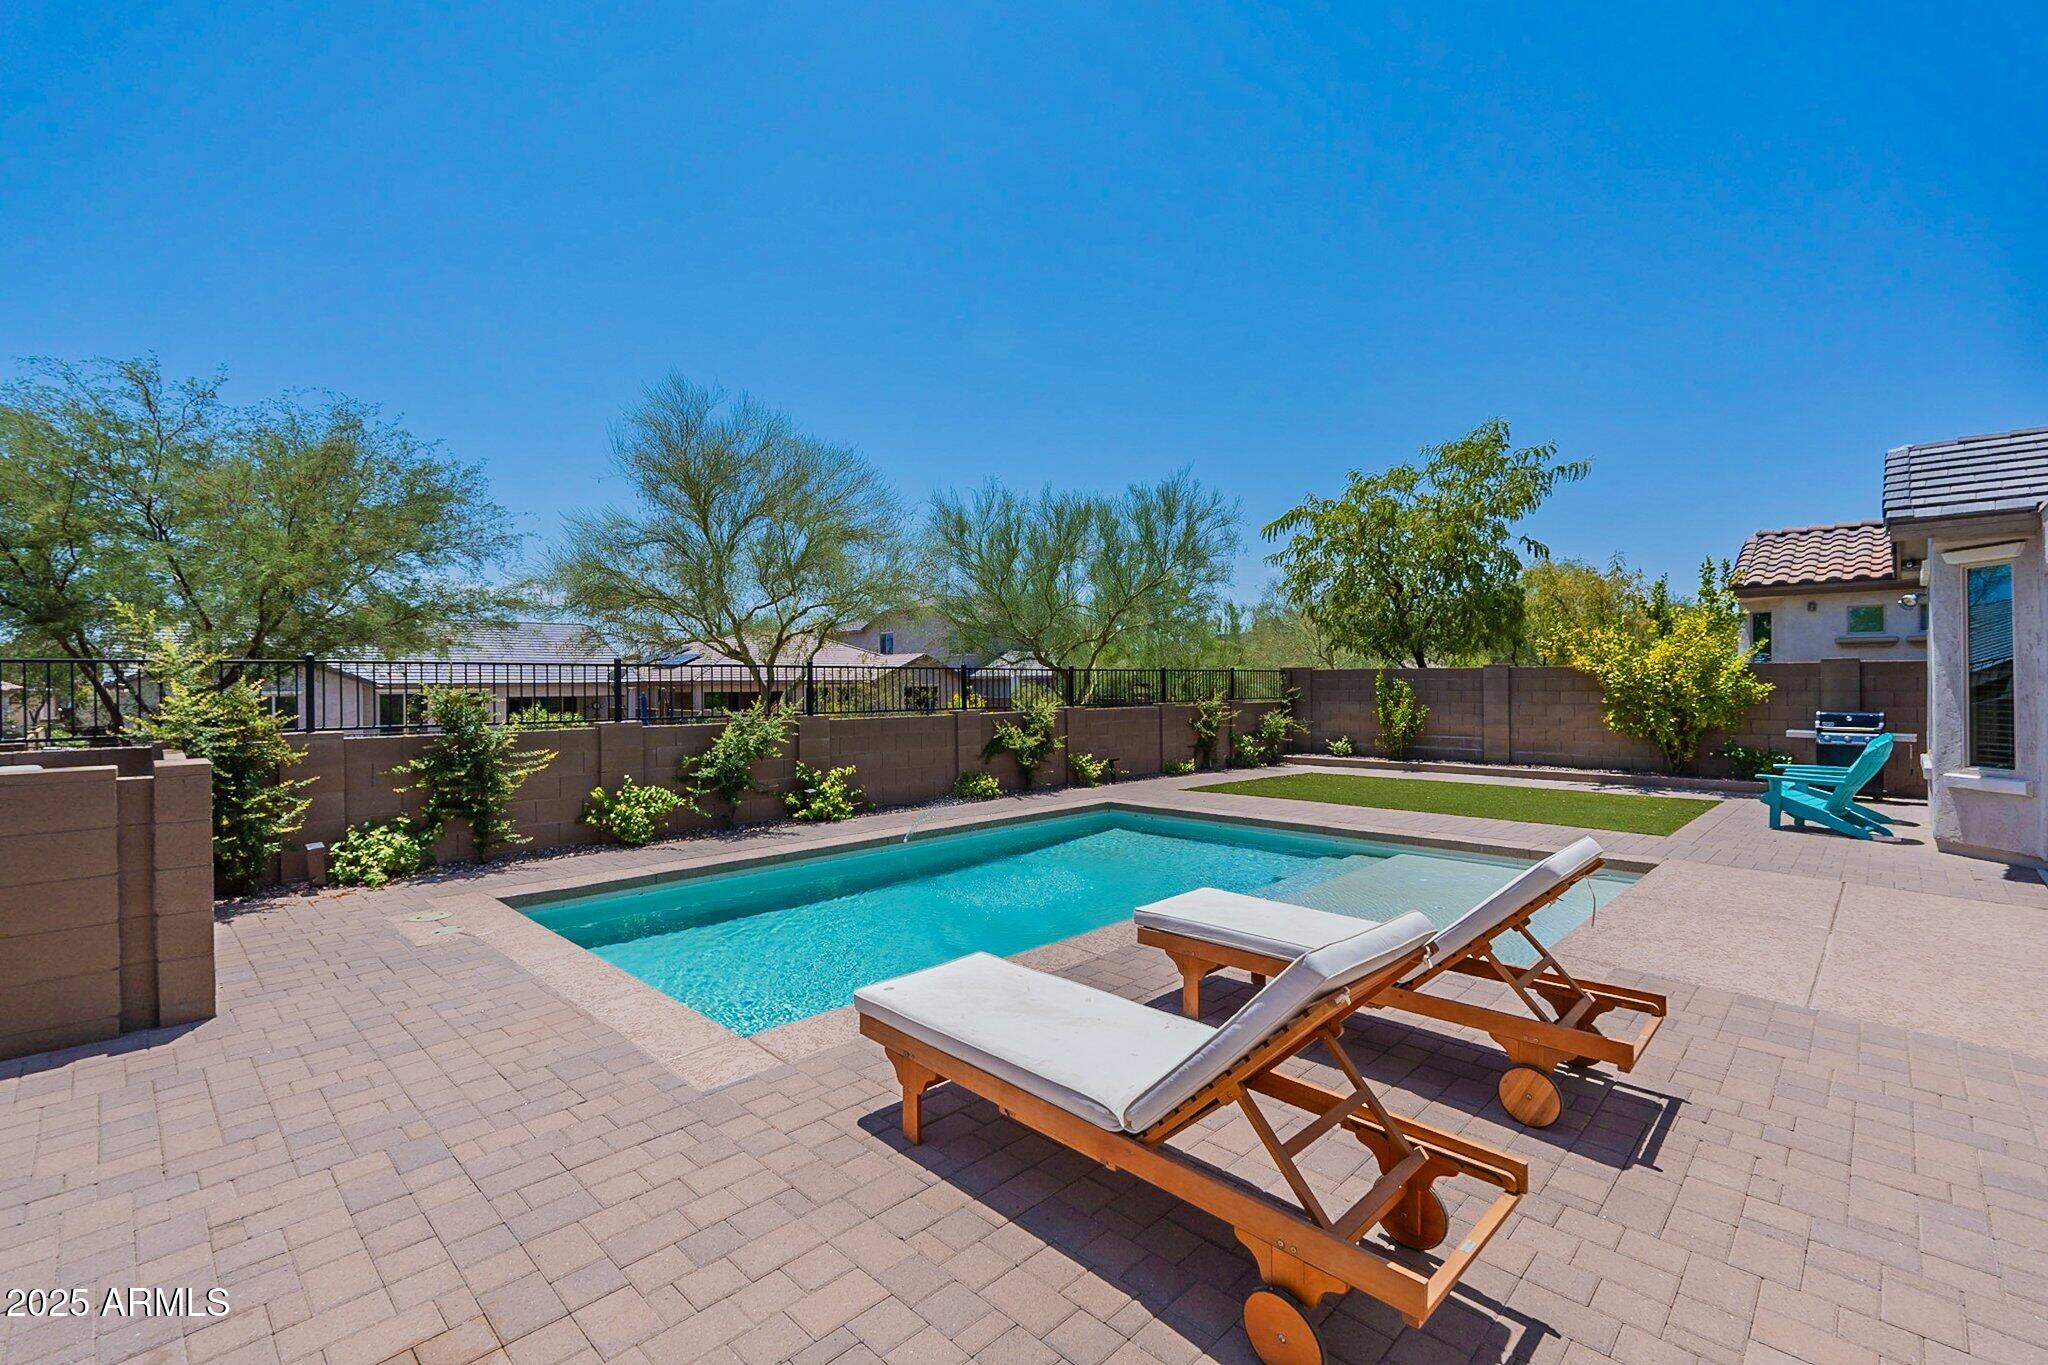
Active
$650,000
4
bds
|
3
ba
|
2,590
sqft
|
built
2015
2543 W Rabjohn Rd, Phoenix, AZ 85085
$-1,117
Cash flow
-9.0%
Cash-on-Cash Return
3.6%
Cap rate
0.5%
Rent to Value Ratio
Active
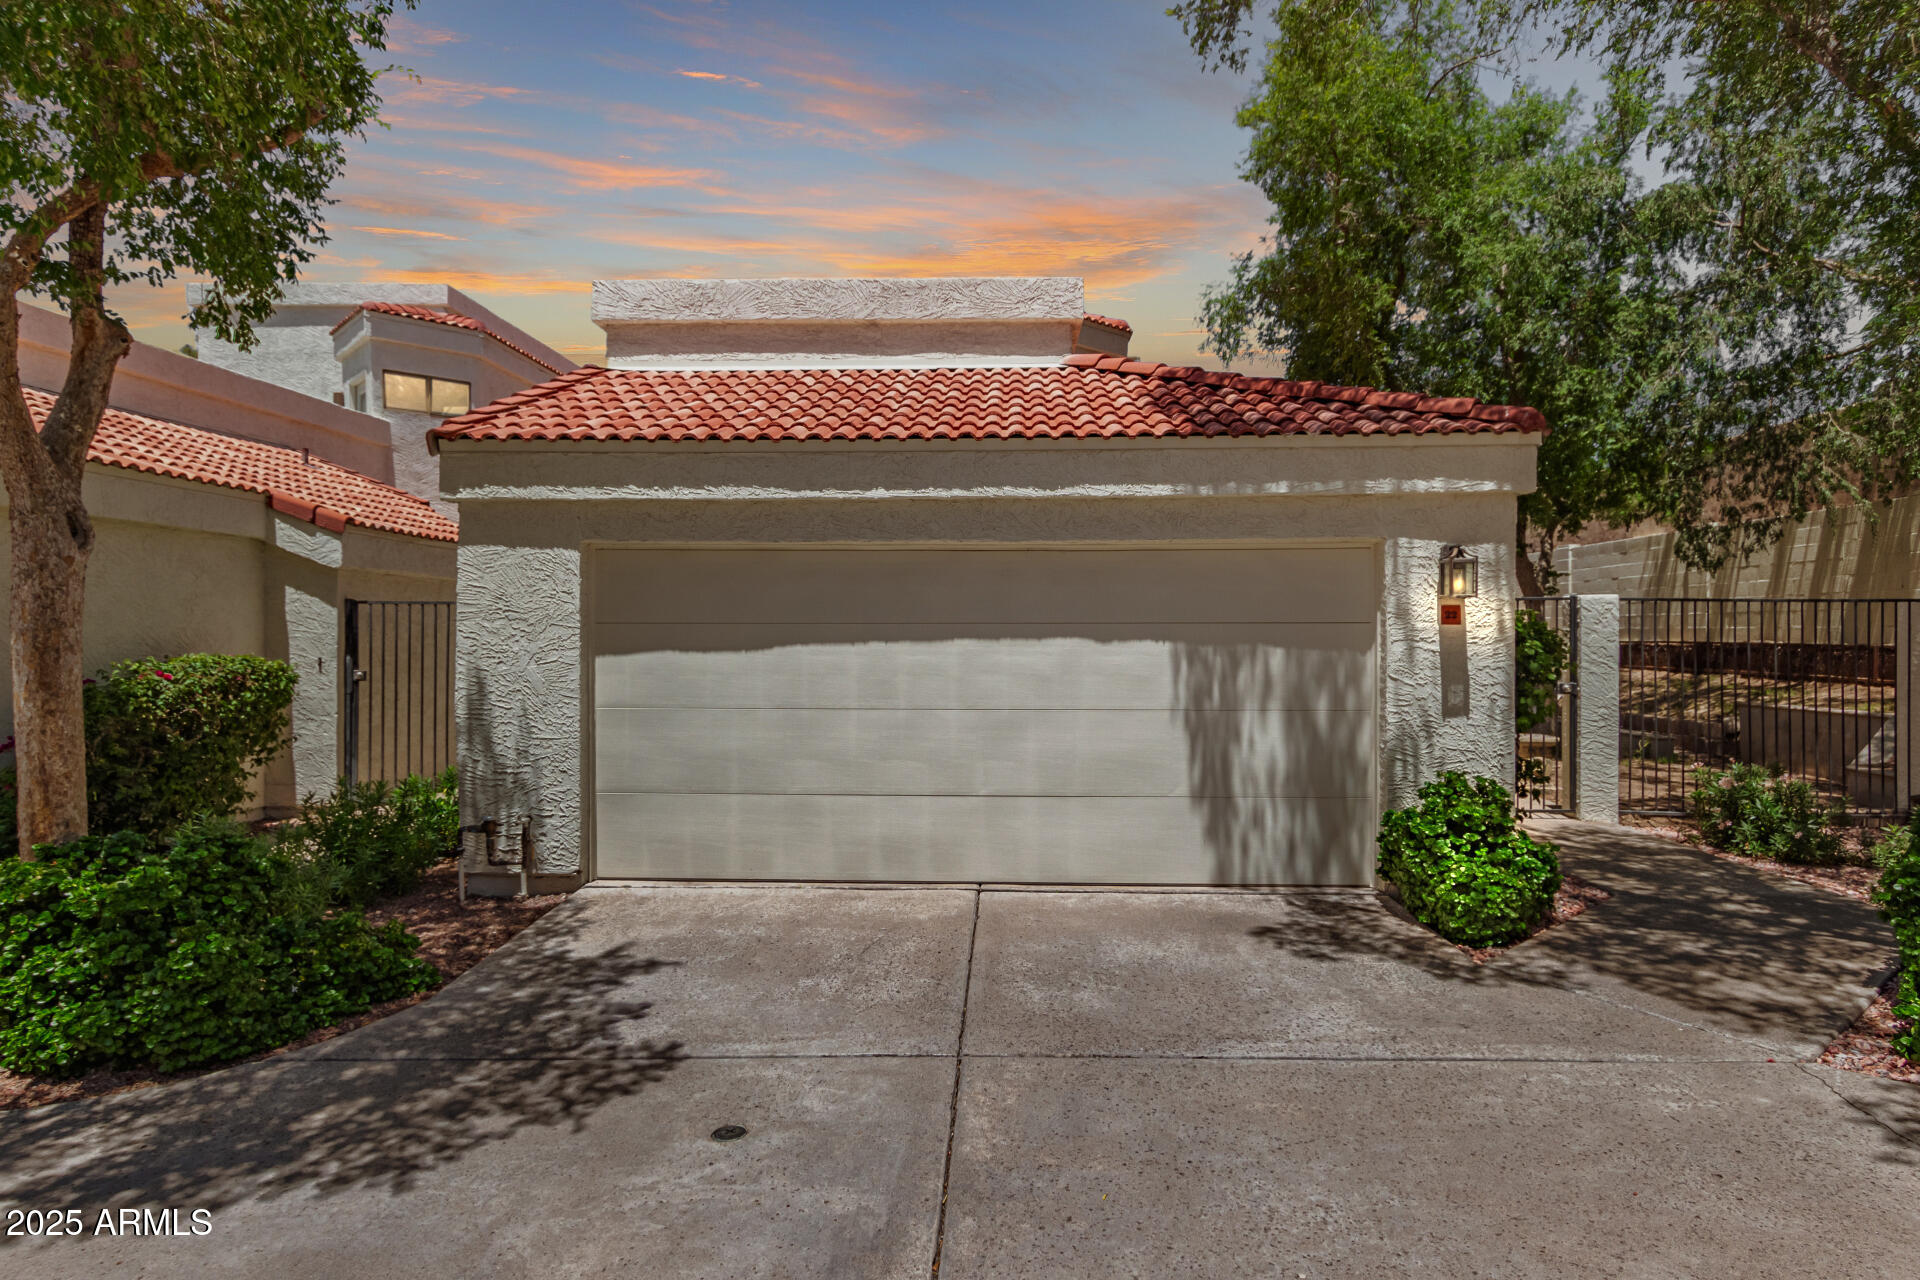
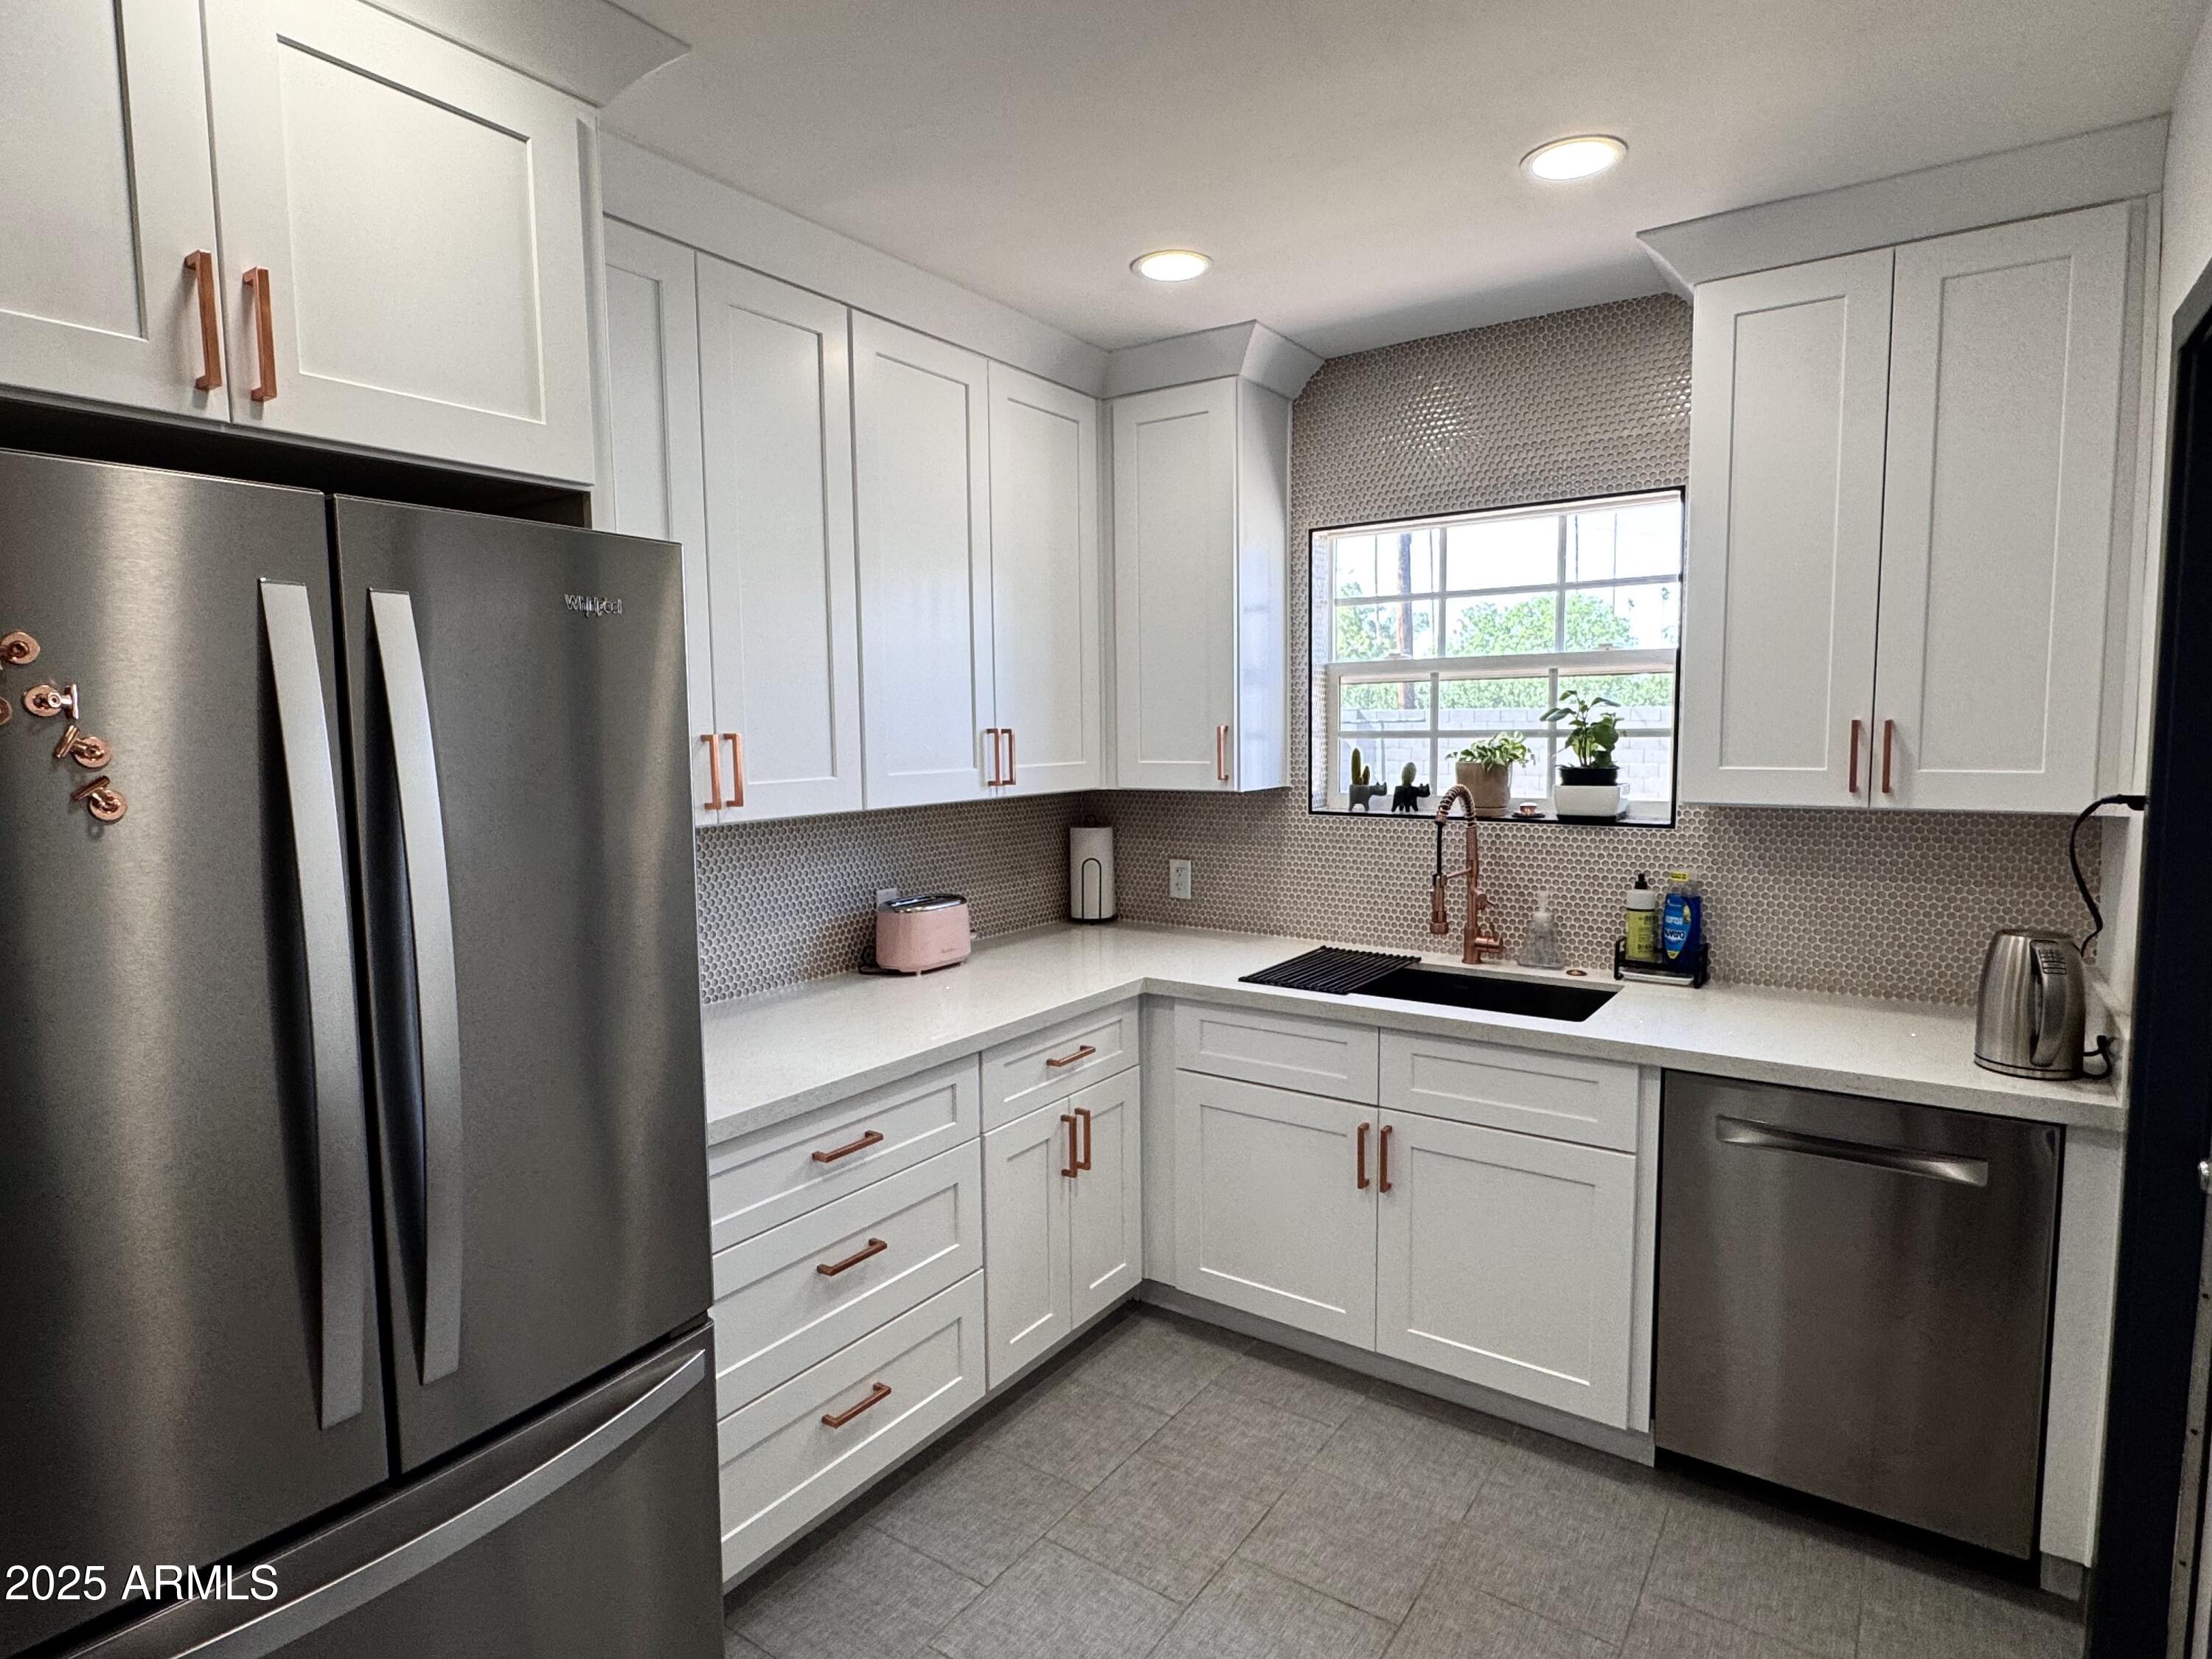
$479,999
2
bds
|
2
ba
|
1,277
sqft
|
built
1990
5104 N 32nd St, Phoenix, AZ 85018
$-1,390
Cash flow
-15.1%
Cash-on-Cash Return
2.2%
Cap rate
0.5%
Rent to Value Ratio

Active
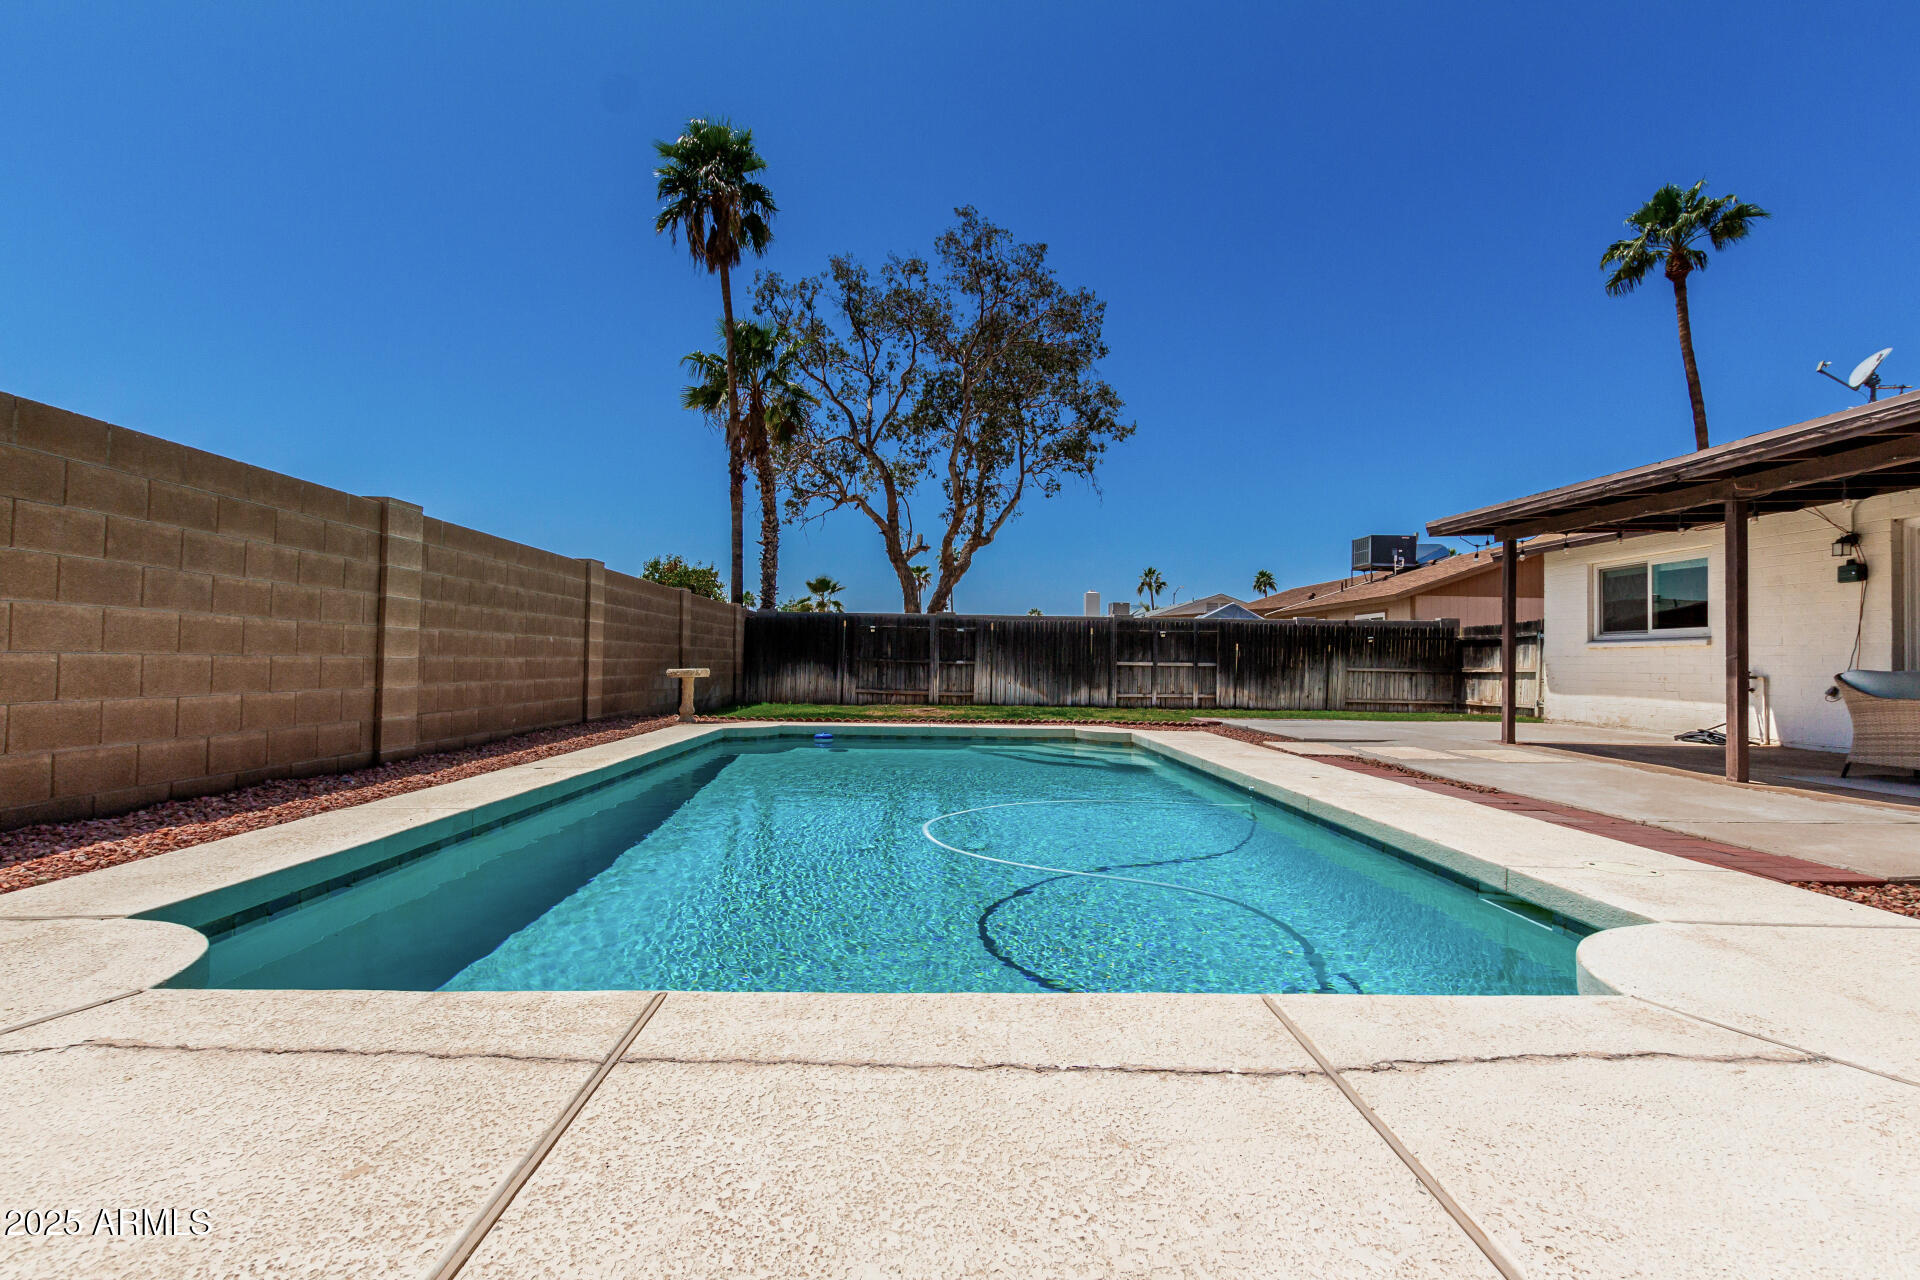
$525,000
3
bds
|
2
ba
|
1,304
sqft
|
built
1979
828 E Le Marche Ave, Phoenix, AZ 85022
$-1,116
Cash flow
-11.1%
Cash-on-Cash Return
3.1%
Cap rate
0.4%
Rent to Value Ratio

Active
$1,499,900
4
bds
|
4
ba
|
3,785
sqft
|
built
2005
22317 N 39th Run, Phoenix, AZ 85050
$-2,128
Cash flow
-7.4%
Cash-on-Cash Return
4.0%
Cap rate
0.5%
Rent to Value Ratio
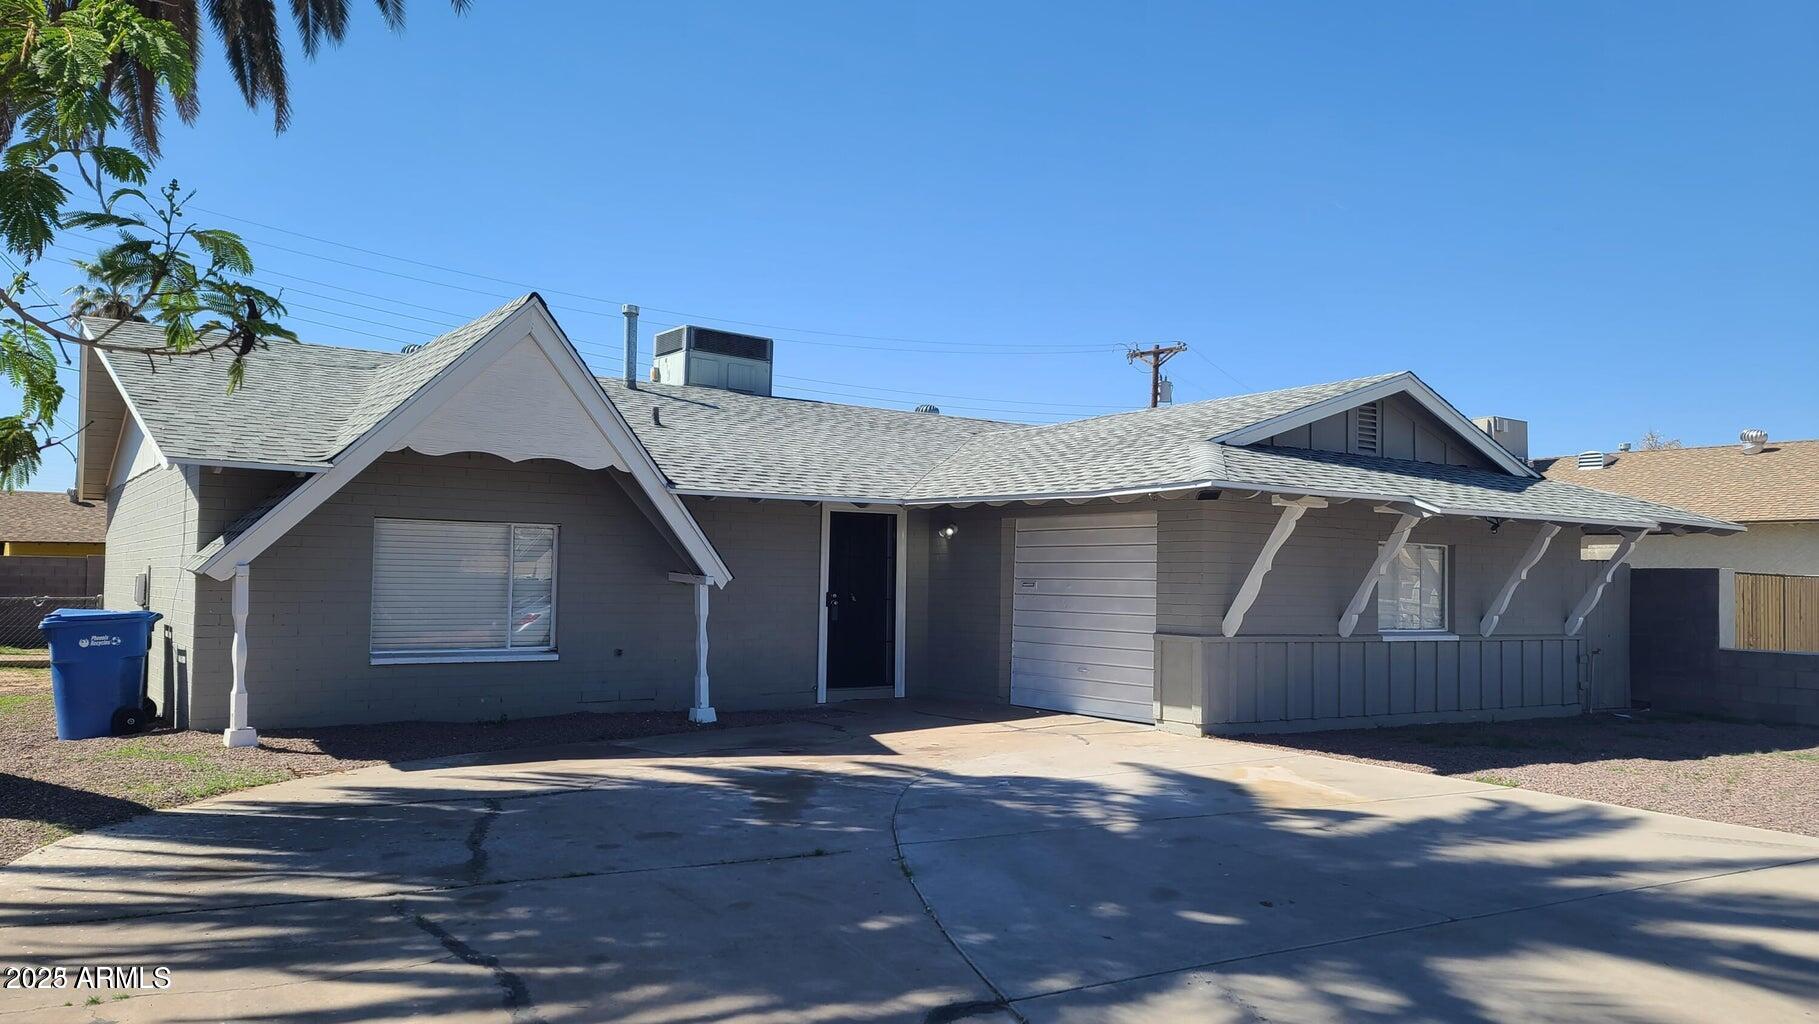
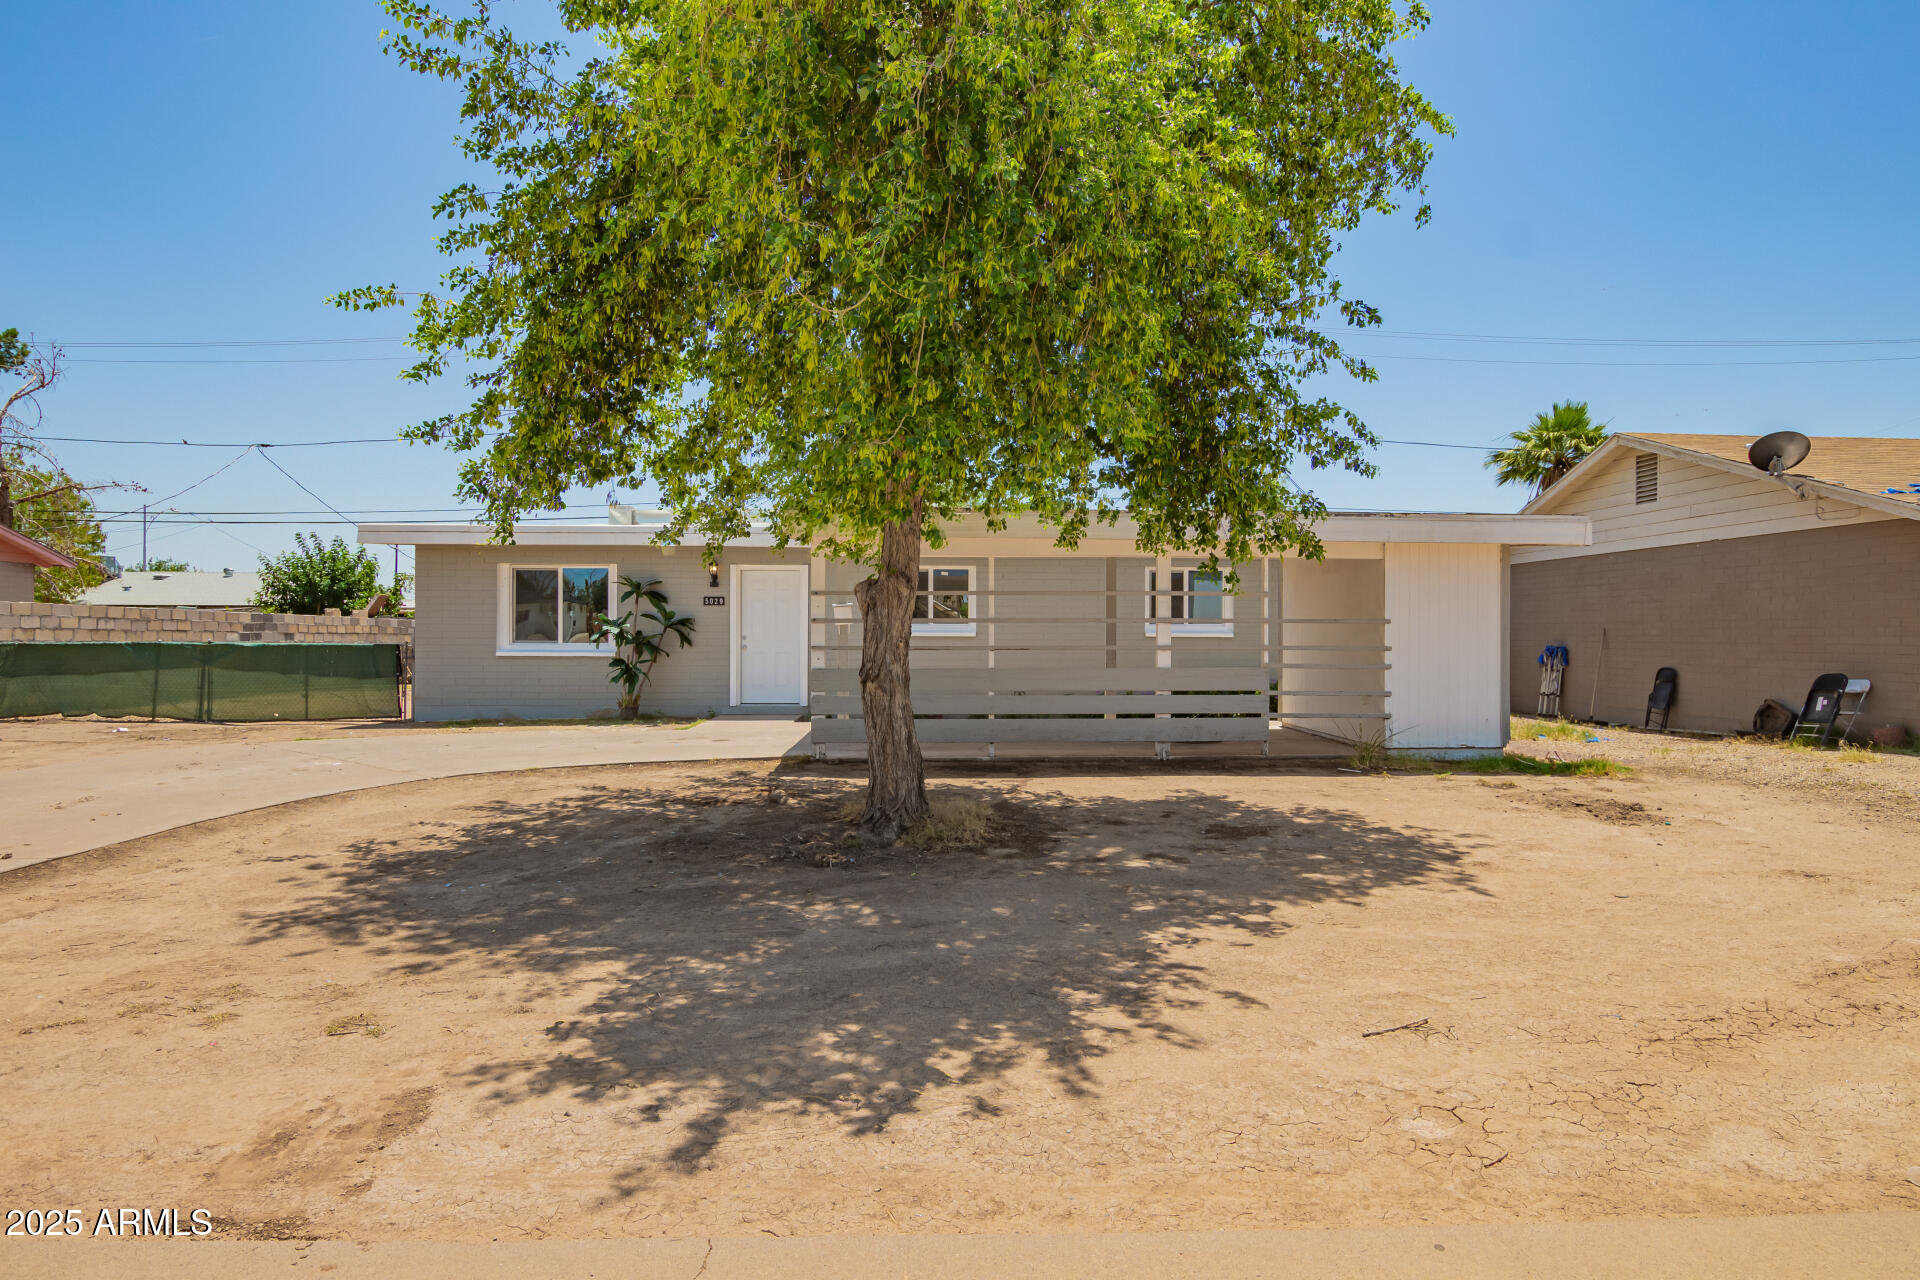
Active
$340,000
3
bds
|
2
ba
|
1,395
sqft
|
built
1959
2908 N 53rd Ln, Phoenix, AZ 85031
$-299
Cash flow
-4.6%
Cash-on-Cash Return
4.6%
Cap rate
0.6%
Rent to Value Ratio
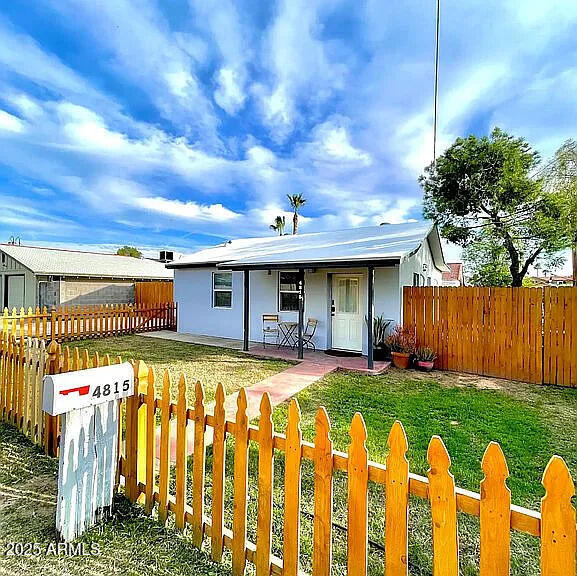
Active
$495,000
2
bds
|
3
ba
|
1,000
sqft
|
built
1945
4815 E Windsor Ave, Phoenix, AZ 85008
$-1,476
Cash flow
-15.6%
Cash-on-Cash Return
2.1%
Cap rate
0.3%
Rent to Value Ratio
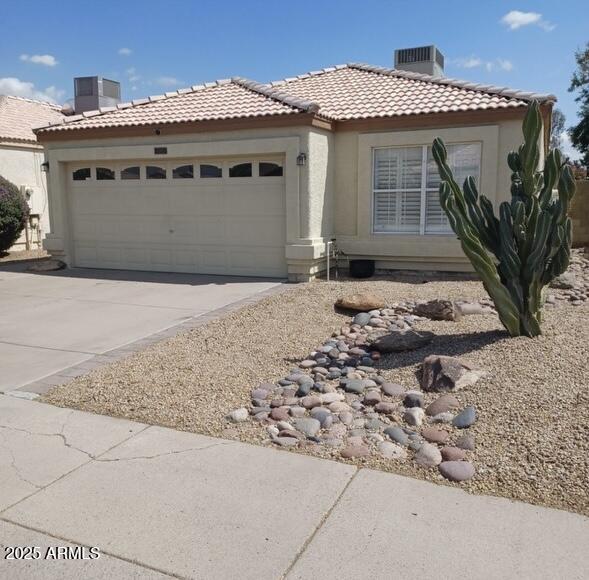
Active
$519,900
3
bds
|
2
ba
|
1,409
sqft
|
built
1995
4765 E Charleston Ave, Phoenix, AZ 85032
$-960
Cash flow
-9.6%
Cash-on-Cash Return
3.5%
Cap rate
0.5%
Rent to Value Ratio
Active
$897,000
3
bds
|
3
ba
|
2,552
sqft
|
built
2005
1535 W Winter Dr, Phoenix, AZ 85021
$-2,344
Cash flow
-13.6%
Cash-on-Cash Return
2.5%
Cap rate
0.4%
Rent to Value Ratio
Active
$300,000
2
bds
|
1
ba
|
816
sqft
|
built
1962
12453 N 29th Ave, Phoenix, AZ 85029
$-233
Cash flow
-4.1%
Cash-on-Cash Return
4.7%
Cap rate
0.6%
Rent to Value Ratio
Active
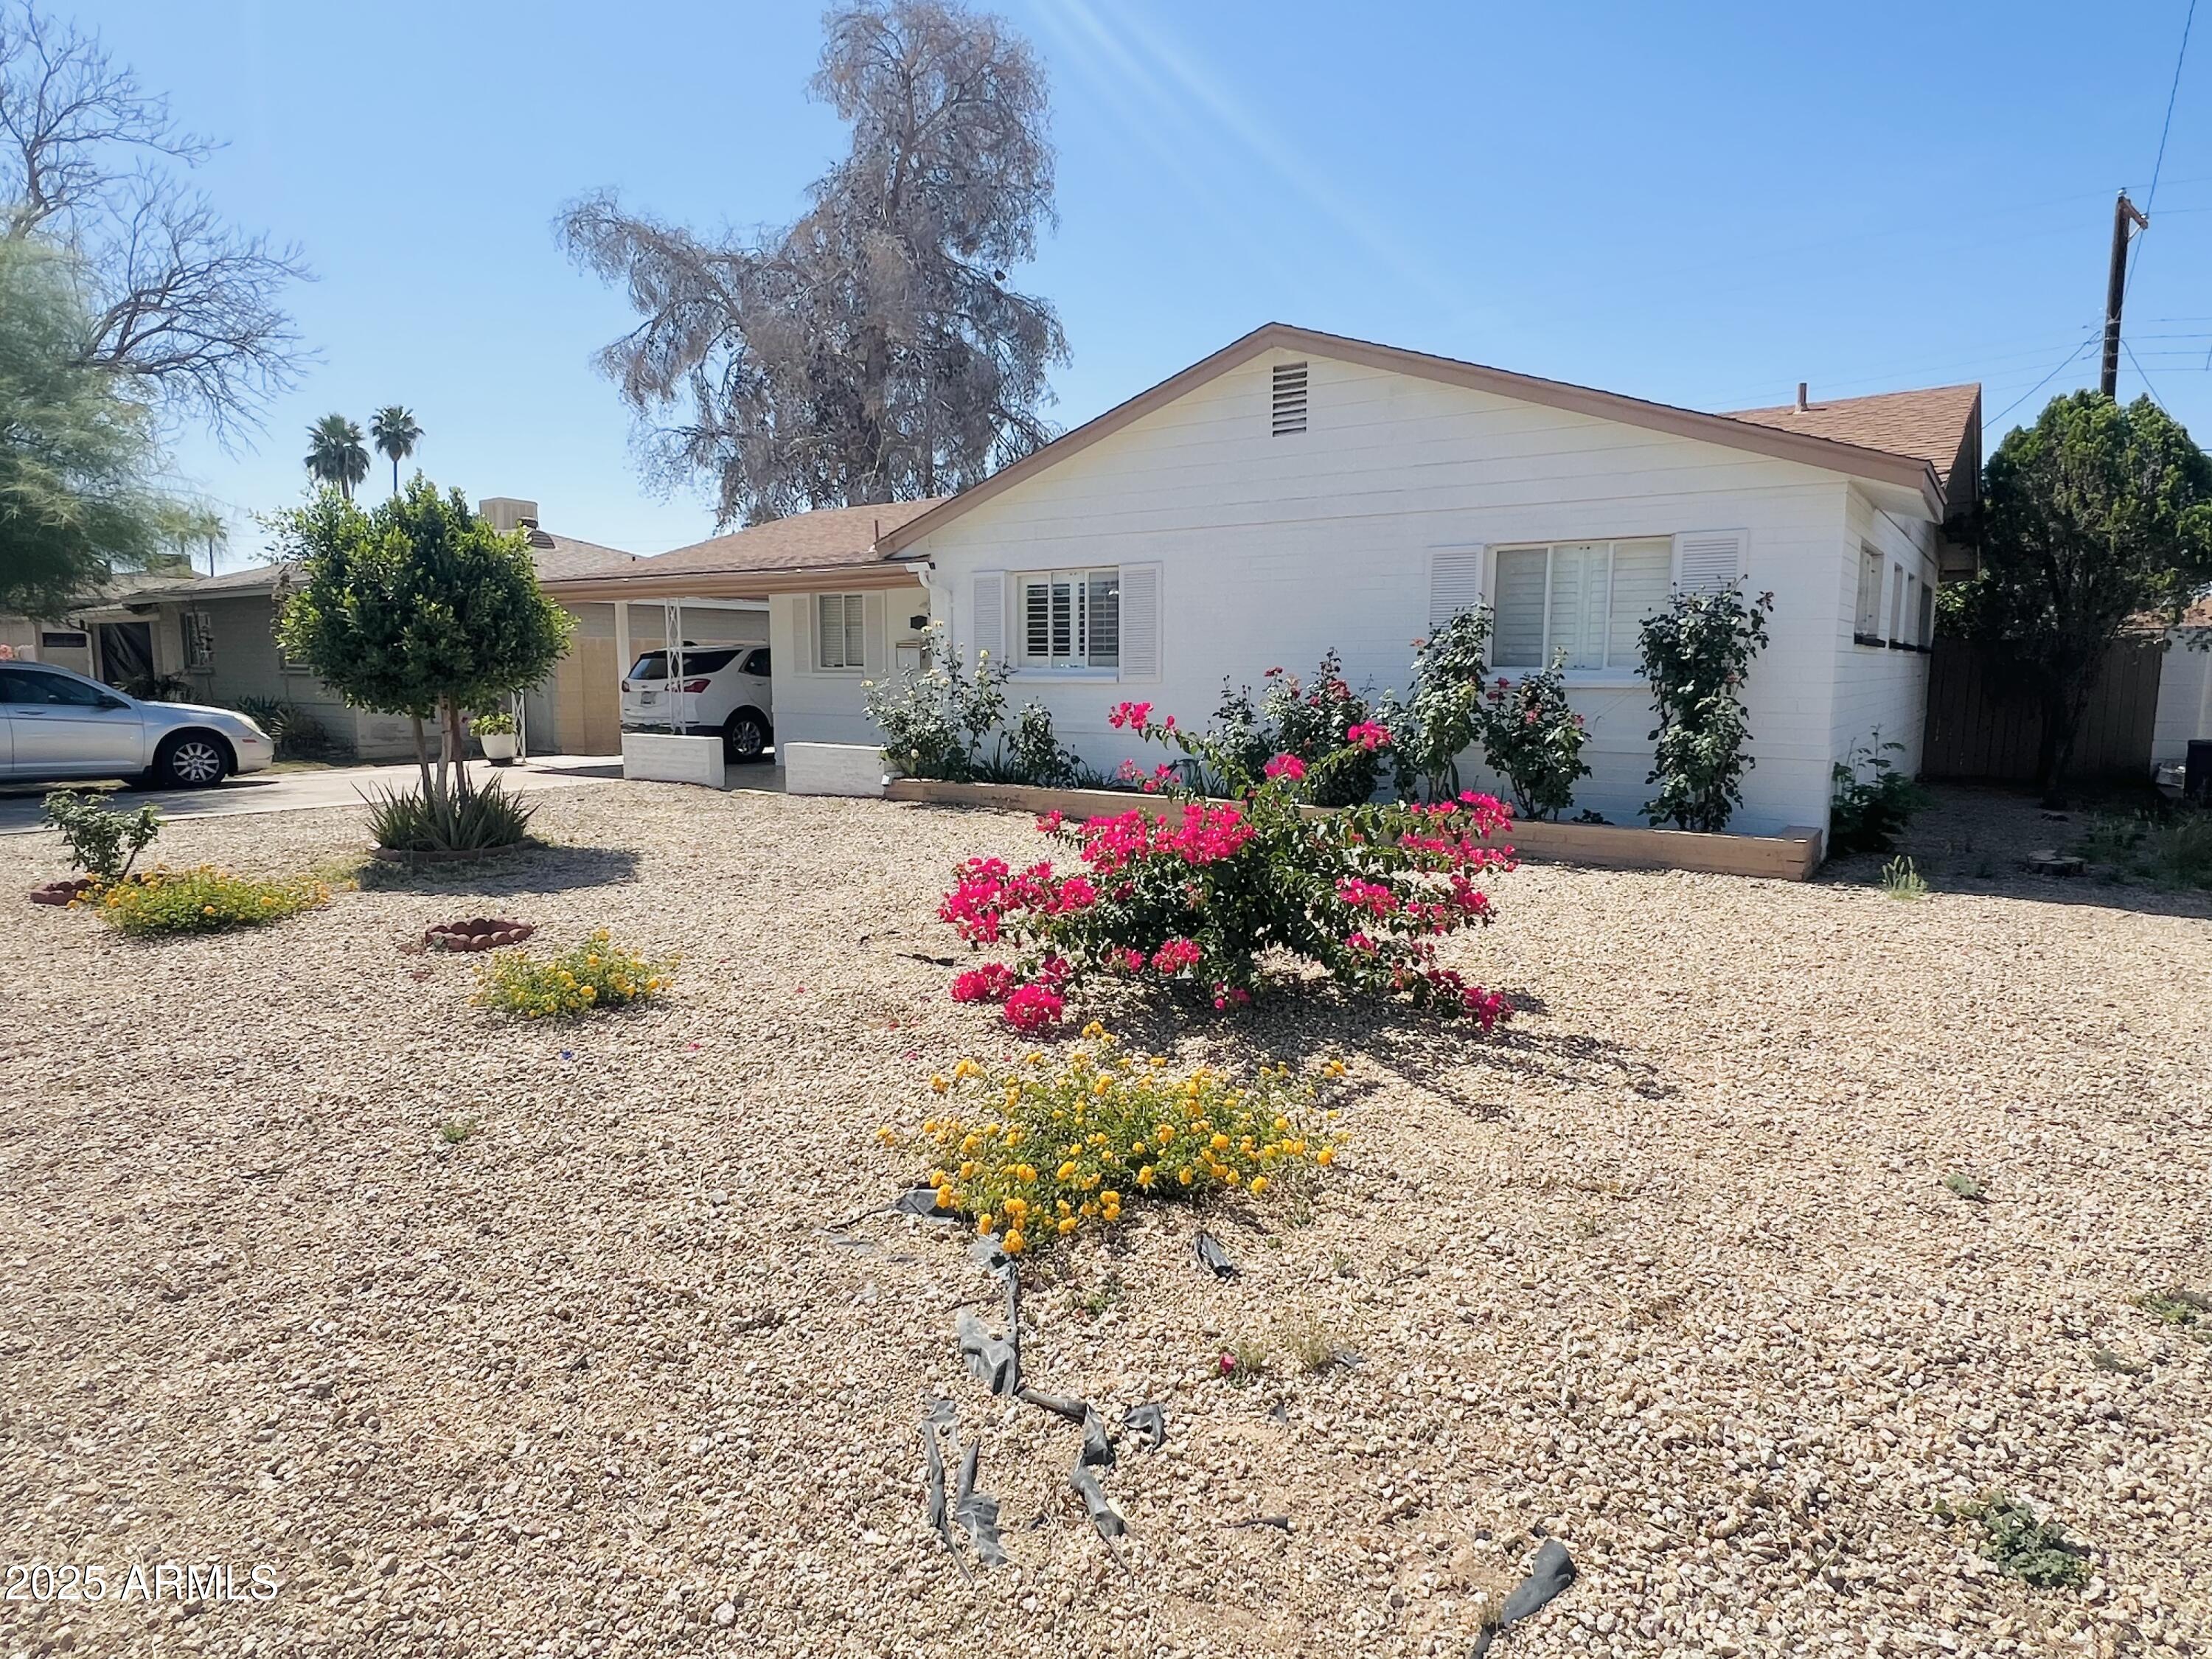
$375,000
3
bds
|
2
ba
|
1,379
sqft
|
built
1957
2115 W Myrtle Ave, Phoenix, AZ 85021
$-514
Cash flow
-7.2%
Cash-on-Cash Return
4.0%
Cap rate
0.5%
Rent to Value Ratio
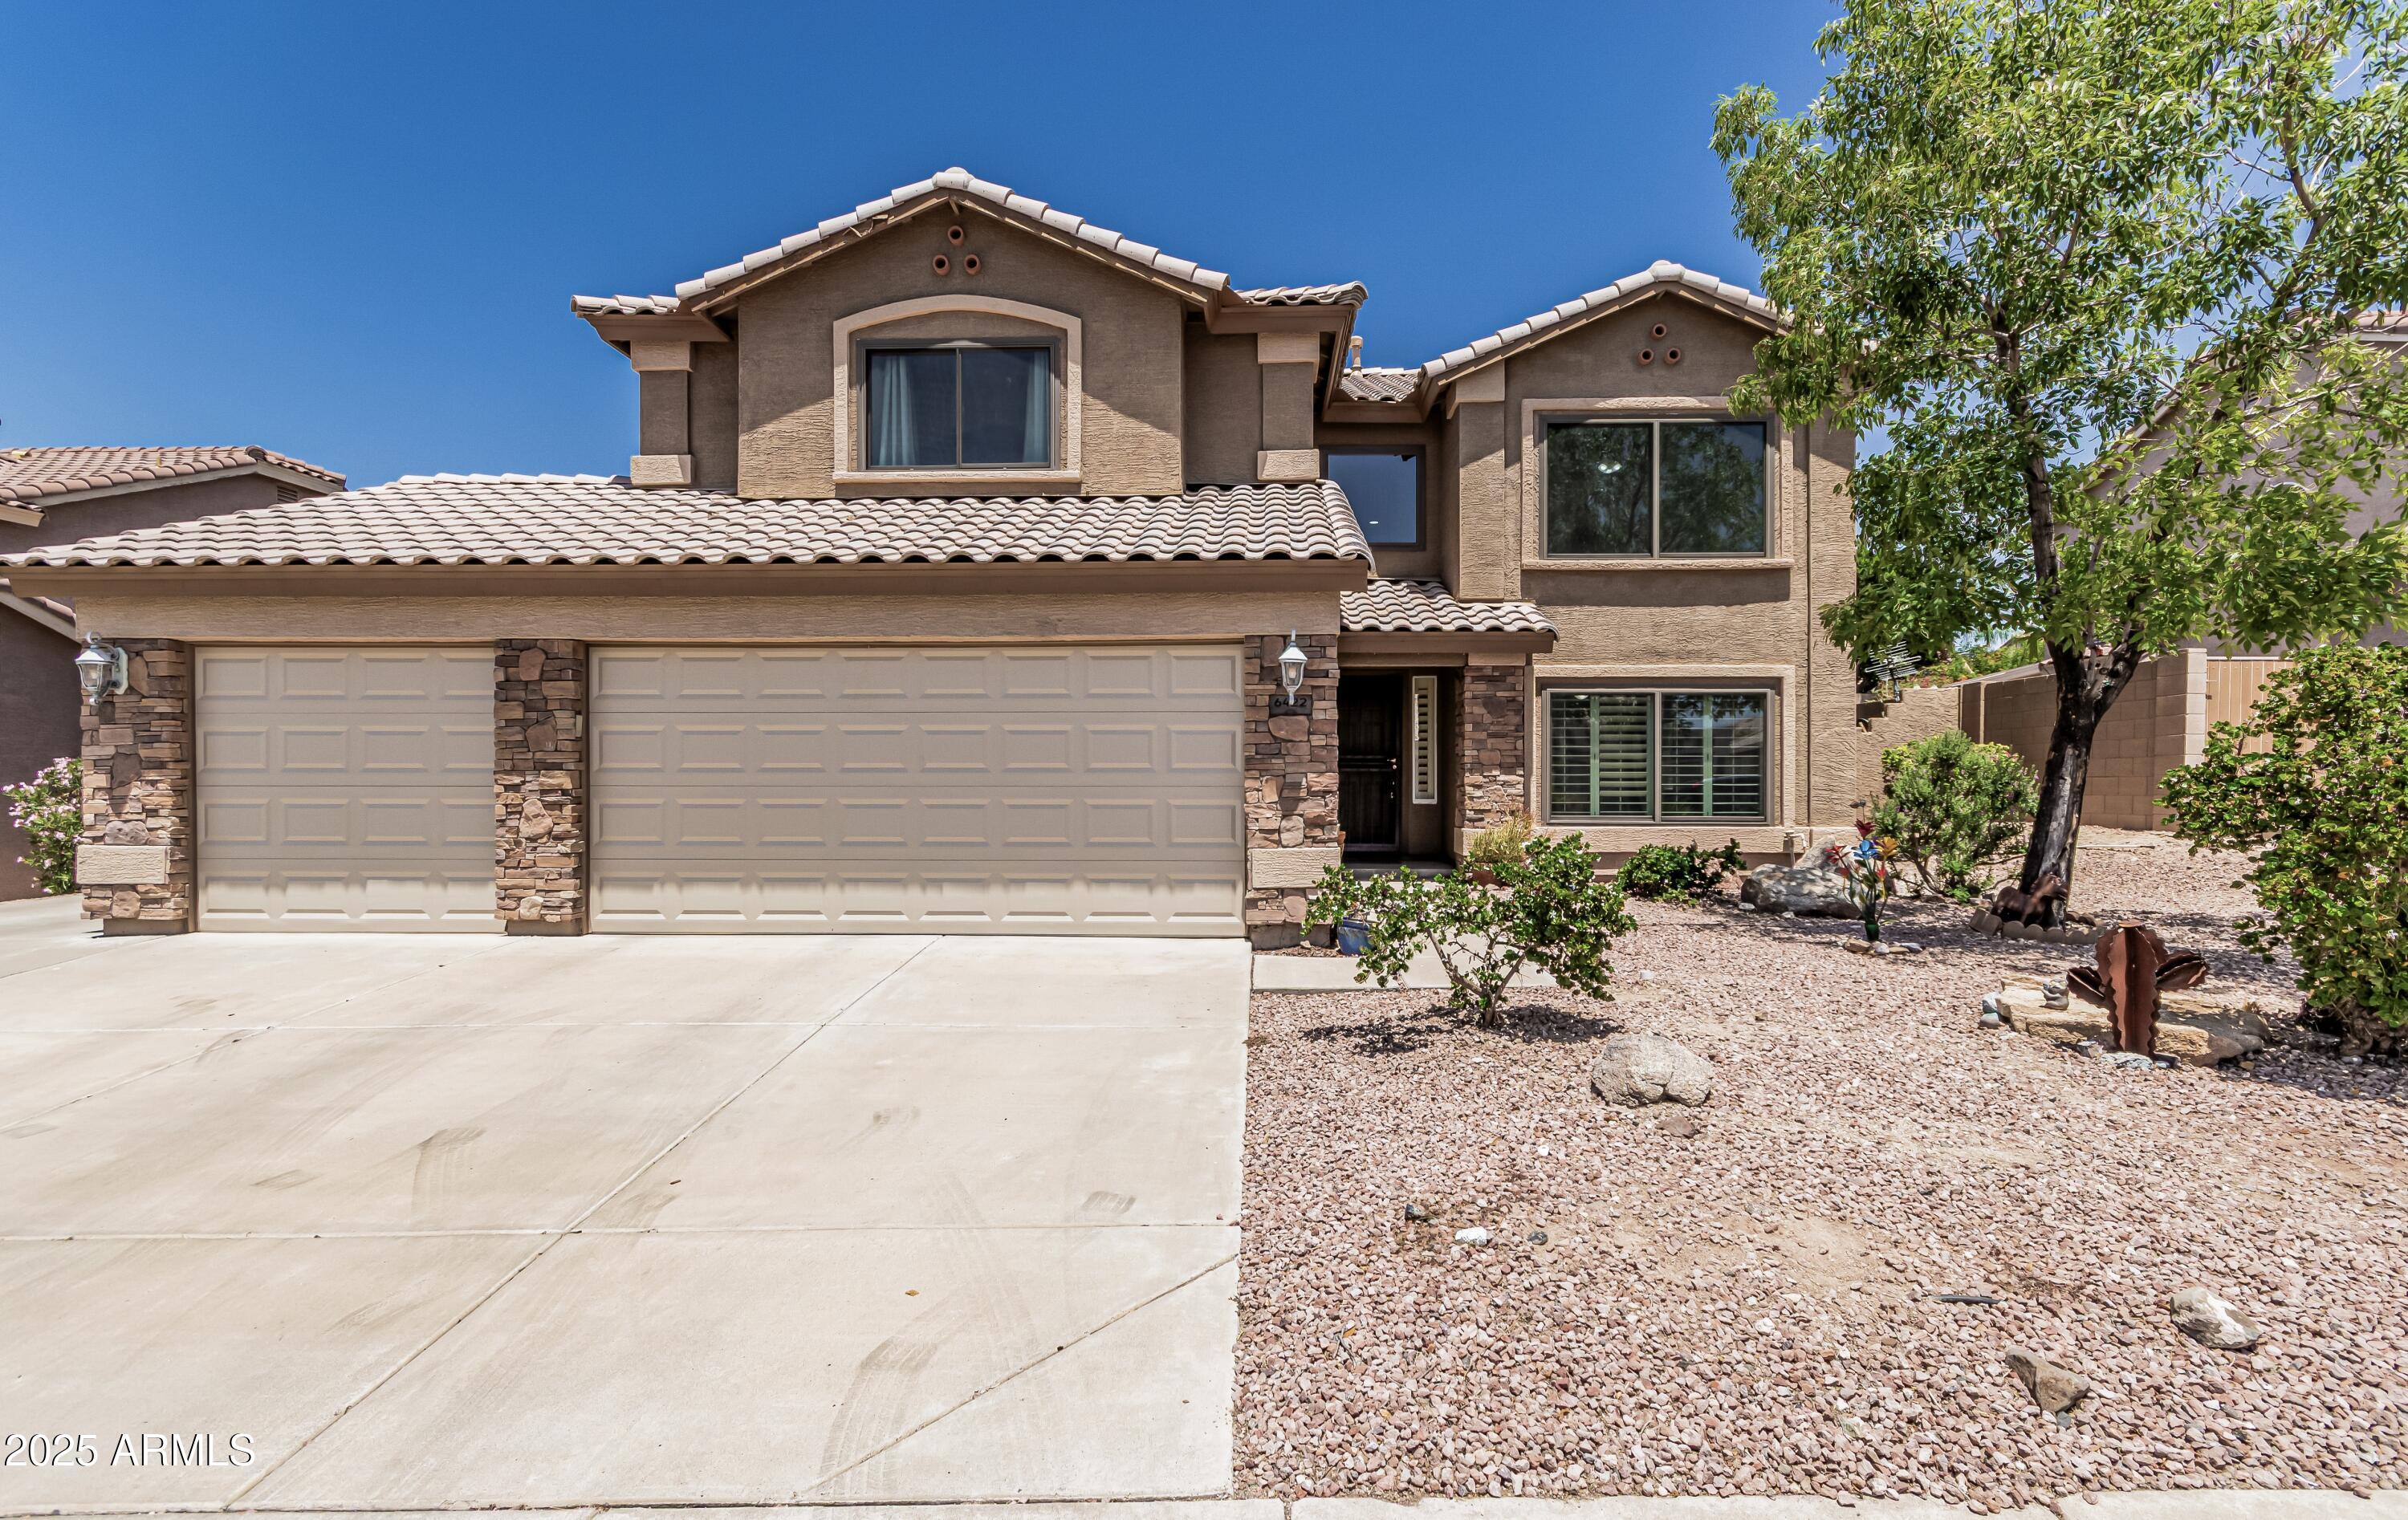
Active
$619,000
4
bds
|
4
ba
|
2,635
sqft
|
built
1998
6422 W Range Mule Dr, Phoenix, AZ 85083
$-1,153
Cash flow
-9.7%
Cash-on-Cash Return
3.4%
Cap rate
0.5%
Rent to Value Ratio
Active
$675,000
3
bds
|
2
ba
|
1,885
sqft
|
built
1955
1417 W Rose Ln, Phoenix, AZ 85013
$-1,575
Cash flow
-12.2%
Cash-on-Cash Return
2.9%
Cap rate
0.4%
Rent to Value Ratio
Active
$535,000
2
bds
|
3
ba
|
1,374
sqft
|
built
1986
4225 N 21st St, Phoenix, AZ 85016
$-1,137
Cash flow
-11.1%
Cash-on-Cash Return
3.1%
Cap rate
0.5%
Rent to Value Ratio
Active
$499,000
2
bds
|
1
ba
|
995
sqft
|
built
1947
1222 E Almeria Rd, Phoenix, AZ 85006
$-1,111
Cash flow
-11.6%
Cash-on-Cash Return
3.0%
Cap rate
0.4%
Rent to Value Ratio
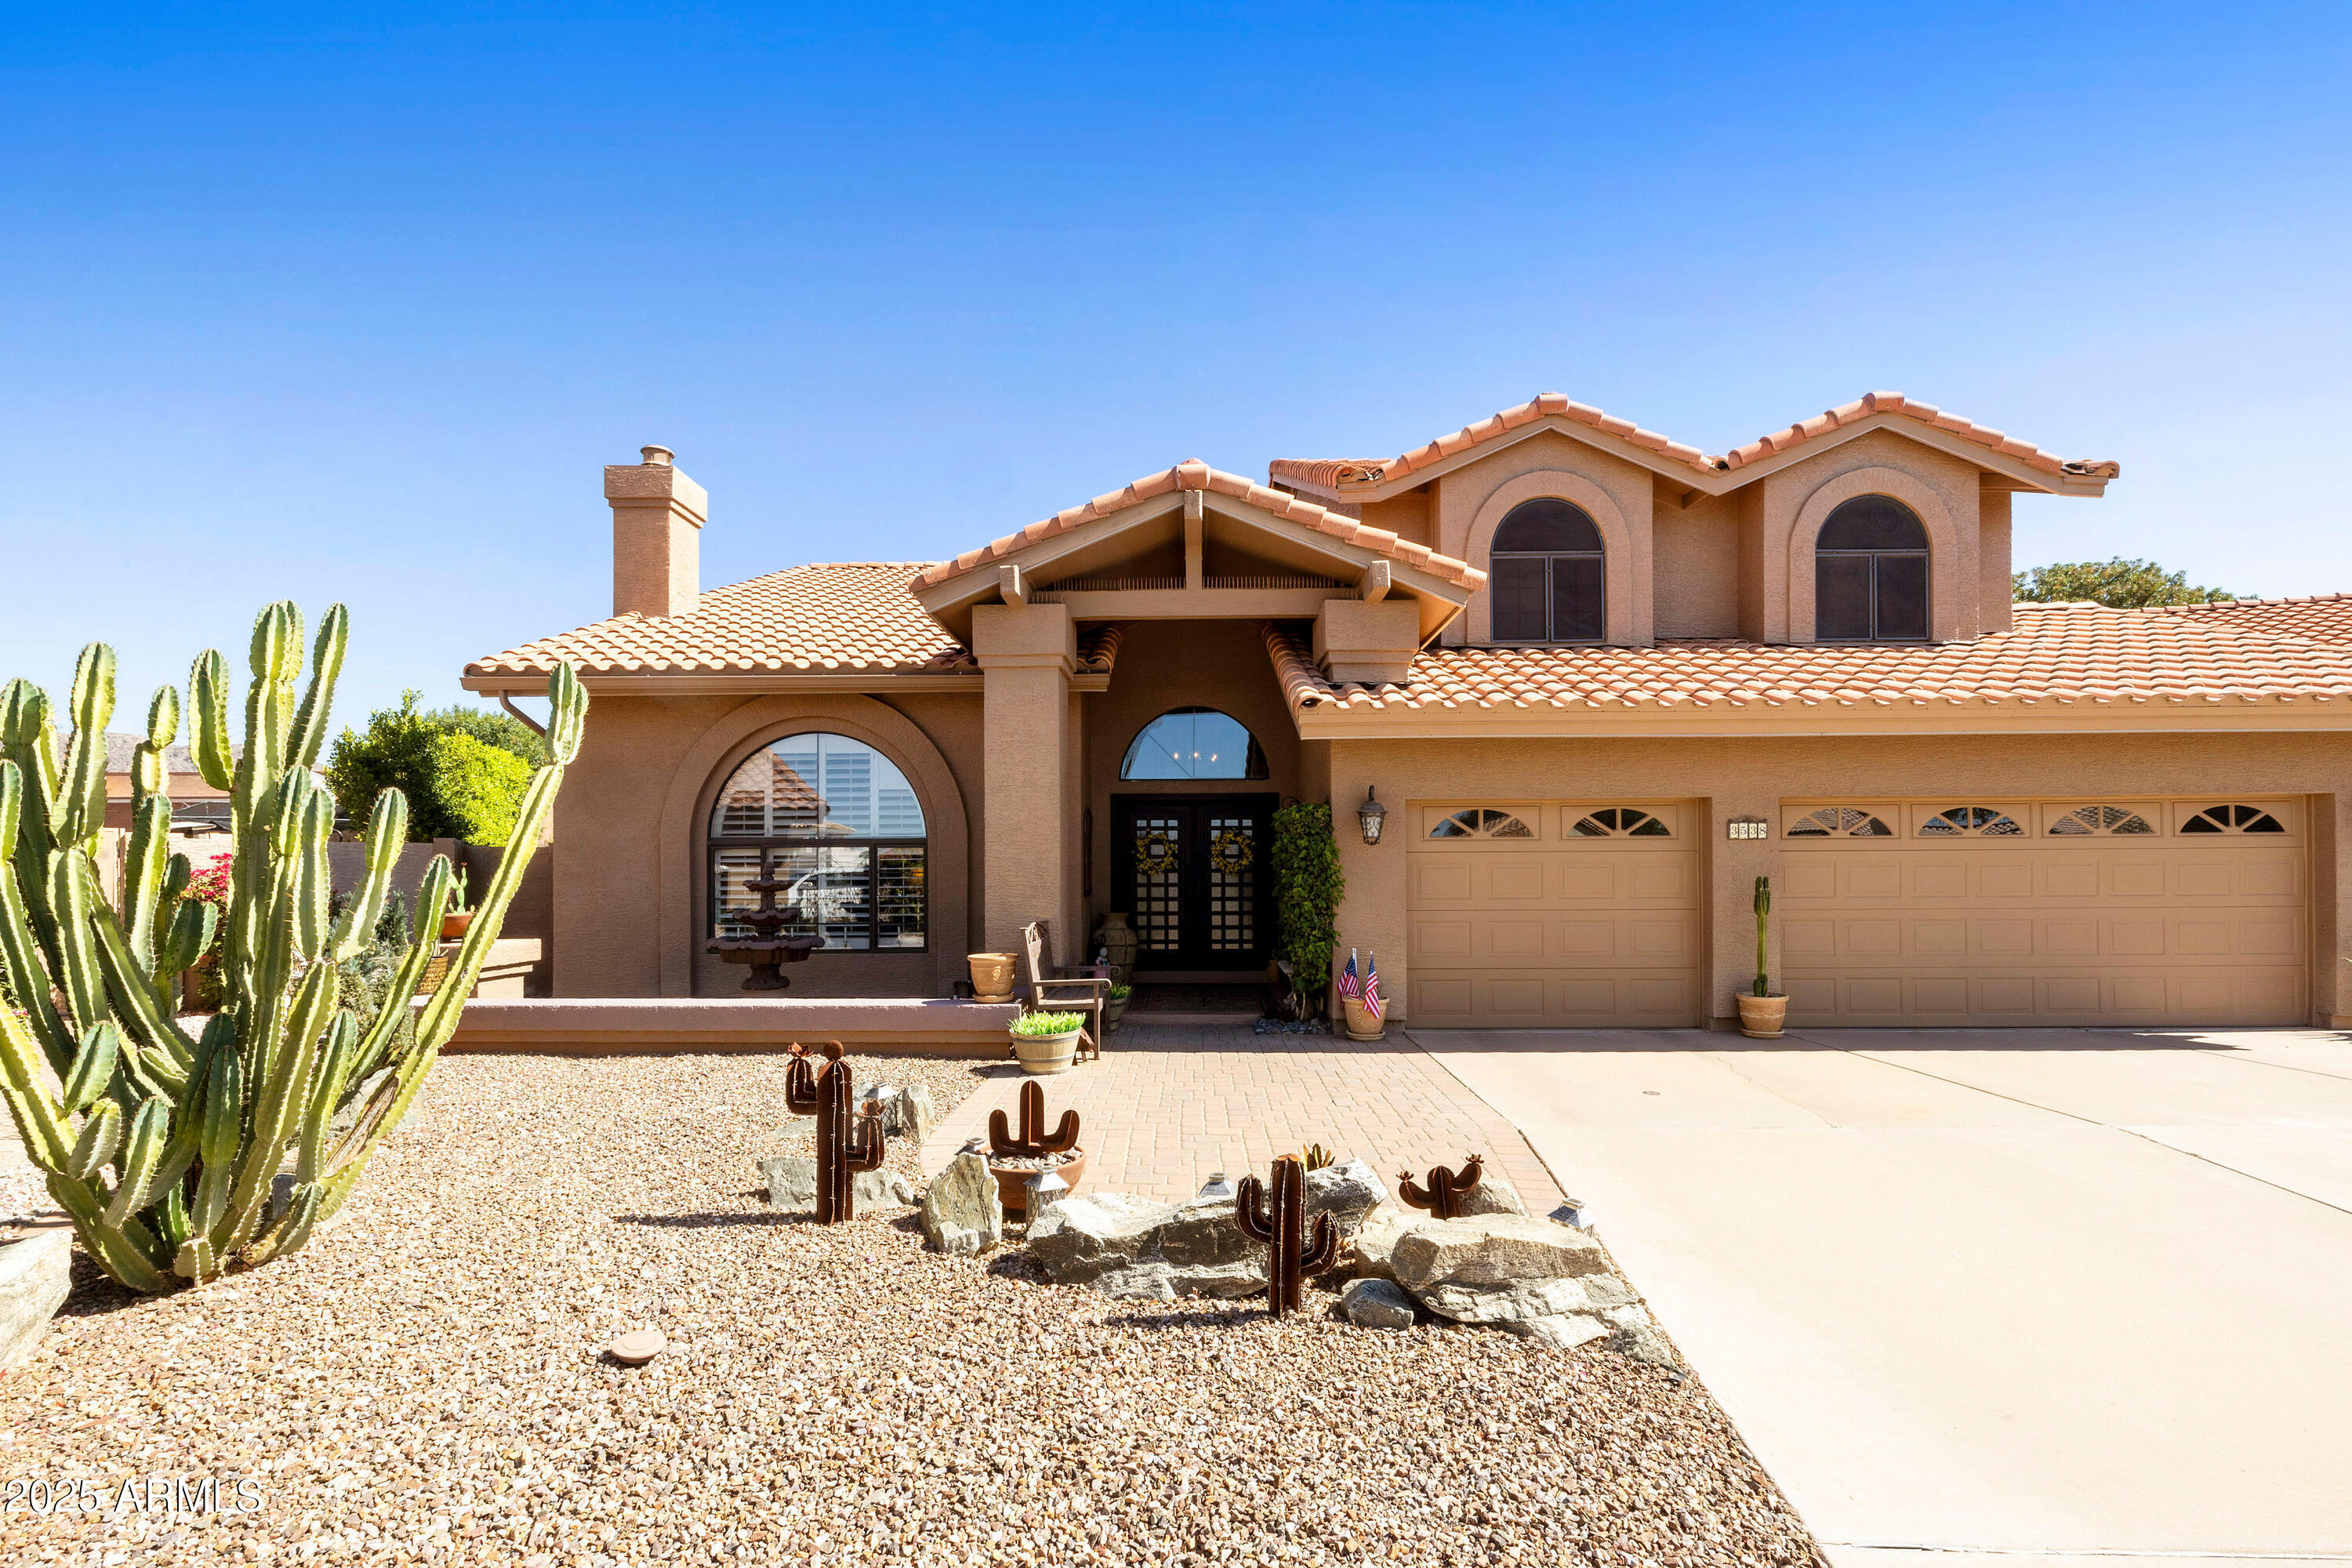
Active
$850,000
4
bds
|
3
ba
|
3,010
sqft
|
built
1987
3538 E Squawbush Pl, Phoenix, AZ 85044
$-1,218
Cash flow
-7.5%
Cash-on-Cash Return
4.0%
Cap rate
0.5%
Rent to Value Ratio
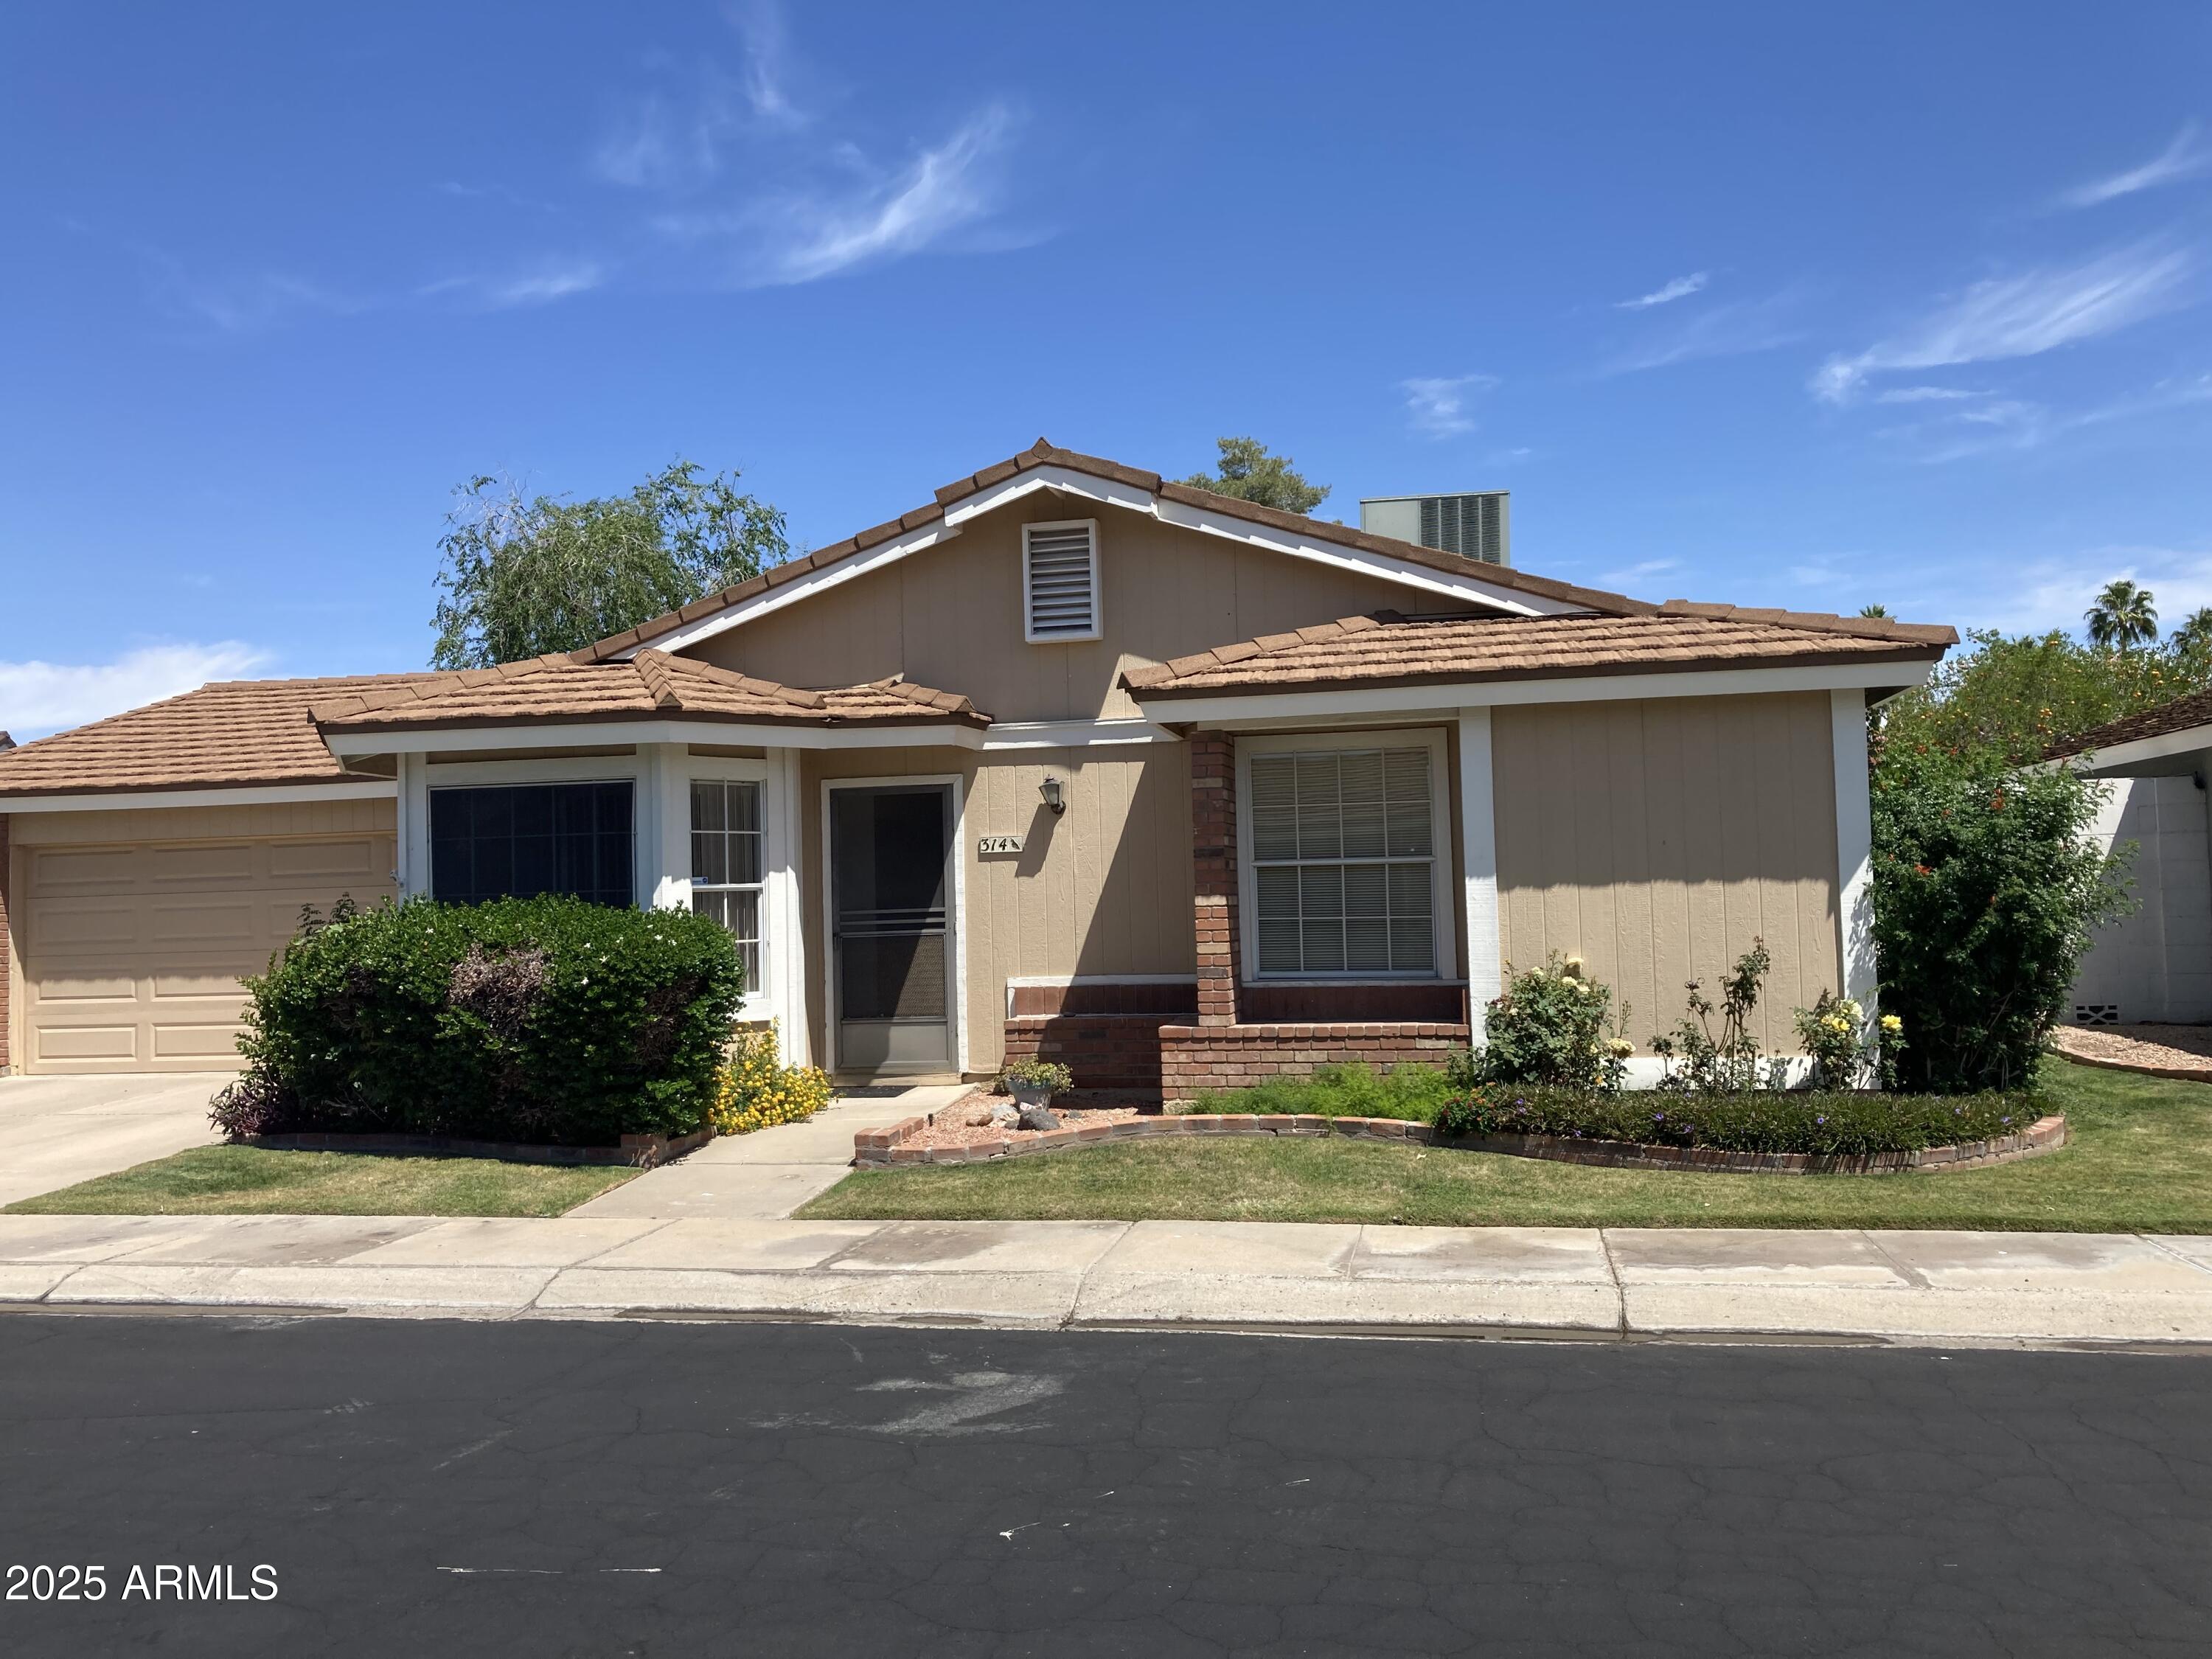
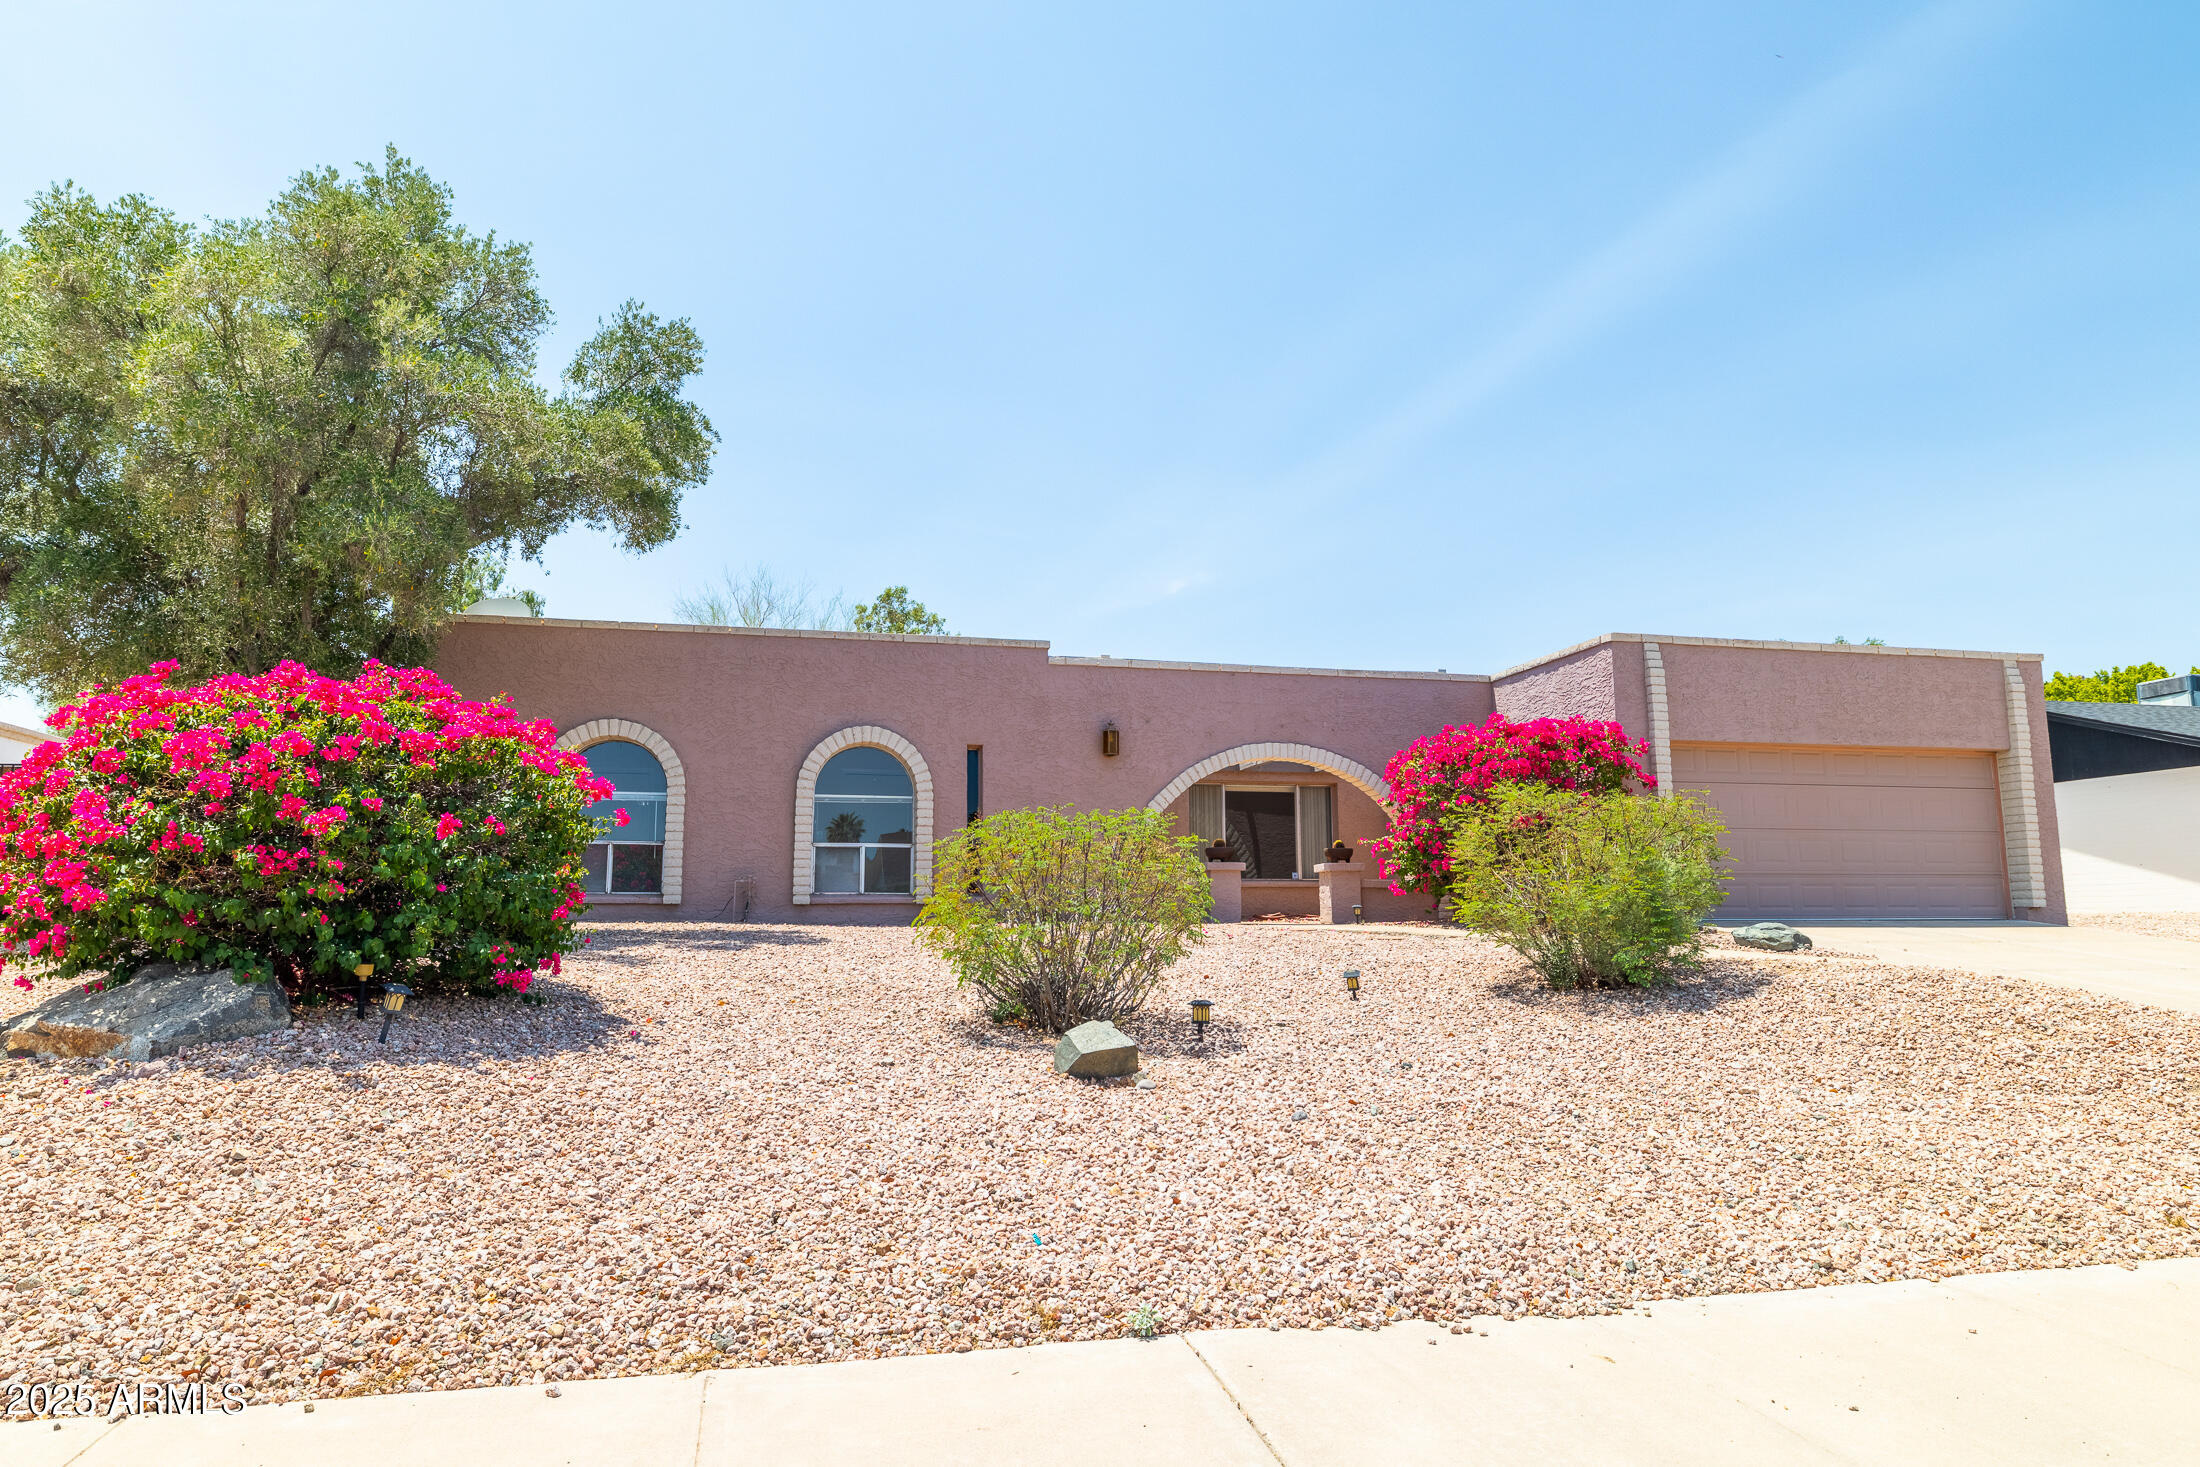
Active
$399,000
3
bds
|
2
ba
|
1,327
sqft
|
built
1985
314 E Campo Bello Dr, Phoenix, AZ 85022
$-628
Cash flow
-8.2%
Cash-on-Cash Return
3.8%
Cap rate
0.6%
Rent to Value Ratio
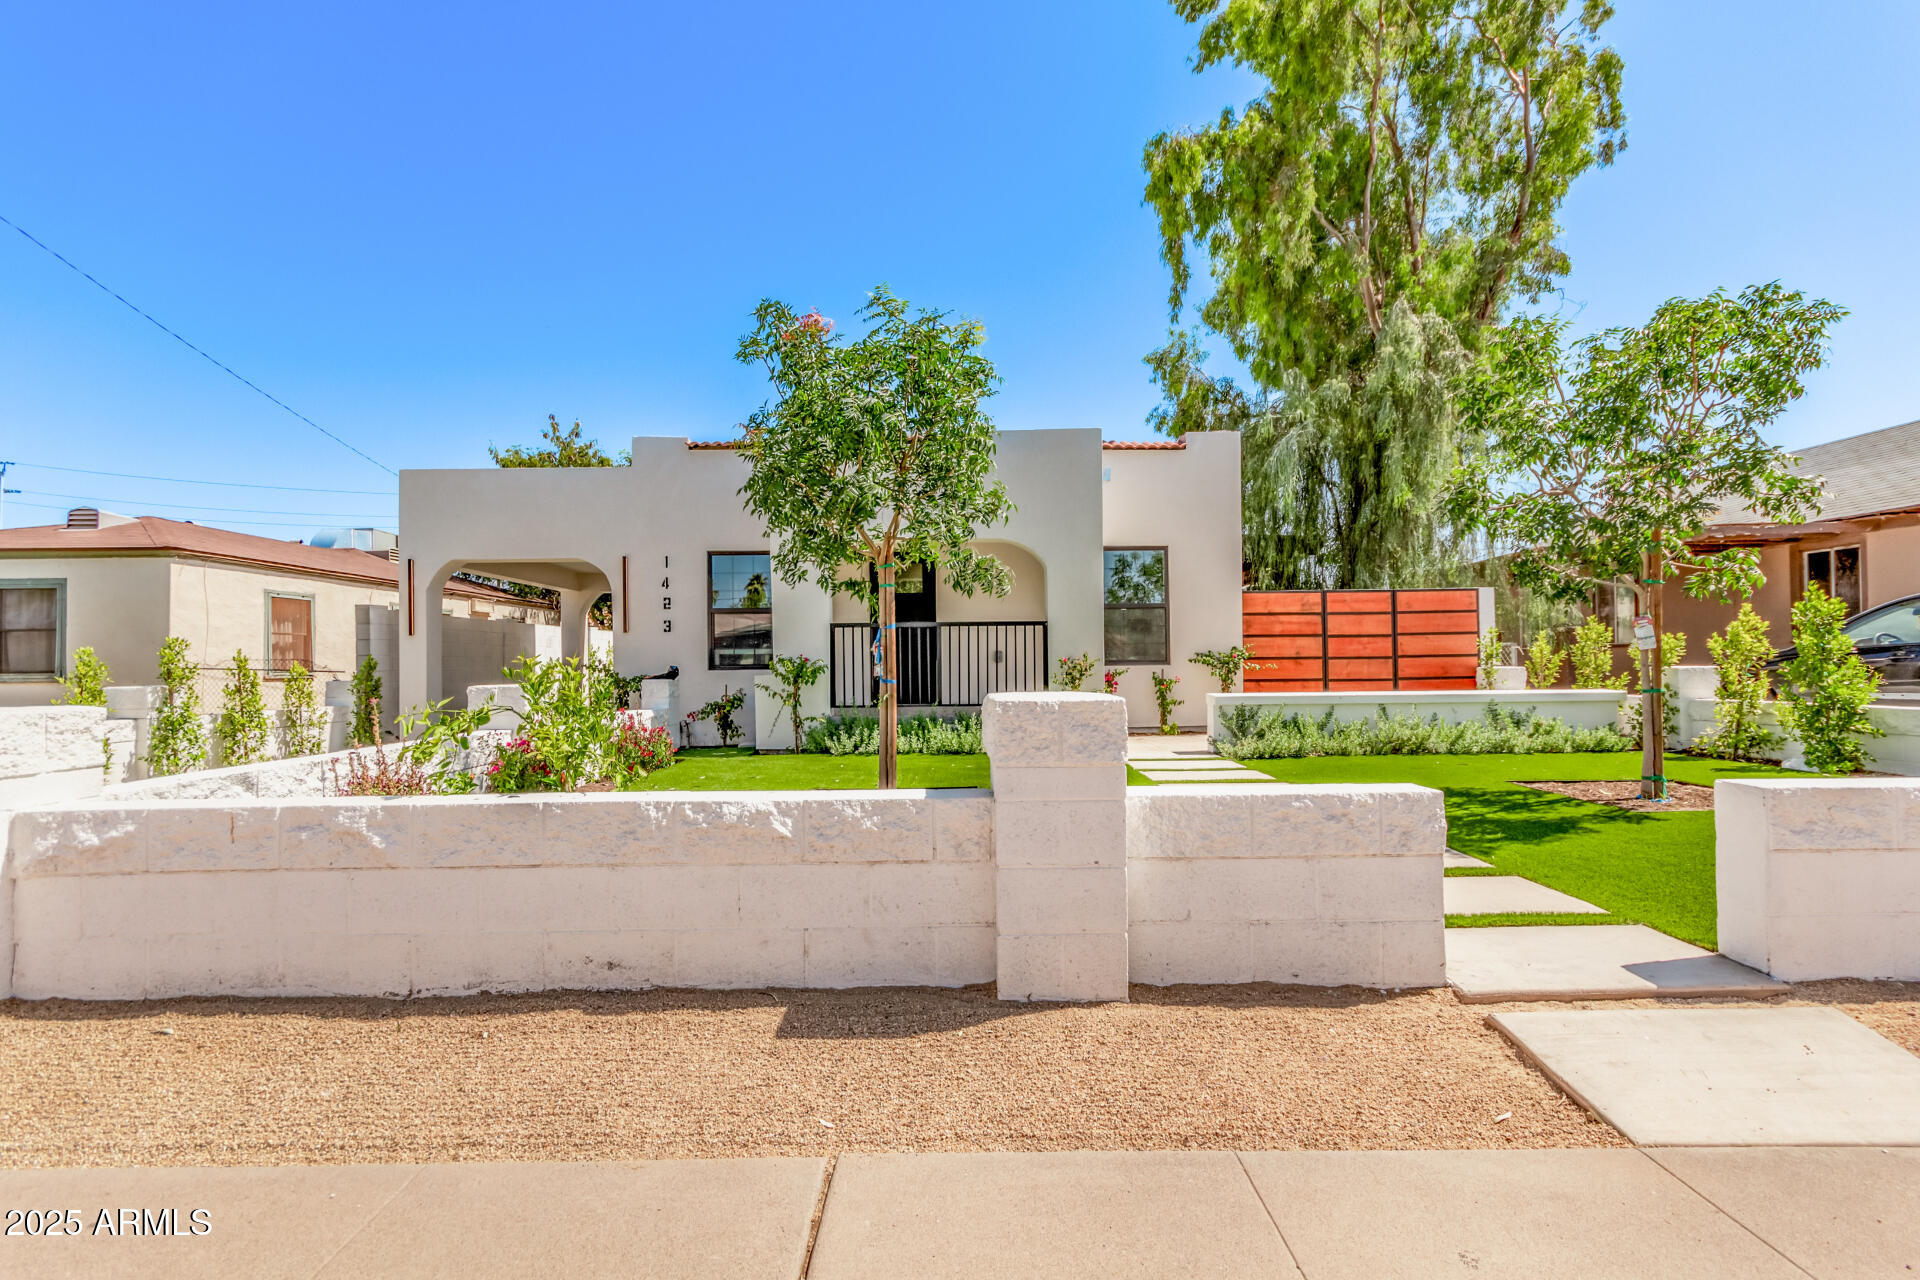
Active
$725,000
5
bds
|
0
ba
|
0
sqft
|
built
1936
1423 E Pierce St, Phoenix, AZ 85006
$-2,561
Cash flow
-18.4%
Cash-on-Cash Return
1.4%
Cap rate
0.2%
Rent to Value Ratio
Active
$785,000
3
bds
|
2
ba
|
1,928
sqft
|
built
1996
4338 E Hamblin Dr, Phoenix, AZ 85050
$-1,322
Cash flow
-8.8%
Cash-on-Cash Return
3.7%
Cap rate
0.5%
Rent to Value Ratio
Active
$605,000
4
bds
|
3
ba
|
2,405
sqft
|
built
1995
2114 E Escuda Rd, Phoenix, AZ 85024
$-846
Cash flow
-7.3%
Cash-on-Cash Return
4.0%
Cap rate
0.5%
Rent to Value Ratio

Active
$1,150,000
6
bds
|
4
ba
|
4,135
sqft
|
built
1995
2311 W Dobbins Rd, Phoenix, AZ 85041
$-3,430
Cash flow
-15.6%
Cash-on-Cash Return
2.1%
Cap rate
0.3%
Rent to Value Ratio
Active
$749,900
3
bds
|
2
ba
|
2,116
sqft
|
built
1997
5014 E Kirkland Rd, Phoenix, AZ 85054
$-1,834
Cash flow
-12.8%
Cash-on-Cash Return
2.7%
Cap rate
0.4%
Rent to Value Ratio
Active
$1,600,000
4
bds
|
3
ba
|
3,002
sqft
|
built
2021
3834 E Clarendon Ave, Phoenix, AZ 85018
$-2,570
Cash flow
-8.4%
Cash-on-Cash Return
3.8%
Cap rate
0.5%
Rent to Value Ratio
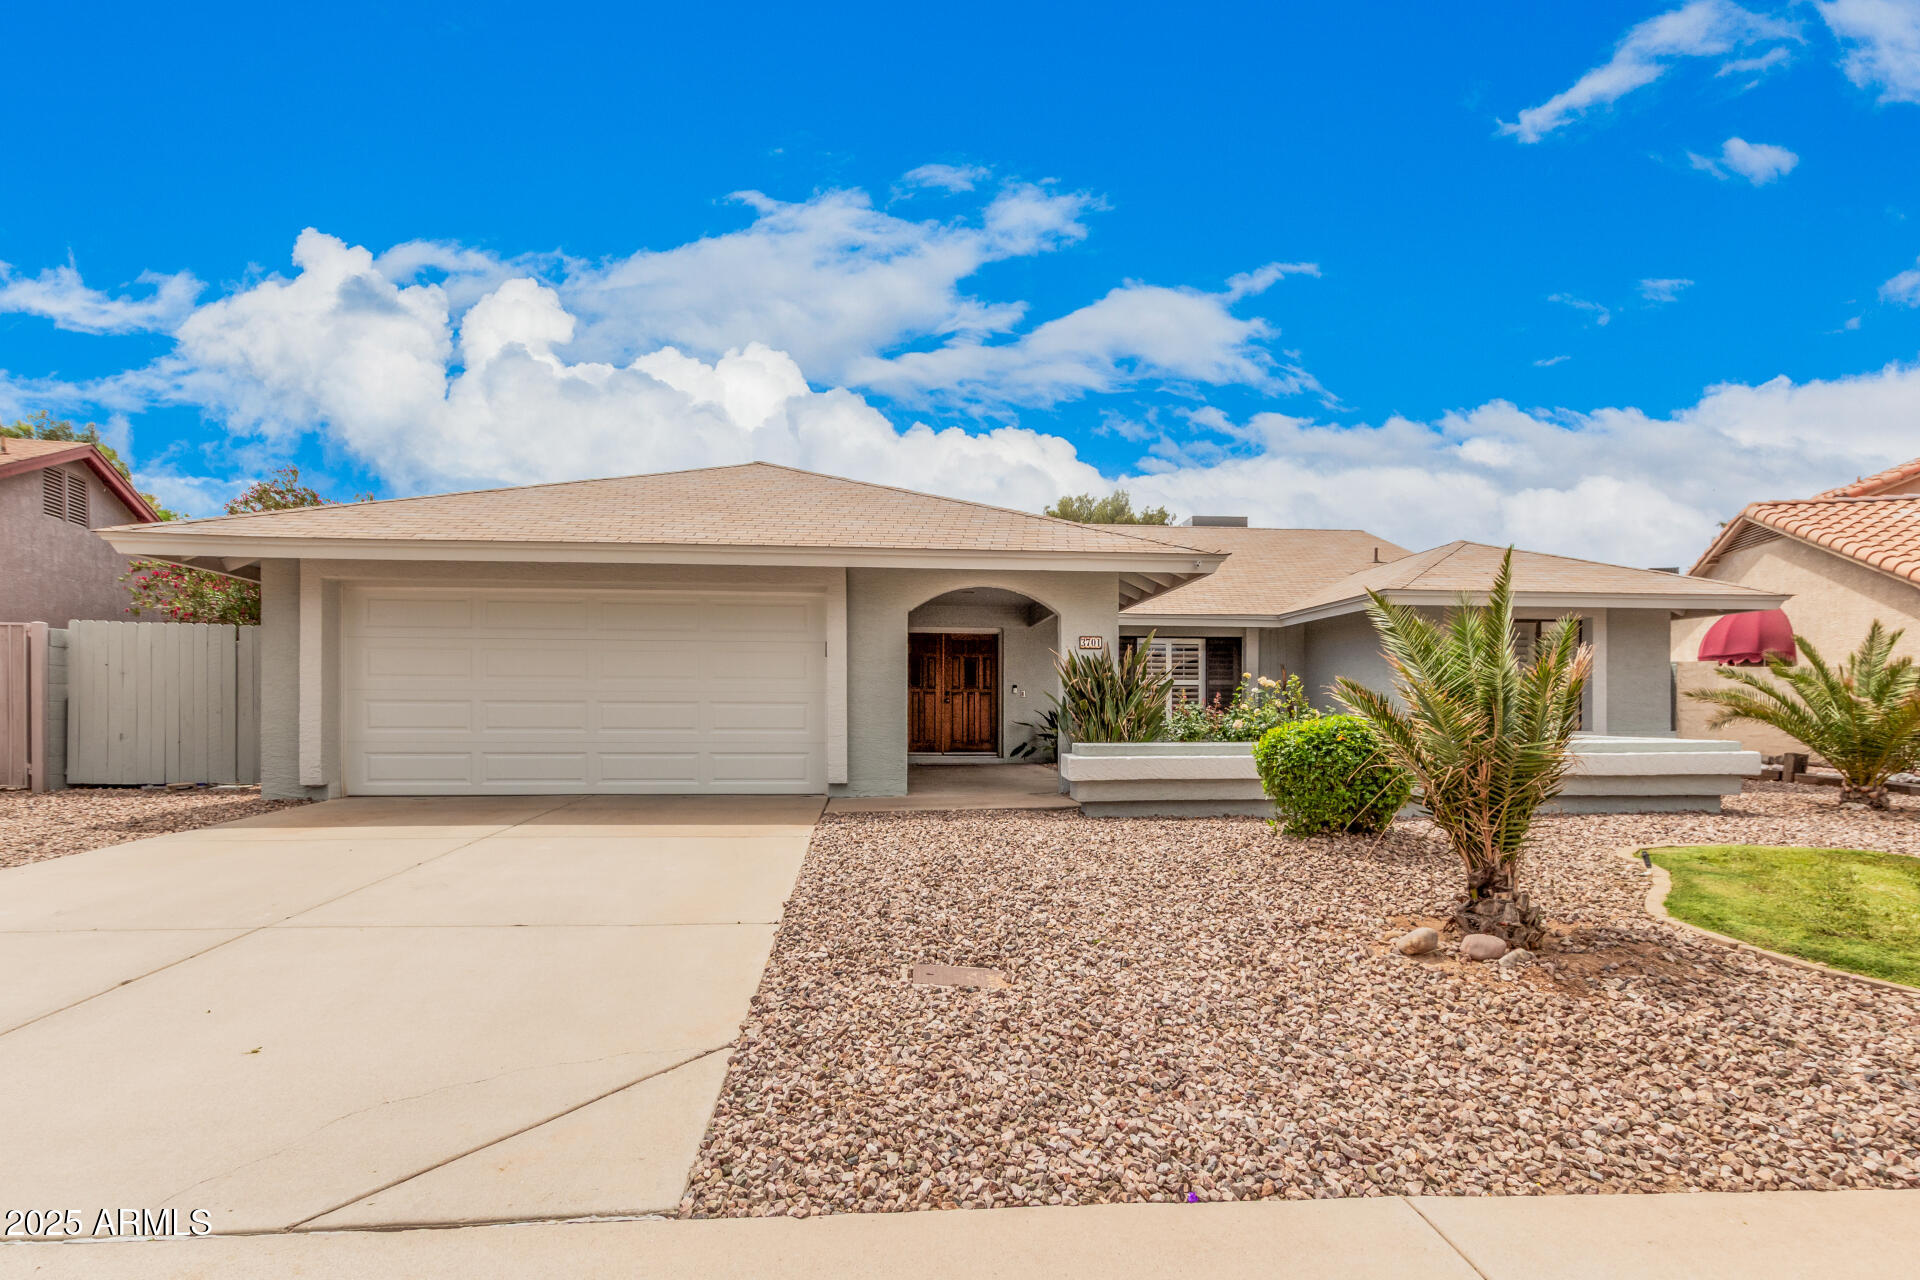
Active
$685,000
3
bds
|
2
ba
|
2,095
sqft
|
built
1986
3701 E Morrow Dr, Phoenix, AZ 85050
$-1,514
Cash flow
-11.5%
Cash-on-Cash Return
3.0%
Cap rate
0.4%
Rent to Value Ratio
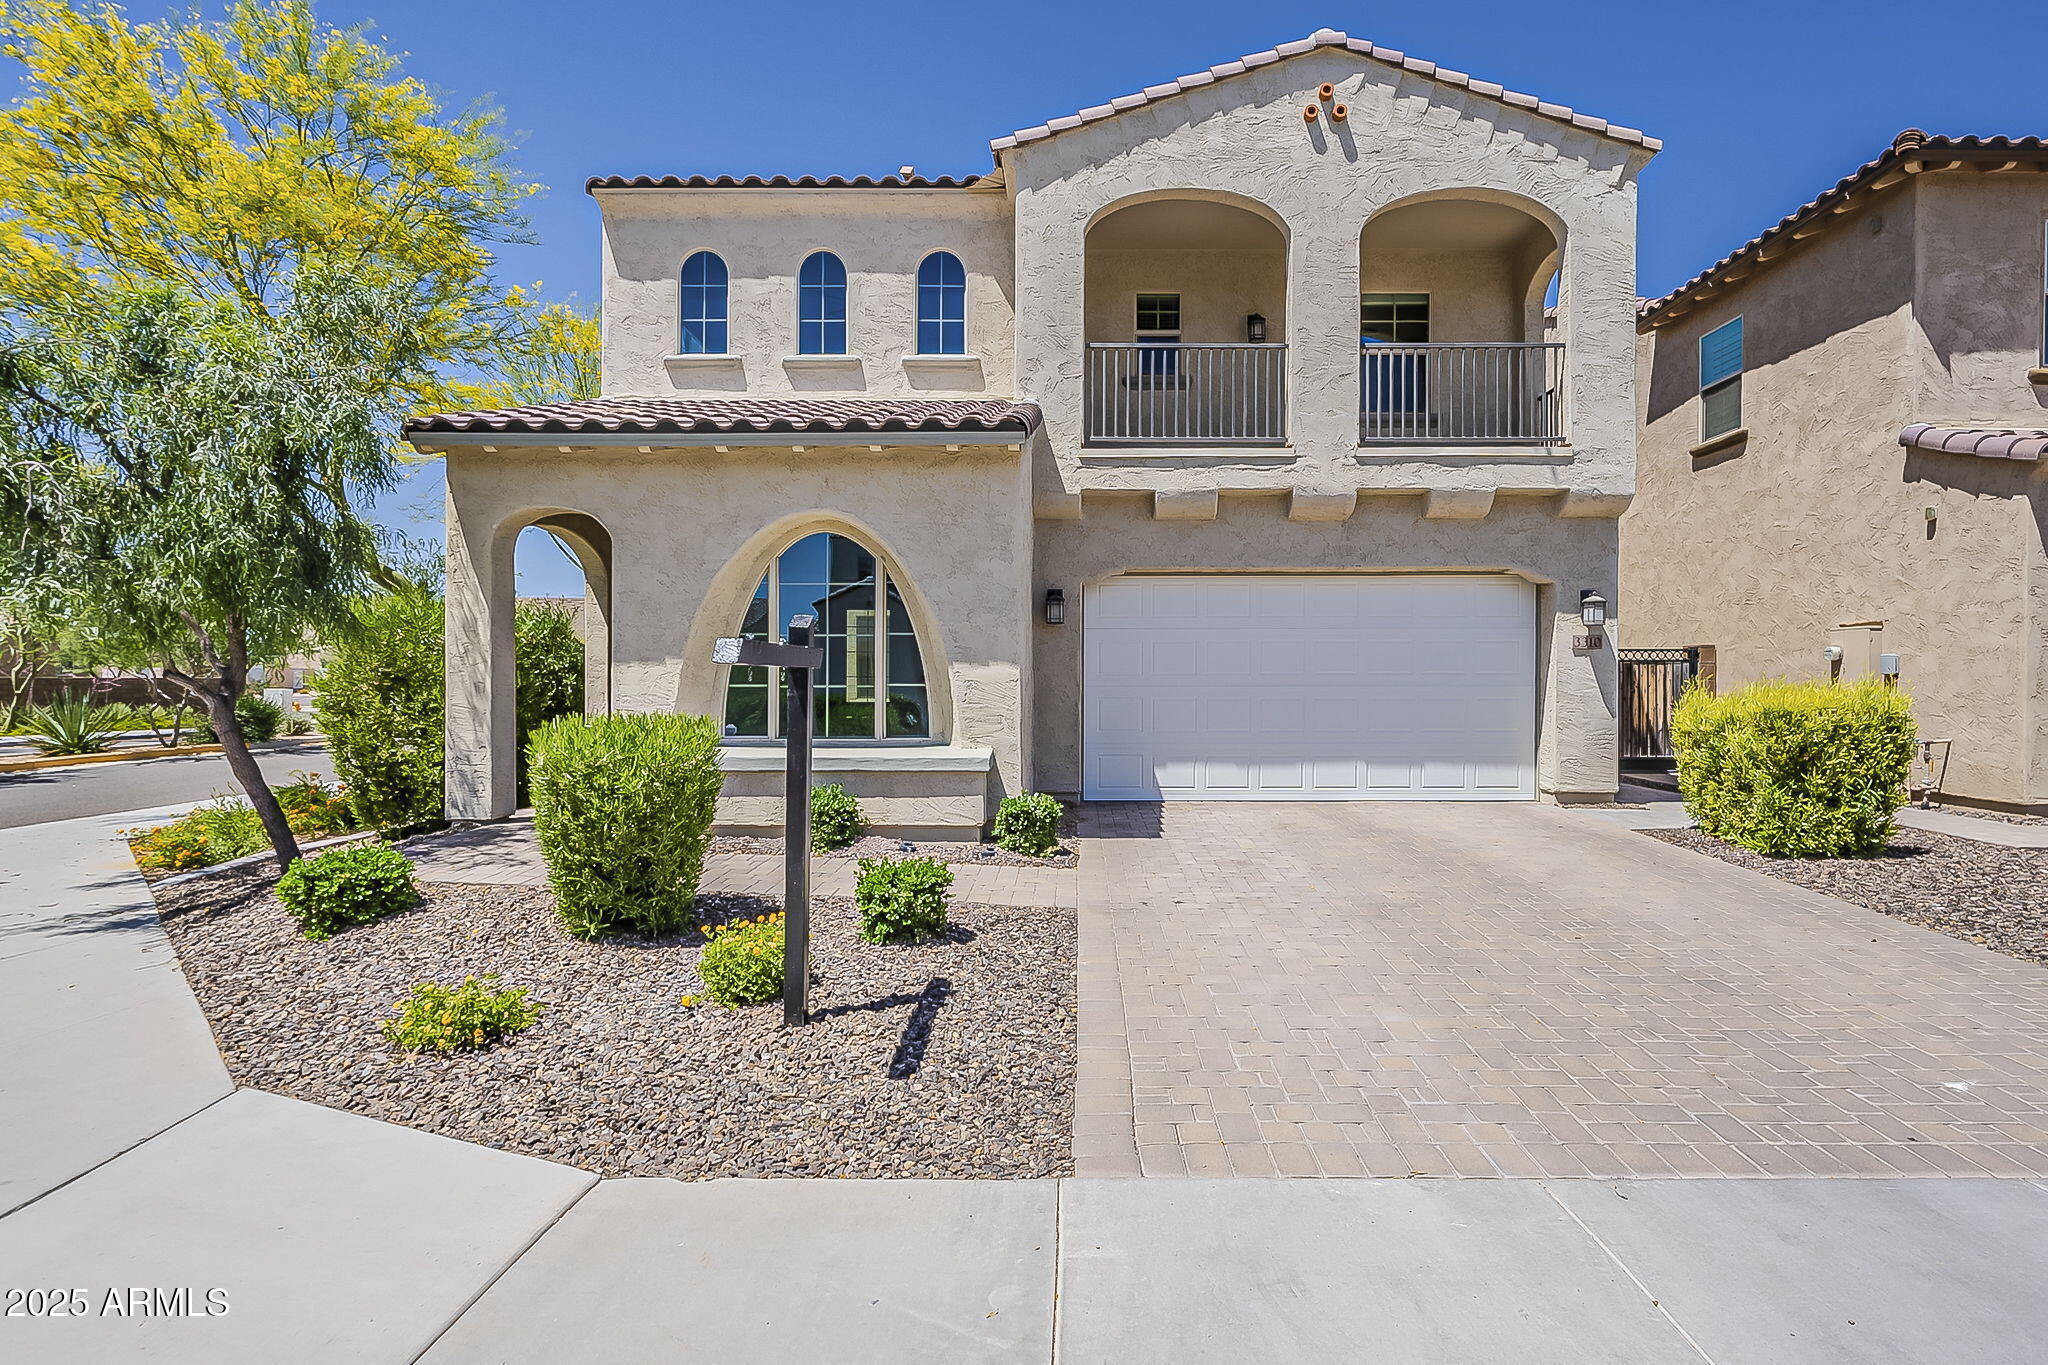
Active
$1,418,000
4
bds
|
4
ba
|
3,735
sqft
|
built
2019
3310 E Los Gatos Dr, Phoenix, AZ 85050
$-4,425
Cash flow
-16.3%
Cash-on-Cash Return
1.9%
Cap rate
0.3%
Rent to Value Ratio
Active
$398,000
5
bds
|
2
ba
|
1,674
sqft
|
built
1960
6821 W Mariposa St, Phoenix, AZ 85033
$-254
Cash flow
-3.3%
Cash-on-Cash Return
4.9%
Cap rate
0.6%
Rent to Value Ratio
Active
$495,000
3
bds
|
2
ba
|
1,152
sqft
|
built
1955
3837 E Yale St, Phoenix, AZ 85008
$-806
Cash flow
-8.5%
Cash-on-Cash Return
3.7%
Cap rate
0.5%
Rent to Value Ratio
Active
$449,999
3
bds
|
2
ba
|
1,289
sqft
|
built
1979
3415 E Anderson Dr, Phoenix, AZ 85032
$-523
Cash flow
-6.1%
Cash-on-Cash Return
4.3%
Cap rate
0.6%
Rent to Value Ratio

Active
$625,000
3
bds
|
2
ba
|
1,350
sqft
|
built
1941
1110 W Heatherbrae Dr, Phoenix, AZ 85013
$-1,547
Cash flow
-12.9%
Cash-on-Cash Return
2.7%
Cap rate
0.4%
Rent to Value Ratio
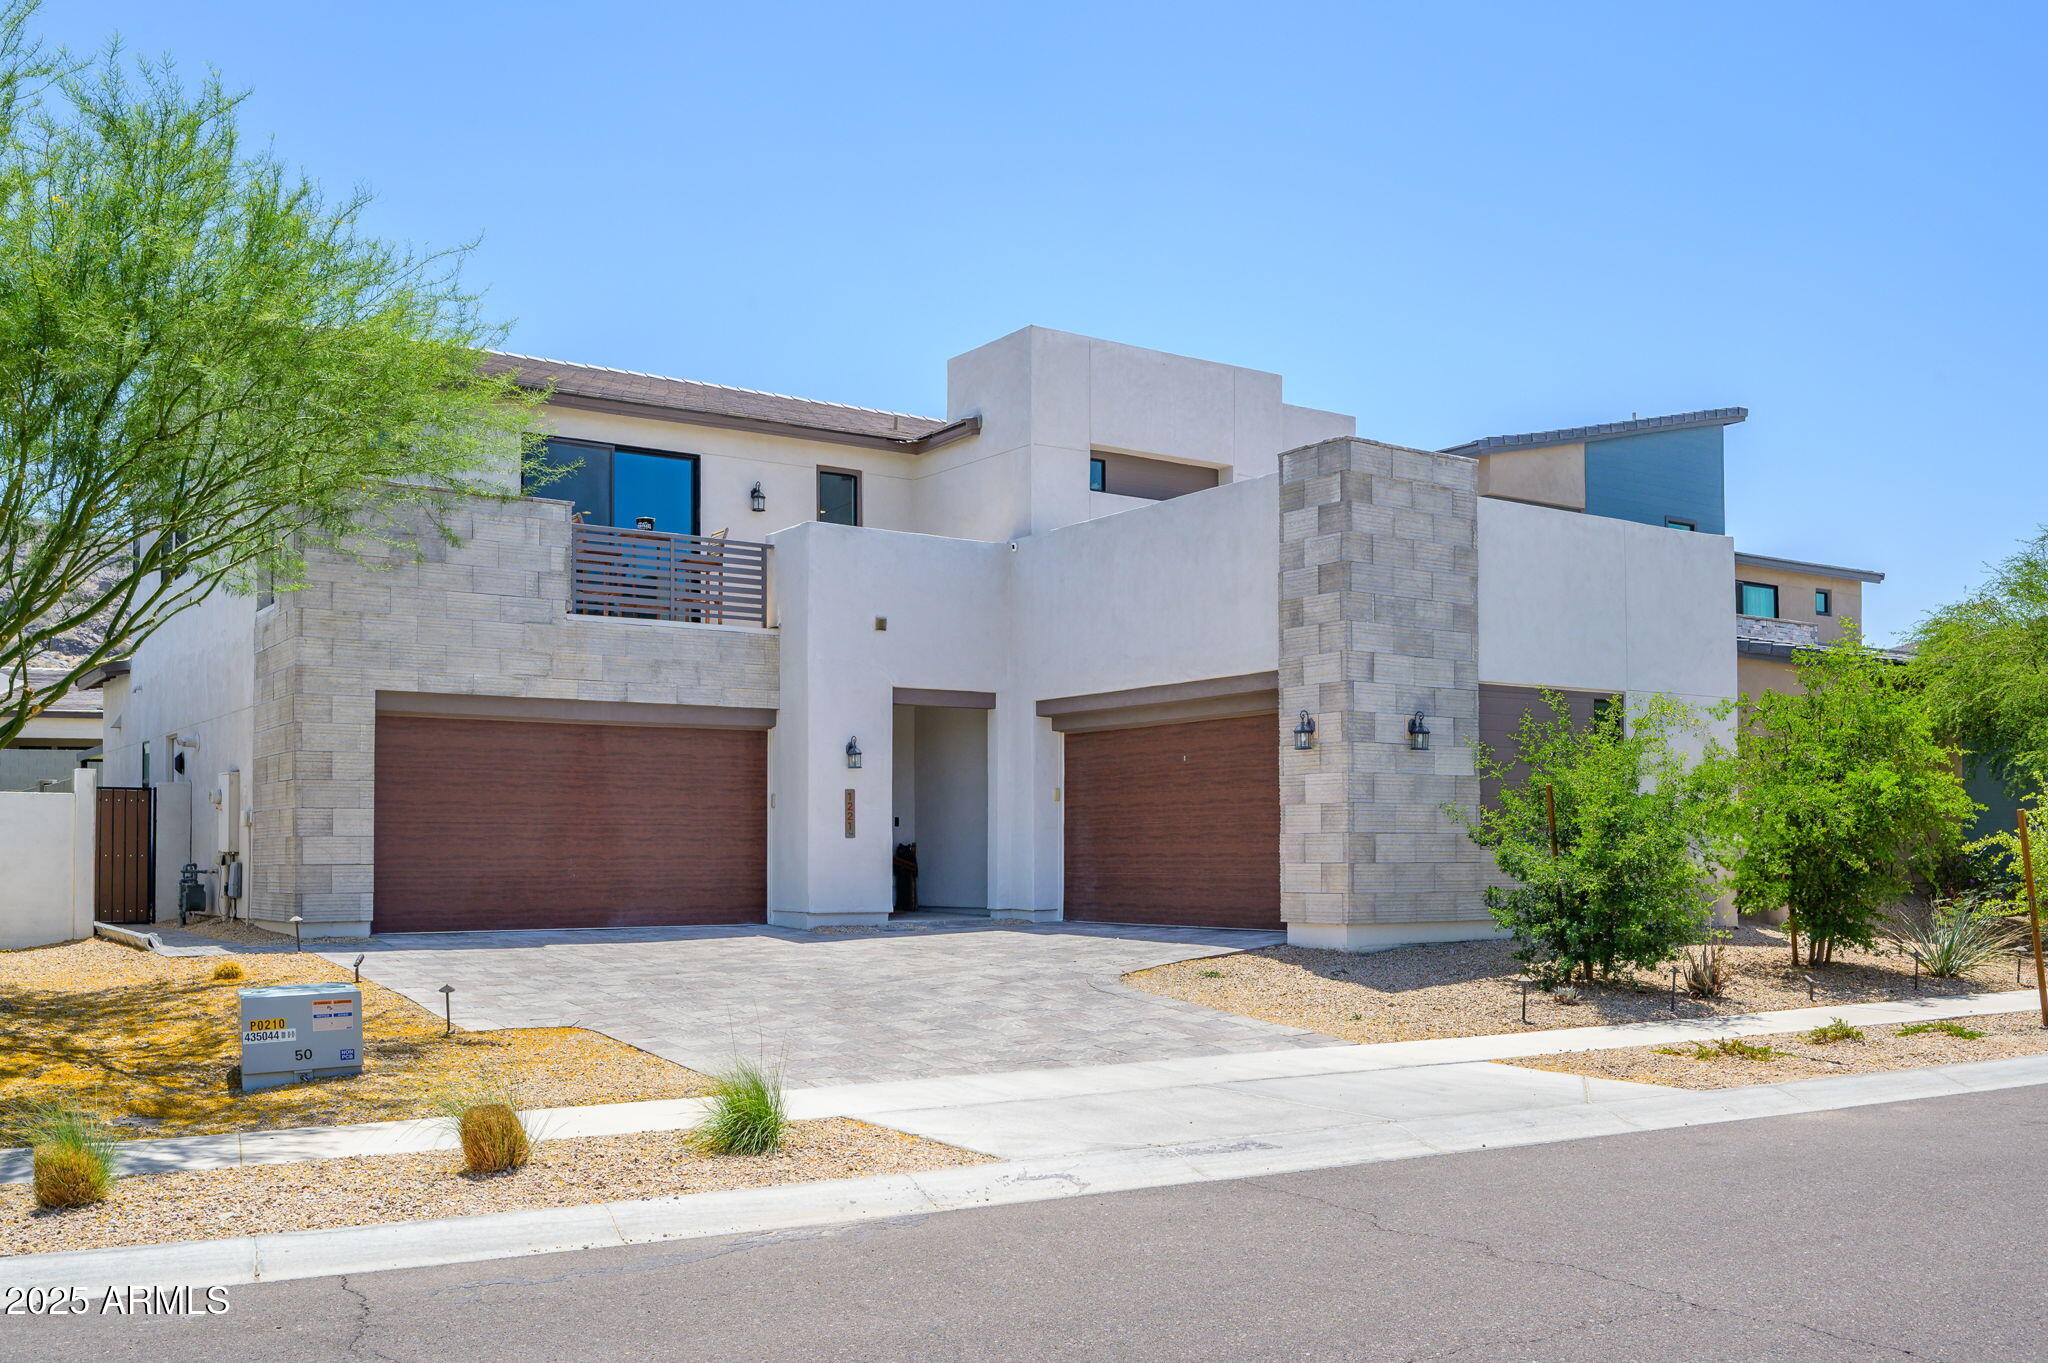
Active
$974,900
4
bds
|
4
ba
|
3,594
sqft
|
built
2020
1221 E Paseo Way, Phoenix, AZ 85042
$-2,712
Cash flow
-14.5%
Cash-on-Cash Return
2.3%
Cap rate
0.4%
Rent to Value Ratio
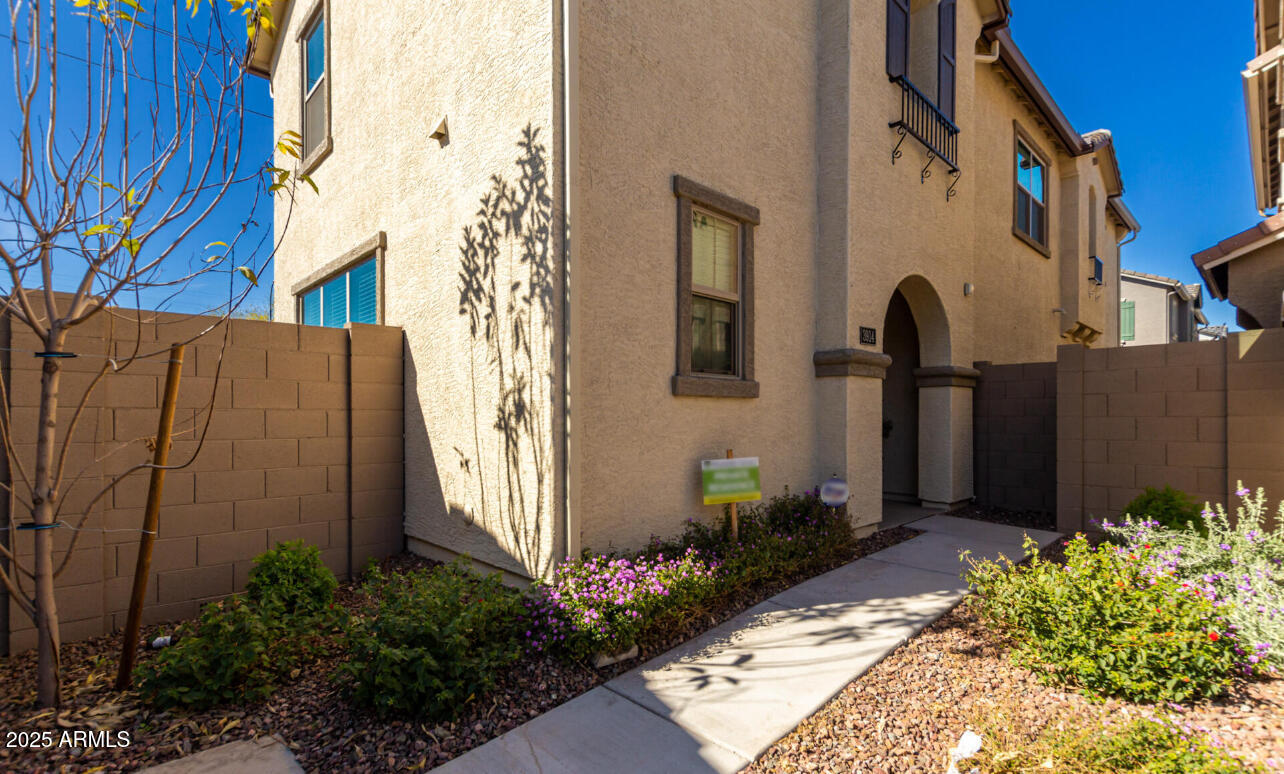
Active
$420,000
4
bds
|
3
ba
|
2,050
sqft
|
built
2022
3914 S 58th Ln, Phoenix, AZ 85043
$-787
Cash flow
-9.8%
Cash-on-Cash Return
3.4%
Cap rate
0.5%
Rent to Value Ratio