Phoenix, AZ Investment Properties for Sale
Browse homes for sale and investment properties in Phoenix, AZ. Refine your search by price, property type, or more.
Best cash flowing properties in Phoenix, AZ
Active
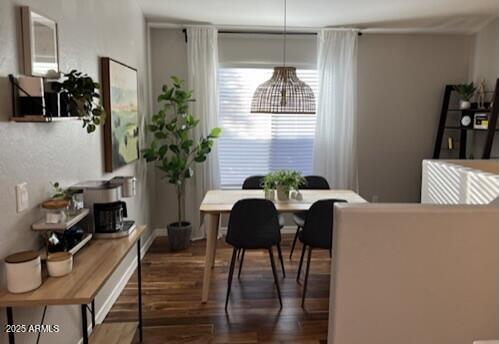
$304,900
2
bds
|
2
ba
|
1,209
sqft
|
built
2005
2150 E Bell Rd, Phoenix, AZ 85022
$259
Cash flow
4.4%
Cash-on-Cash Return
6.7%
Cap rate
0.9%
Rent to Value Ratio
Active
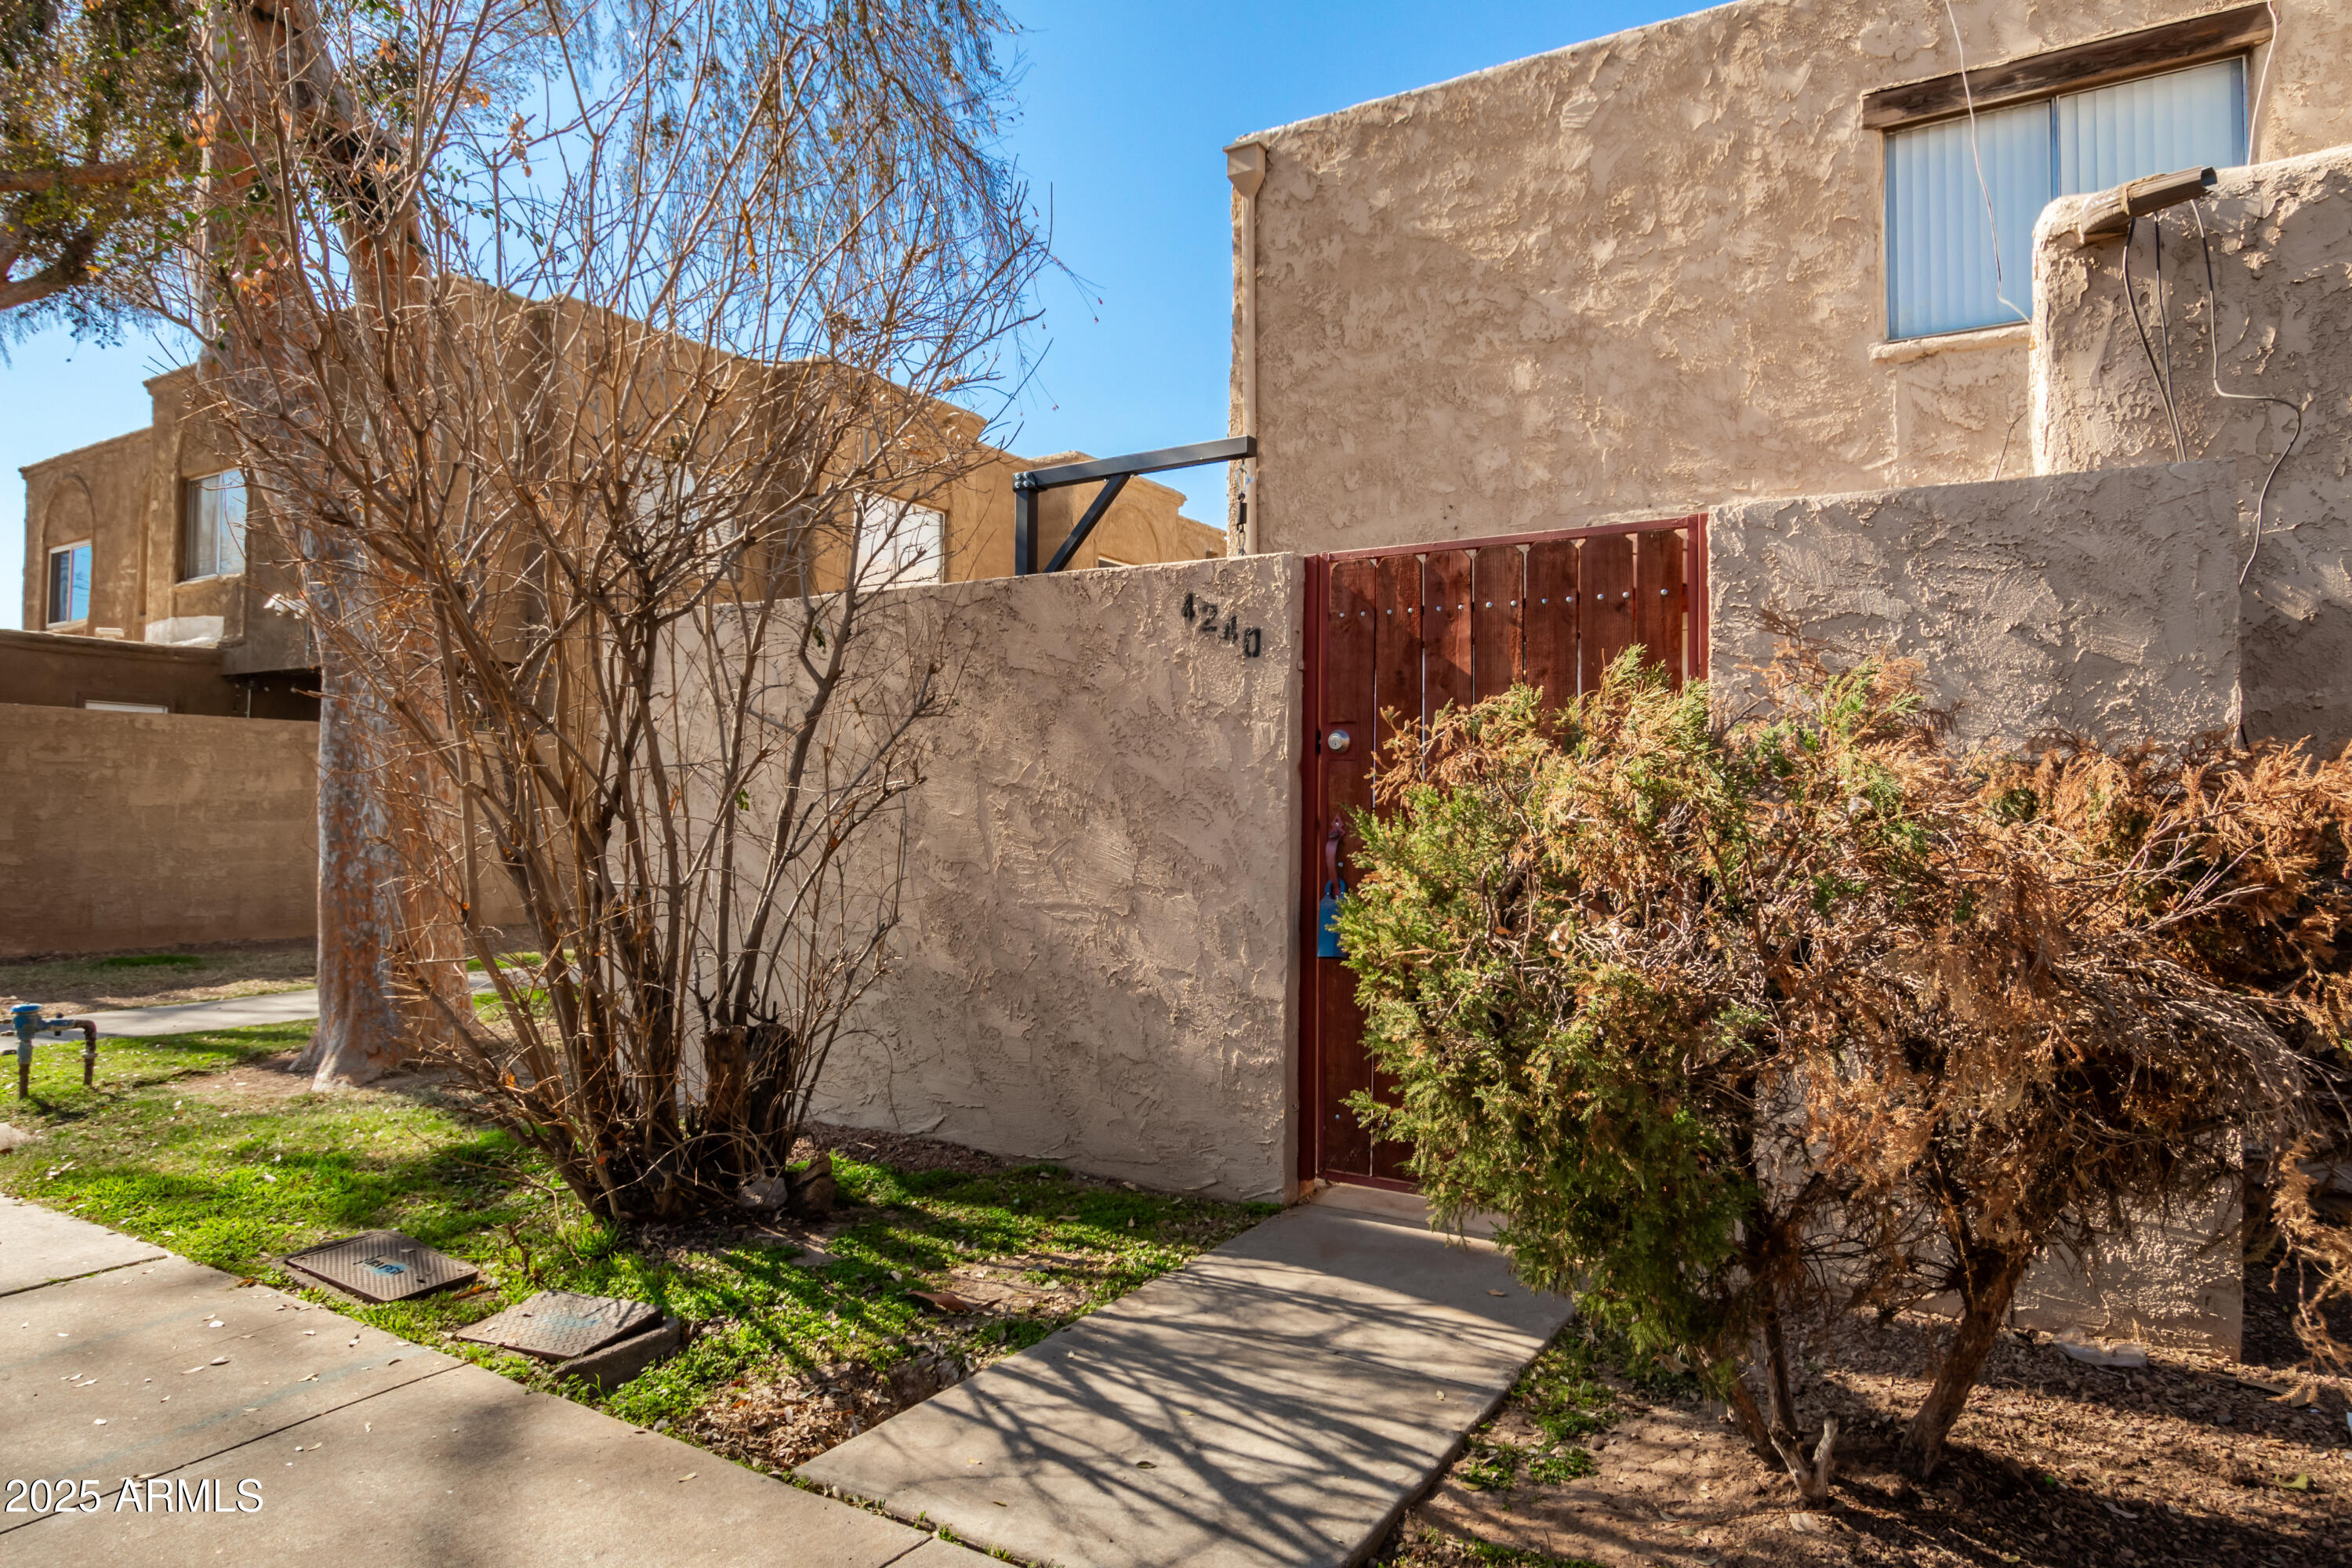
$209,900
2
bds
|
2
ba
|
966
sqft
|
built
1973
4240 N 67th Ln, Phoenix, AZ 85033
$-204
Cash flow
-5.1%
Cash-on-Cash Return
4.5%
Cap rate
0.8%
Rent to Value Ratio
336 out of 395 properties for sale in Phoenix, AZ
Limited Results Shown
Create a free account, or log in to reveal all property listings and enjoy the complete experience.
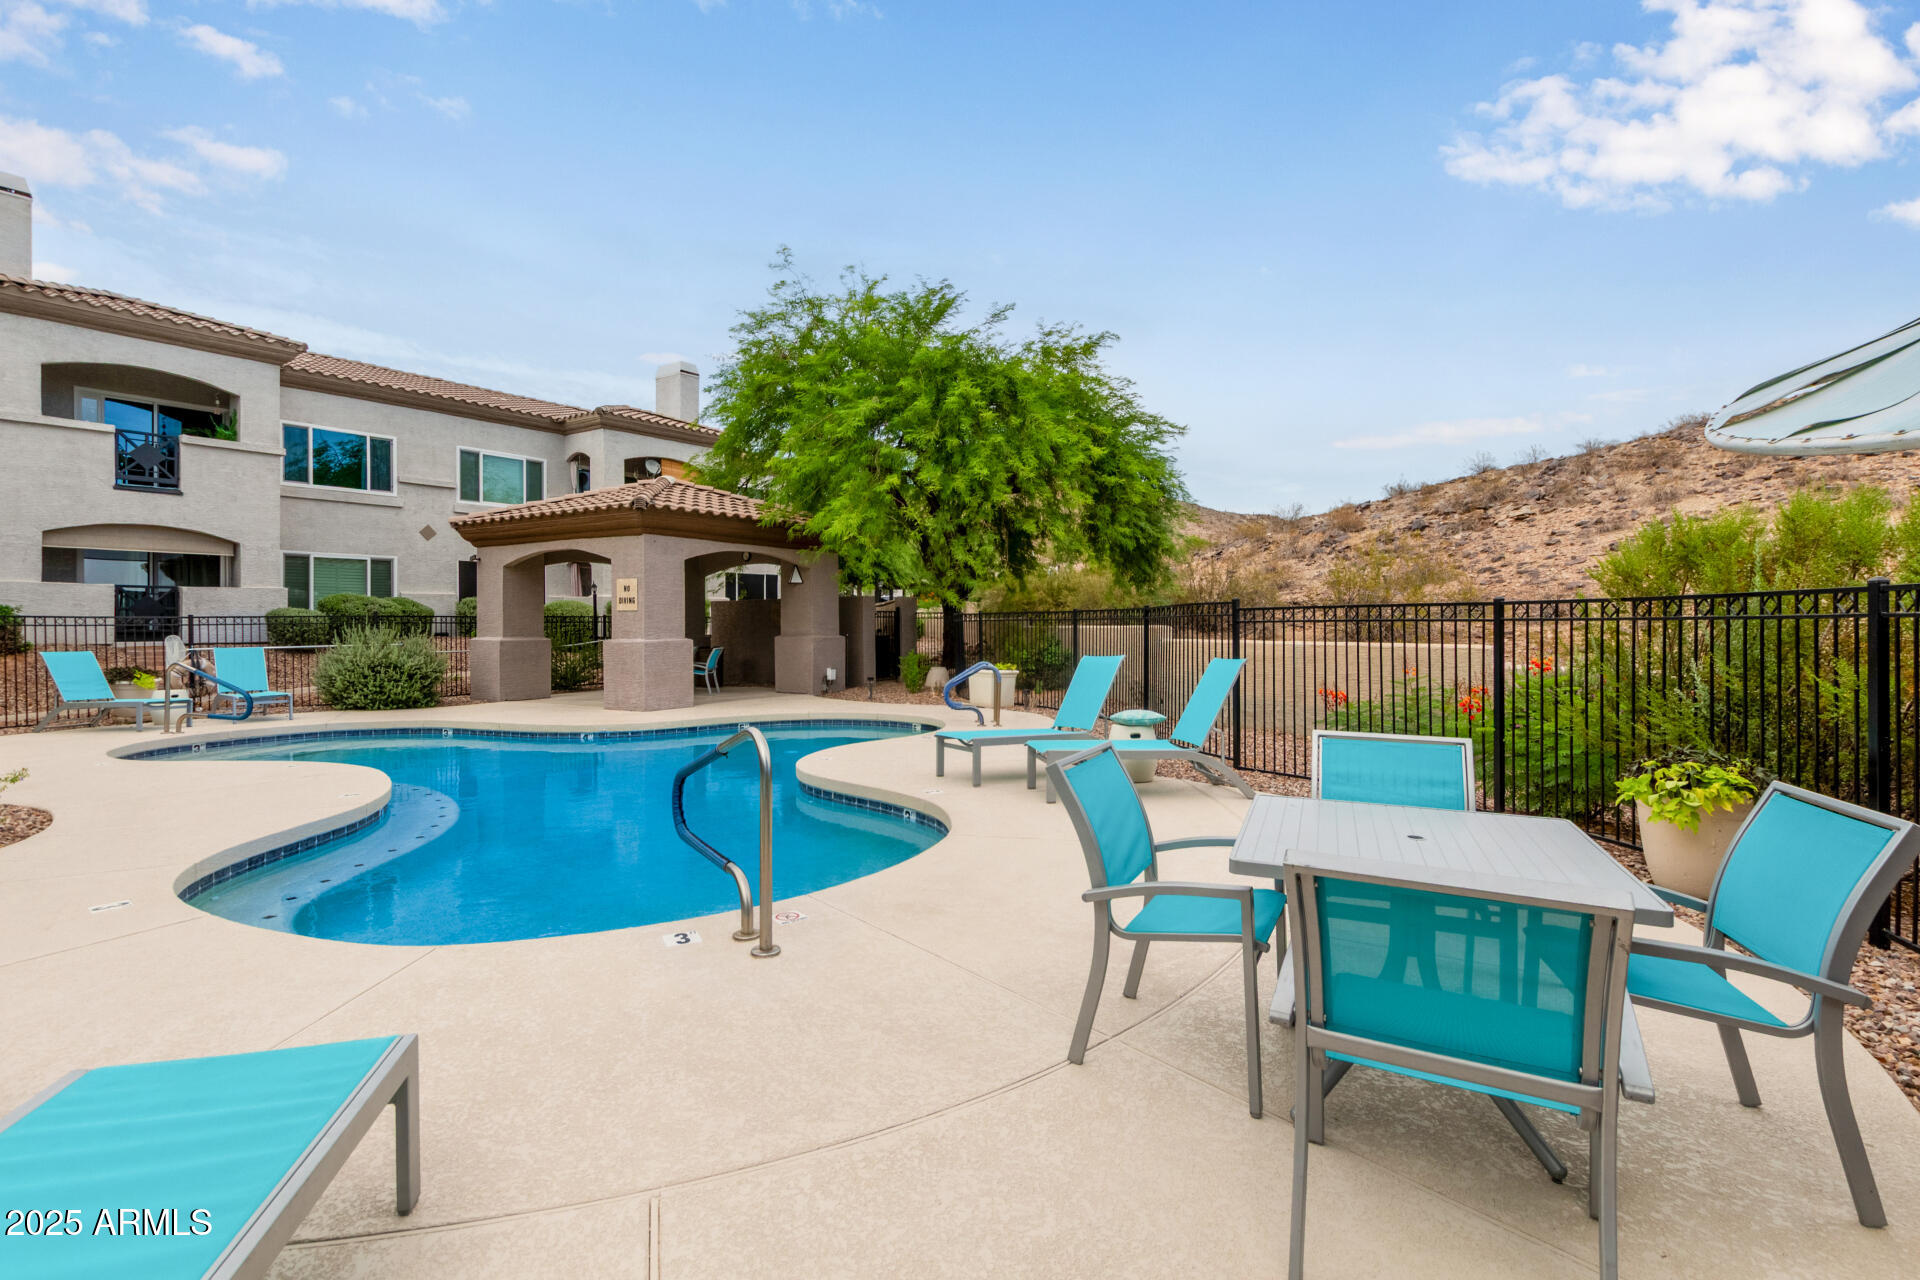
Active
$294,900
2
bds
|
1
ba
|
1,071
sqft
|
built
1996
3236 E Chandler Blvd, Phoenix, AZ 85048
$-537
Cash flow
-9.5%
Cash-on-Cash Return
3.5%
Cap rate
0.6%
Rent to Value Ratio
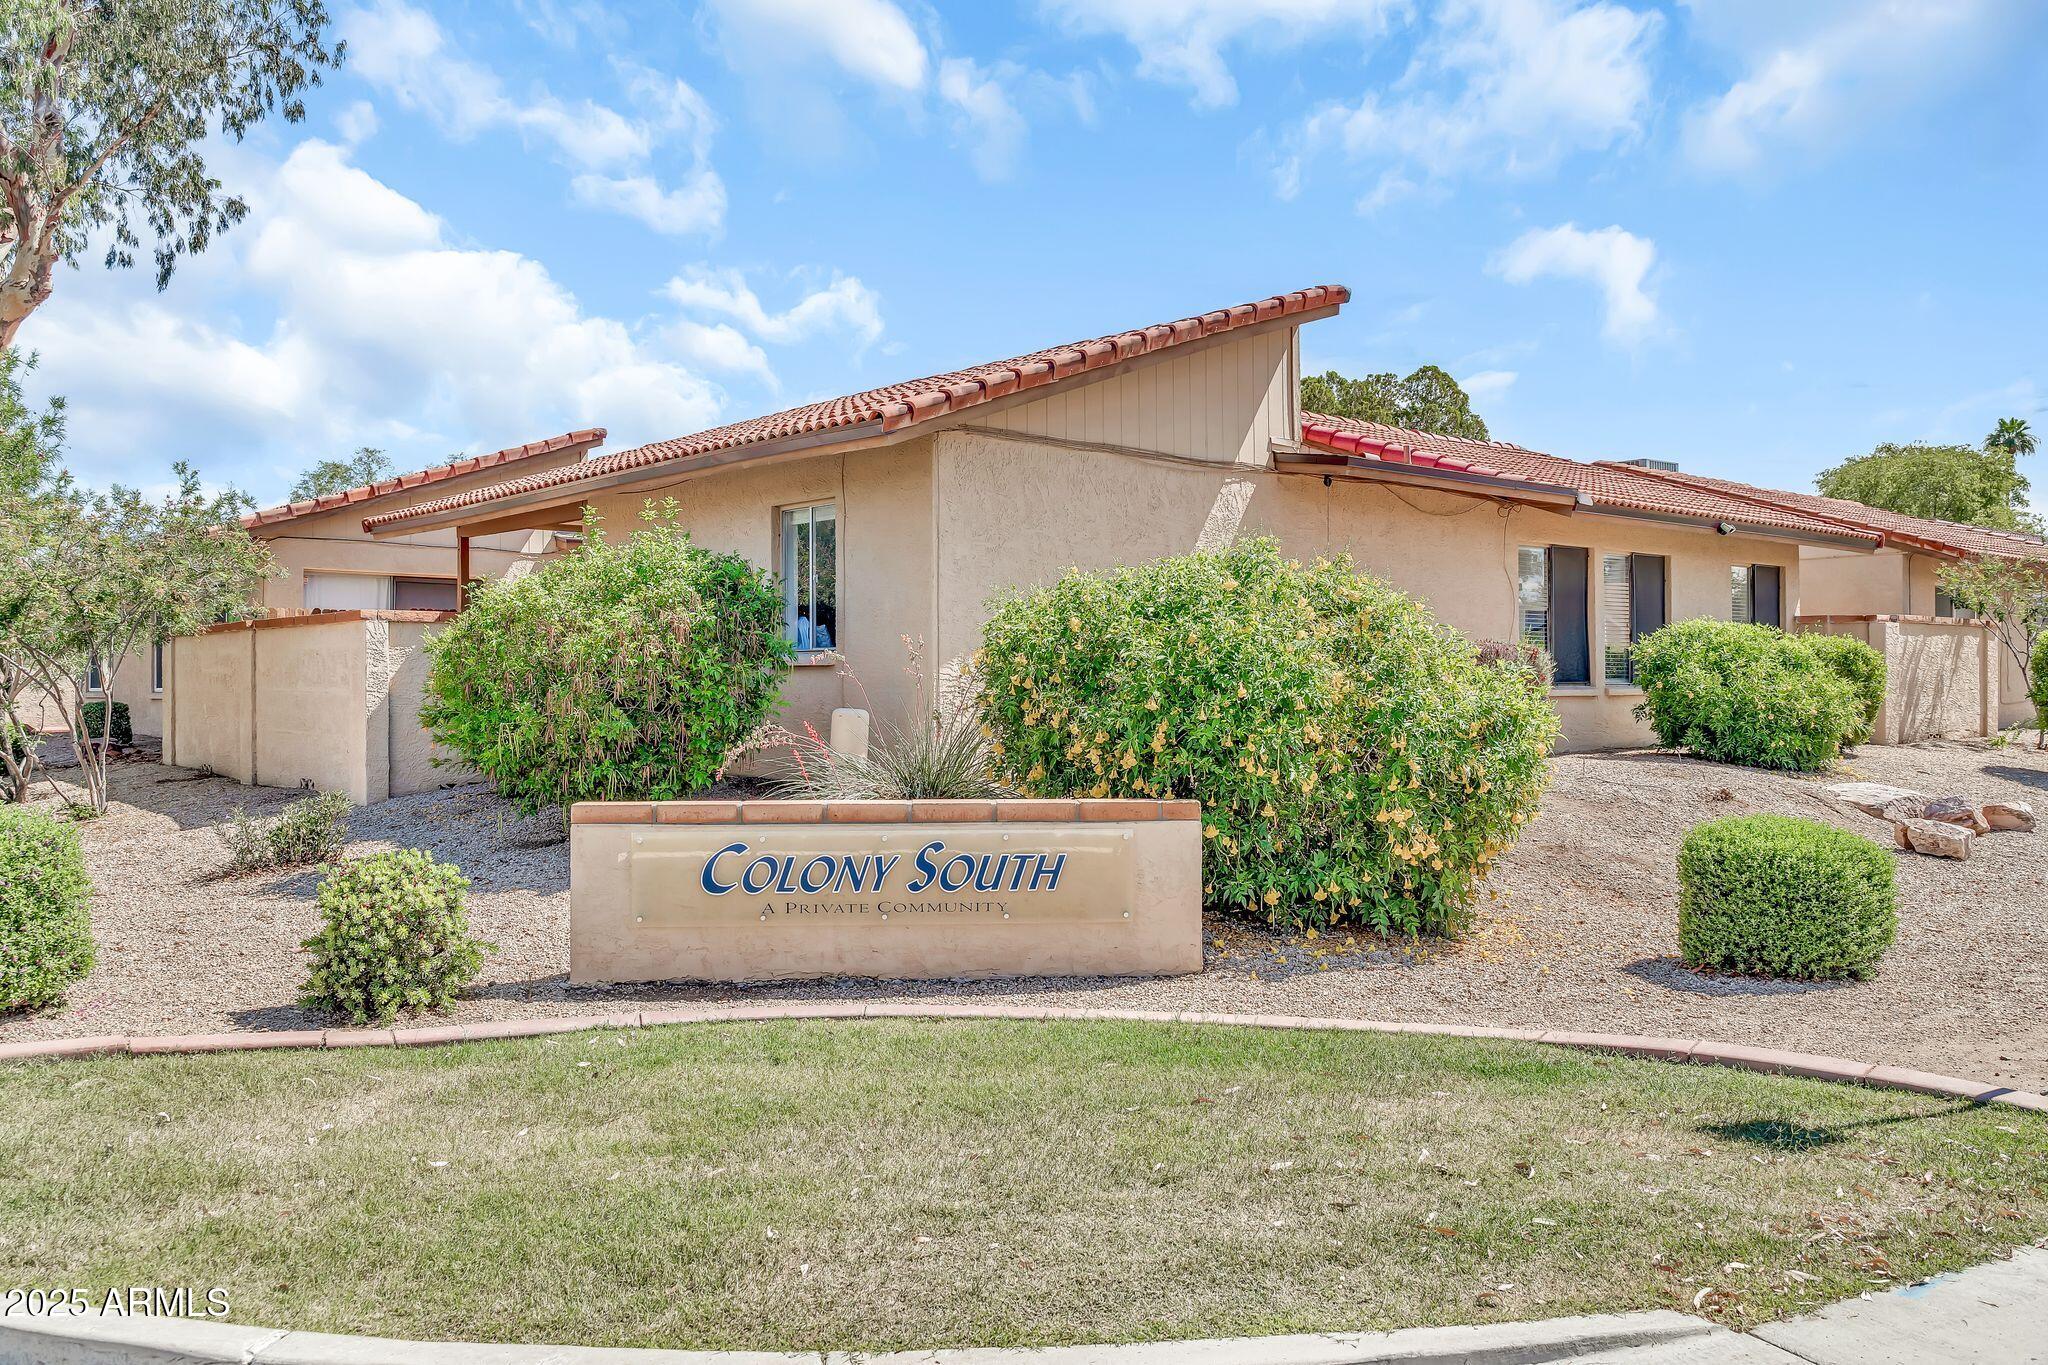
Active
$345,000
3
bds
|
2
ba
|
1,205
sqft
|
built
1981
14801 N 25th Dr, Phoenix, AZ 85023
$-484
Cash flow
-7.3%
Cash-on-Cash Return
4.0%
Cap rate
0.6%
Rent to Value Ratio
Active
$320,000
3
bds
|
3
ba
|
1,450
sqft
|
built
2004
1718 W Colter St, Phoenix, AZ 85015
$-511
Cash flow
-8.3%
Cash-on-Cash Return
3.8%
Cap rate
0.6%
Rent to Value Ratio
Active
$305,000
2
bds
|
2
ba
|
1,015
sqft
|
built
1984
8653 S 51st St, Phoenix, AZ 85044
$-703
Cash flow
-12.0%
Cash-on-Cash Return
2.9%
Cap rate
0.6%
Rent to Value Ratio
Active
$249,900
3
bds
|
3
ba
|
1,184
sqft
|
built
1985
19601 N 7th St, Phoenix, AZ 85024
$-291
Cash flow
-6.1%
Cash-on-Cash Return
4.3%
Cap rate
0.7%
Rent to Value Ratio
Active
$219,000
2
bds
|
1
ba
|
924
sqft
|
built
1980
8125 N 32nd Dr, Phoenix, AZ 85051
$-426
Cash flow
-10.1%
Cash-on-Cash Return
3.3%
Cap rate
0.6%
Rent to Value Ratio
Active
$334,900
3
bds
|
3
ba
|
1,408
sqft
|
built
1966
1301 N 44th St, Phoenix, AZ 85008
$-692
Cash flow
-10.8%
Cash-on-Cash Return
3.2%
Cap rate
0.5%
Rent to Value Ratio

Active
$245,000
2
bds
|
2
ba
|
1,108
sqft
|
built
1985
15801 N 29th St, Phoenix, AZ 85032
$-358
Cash flow
-7.6%
Cash-on-Cash Return
3.9%
Cap rate
0.7%
Rent to Value Ratio

Active
$749,900
2
bds
|
2
ba
|
1,407
sqft
|
built
1981
2413 E Rancho Dr, Phoenix, AZ 85016
$-2,438
Cash flow
-17.0%
Cash-on-Cash Return
1.8%
Cap rate
0.4%
Rent to Value Ratio

Active
$385,000
2
bds
|
2
ba
|
1,078
sqft
|
built
1997
1411 E Orangewood Ave, Phoenix, AZ 85020
$-868
Cash flow
-11.8%
Cash-on-Cash Return
3.0%
Cap rate
0.5%
Rent to Value Ratio

Active
$268,995
3
bds
|
2
ba
|
1,298
sqft
|
built
1972
2645 W Elm St, Phoenix, AZ 85017
$-380
Cash flow
-7.4%
Cash-on-Cash Return
4.0%
Cap rate
0.7%
Rent to Value Ratio
Active
$275,000
2
bds
|
2
ba
|
790
sqft
|
built
2003
1701 E Colter St, Phoenix, AZ 85016
$-386
Cash flow
-7.3%
Cash-on-Cash Return
4.0%
Cap rate
0.7%
Rent to Value Ratio
Active
$385,000
2
bds
|
2
ba
|
1,209
sqft
|
built
2005
2250 E Deer Valley Rd, Phoenix, AZ 85024
$-759
Cash flow
-10.3%
Cash-on-Cash Return
3.3%
Cap rate
0.5%
Rent to Value Ratio
Active
$300,000
2
bds
|
3
ba
|
1,440
sqft
|
built
2005
18250 N Cave Creek Rd, Phoenix, AZ 85032
$-534
Cash flow
-9.3%
Cash-on-Cash Return
3.5%
Cap rate
0.6%
Rent to Value Ratio
Active
$359,000
1
bds
|
2
ba
|
856
sqft
|
built
1979
5203 N 24th St, Phoenix, AZ 85016
$-1,153
Cash flow
-16.8%
Cash-on-Cash Return
1.8%
Cap rate
0.4%
Rent to Value Ratio
Active
$535,000
2
bds
|
3
ba
|
1,374
sqft
|
built
1986
4225 N 21st St, Phoenix, AZ 85016
$-1,137
Cash flow
-11.1%
Cash-on-Cash Return
3.1%
Cap rate
0.5%
Rent to Value Ratio
Active
$304,900
2
bds
|
2
ba
|
1,209
sqft
|
built
2005
2150 E Bell Rd, Phoenix, AZ 85022
$259
Cash flow
4.4%
Cash-on-Cash Return
6.7%
Cap rate
0.9%
Rent to Value Ratio
Active
$509,999
2
bds
|
3
ba
|
1,490
sqft
|
built
2006
3935 E Rough Rider Rd, Phoenix, AZ 85050
$-930
Cash flow
-9.5%
Cash-on-Cash Return
3.5%
Cap rate
0.6%
Rent to Value Ratio
Active
$379,000
2
bds
|
2
ba
|
1,371
sqft
|
built
1970
1726 W Claremont St, Phoenix, AZ 85015
$-844
Cash flow
-11.6%
Cash-on-Cash Return
3.0%
Cap rate
0.5%
Rent to Value Ratio

Active
$365,000
3
bds
|
3
ba
|
1,308
sqft
|
built
1974
8414 N Central Ave, Phoenix, AZ 85020
$-817
Cash flow
-11.7%
Cash-on-Cash Return
3.0%
Cap rate
0.5%
Rent to Value Ratio

Active
$130,000
2
bds
|
2
ba
|
980
sqft
|
built
1975
3840 N 43rd Ave, Phoenix, AZ 85031
$-229
Cash flow
-9.2%
Cash-on-Cash Return
3.6%
Cap rate
0.8%
Rent to Value Ratio
Active
$325,000
3
bds
|
3
ba
|
1,767
sqft
|
built
2007
2826 E Tracy Ln, Phoenix, AZ 85032
$-464
Cash flow
-7.4%
Cash-on-Cash Return
4.0%
Cap rate
0.6%
Rent to Value Ratio

Active
$299,999
2
bds
|
2
ba
|
970
sqft
|
built
1985
4818 E Hazel Dr, Phoenix, AZ 85044
$-737
Cash flow
-12.8%
Cash-on-Cash Return
2.7%
Cap rate
0.6%
Rent to Value Ratio
Active
$450,000
2
bds
|
2
ba
|
1,376
sqft
|
built
1972
5350 N 3rd Ave, Phoenix, AZ 85013
$-729
Cash flow
-8.5%
Cash-on-Cash Return
3.7%
Cap rate
0.6%
Rent to Value Ratio
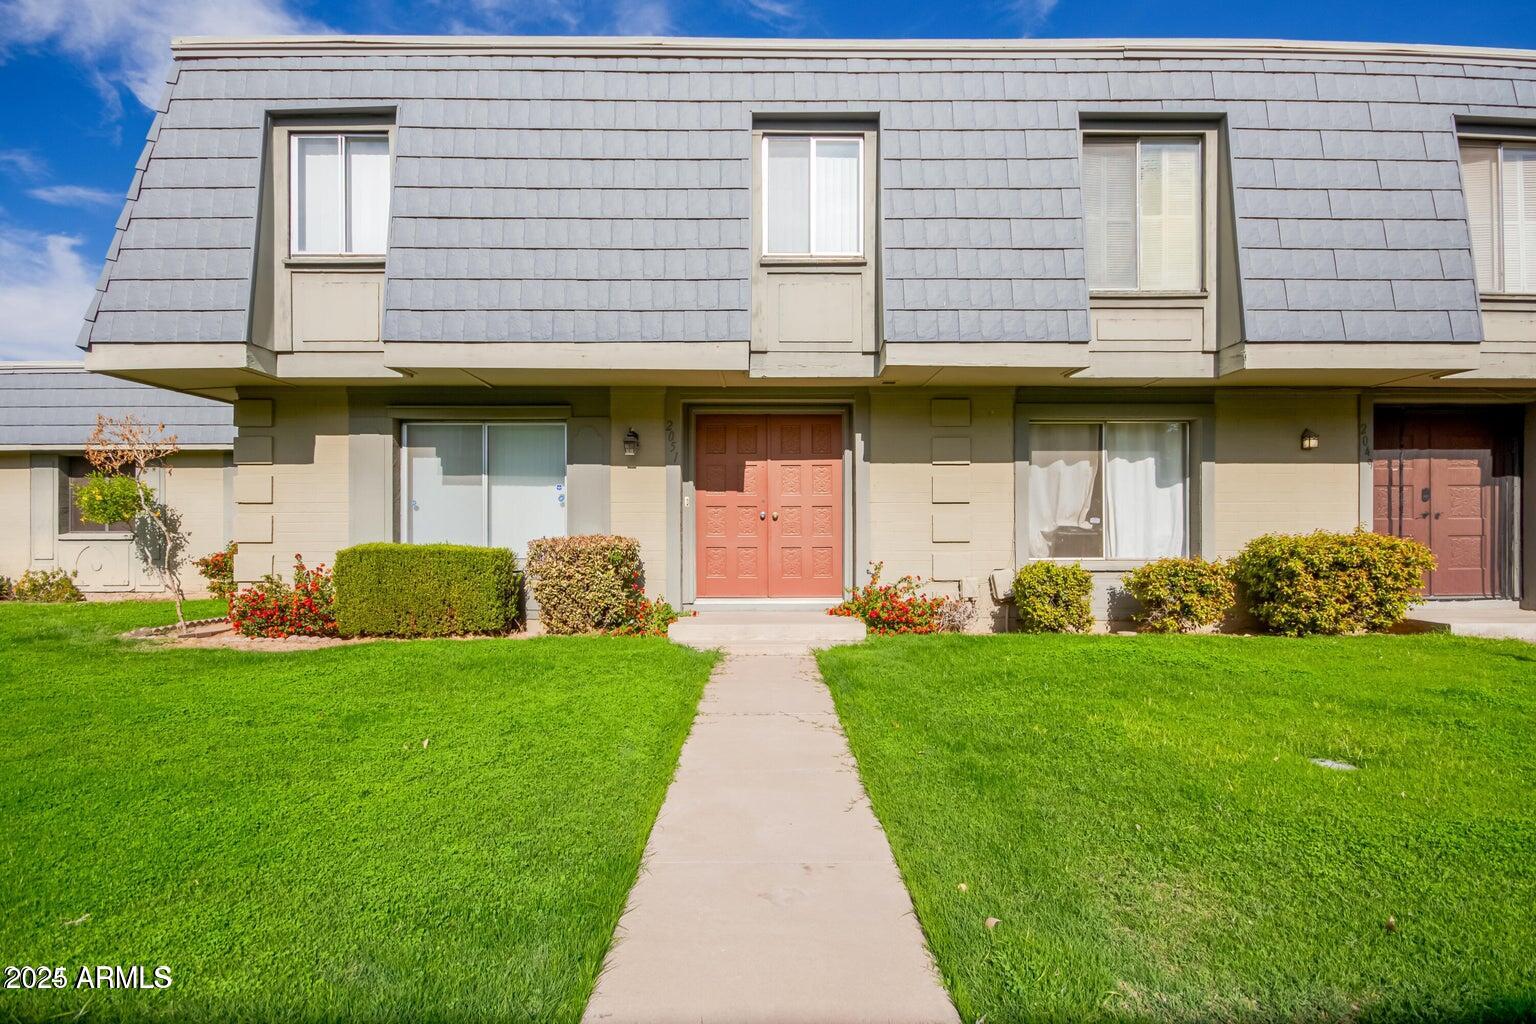
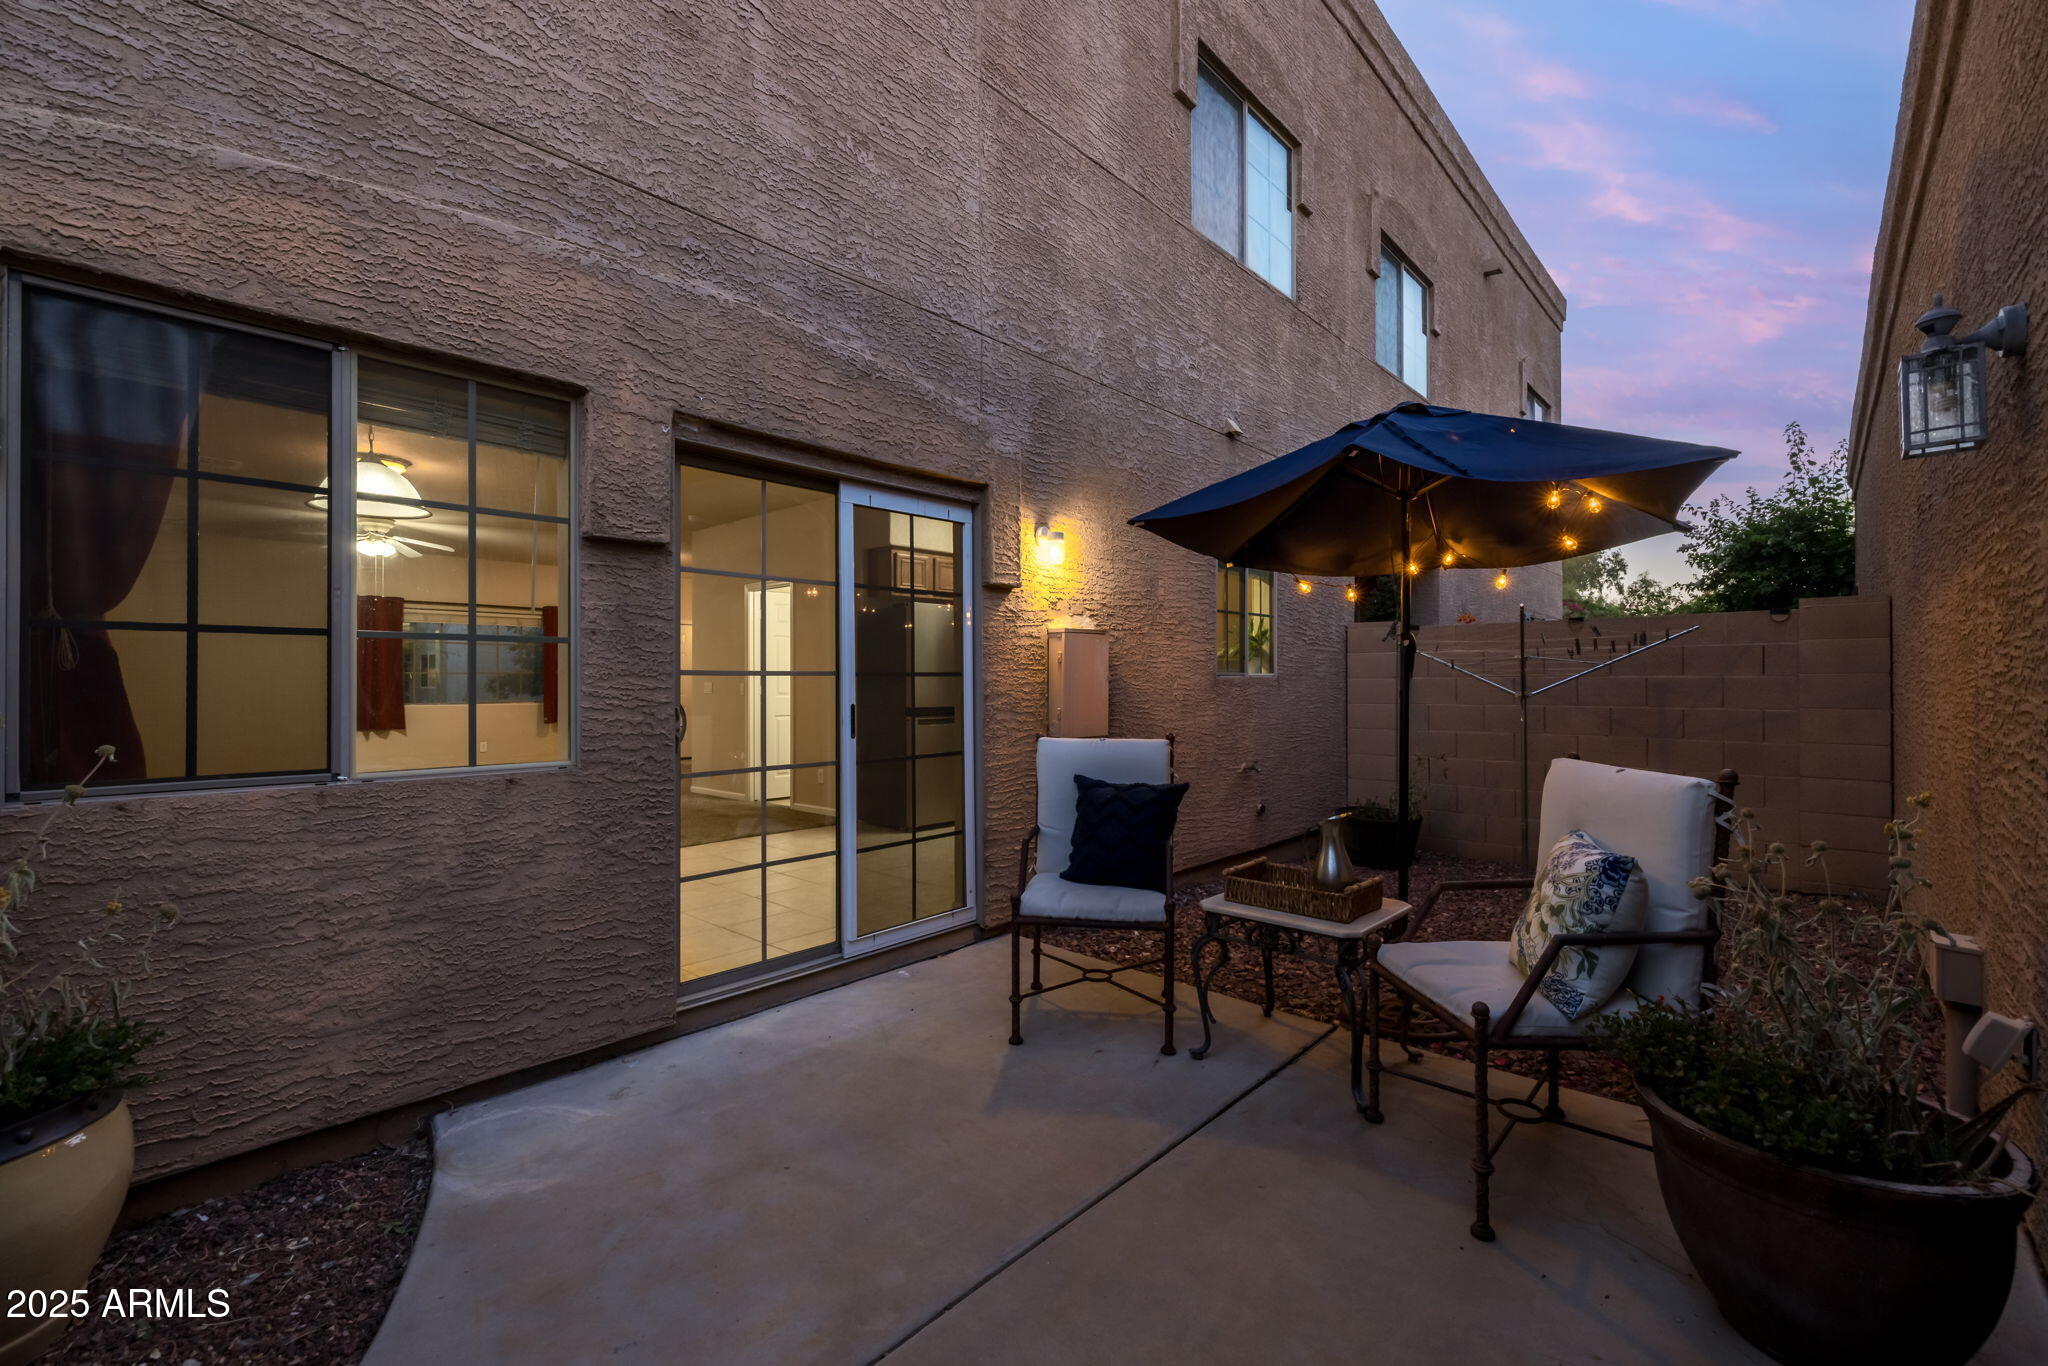
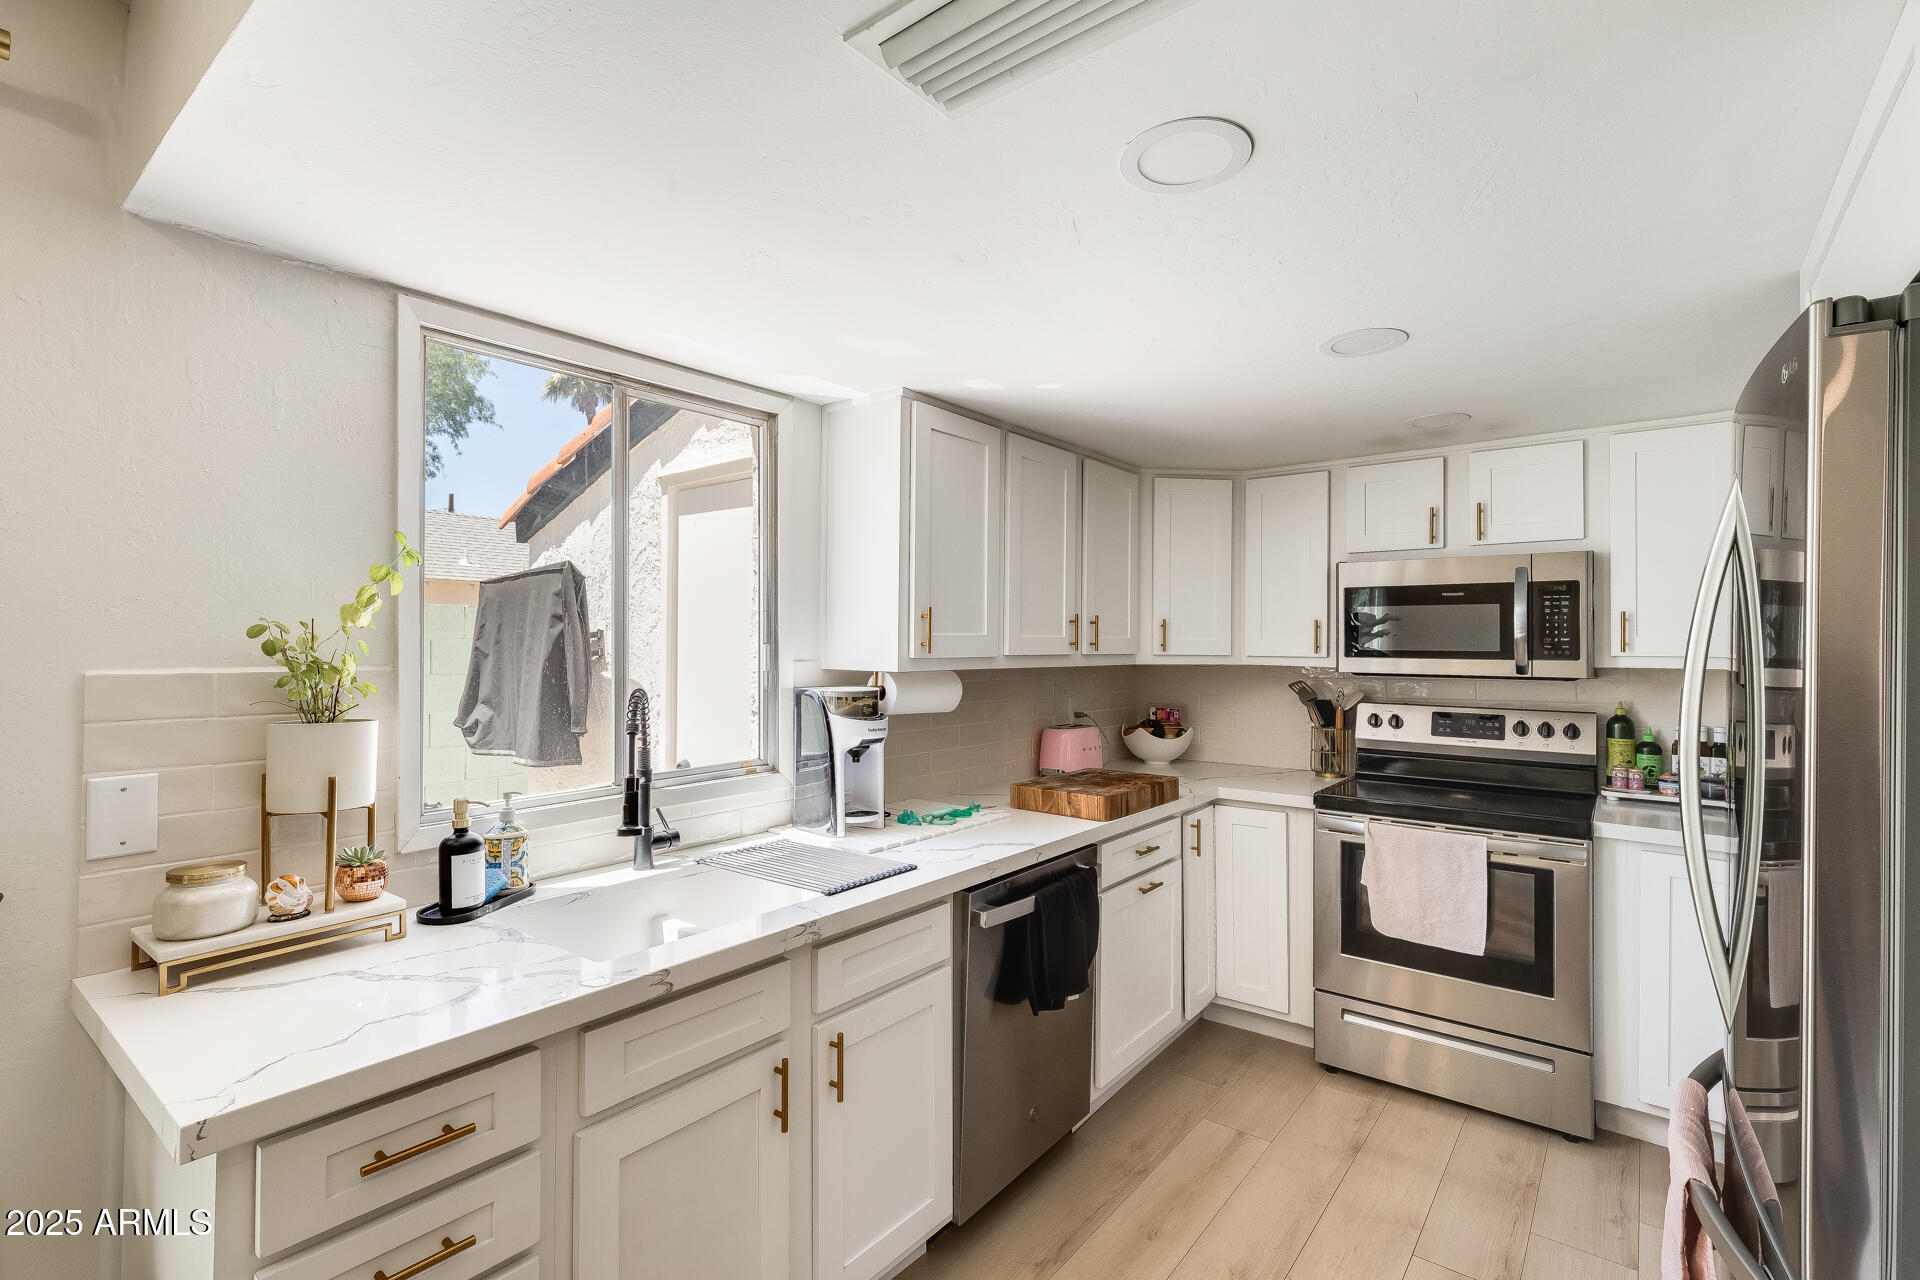
Active
$290,000
4
bds
|
3
ba
|
1,704
sqft
|
built
1970
2051 W Elm St, Phoenix, AZ 85015
$-325
Cash flow
-5.8%
Cash-on-Cash Return
4.3%
Cap rate
0.7%
Rent to Value Ratio

Active
$734,999
3
bds
|
4
ba
|
2,170
sqft
|
built
2020
340 E Osborn Rd, Phoenix, AZ 85012
$-850
Cash flow
-6.0%
Cash-on-Cash Return
4.3%
Cap rate
0.6%
Rent to Value Ratio
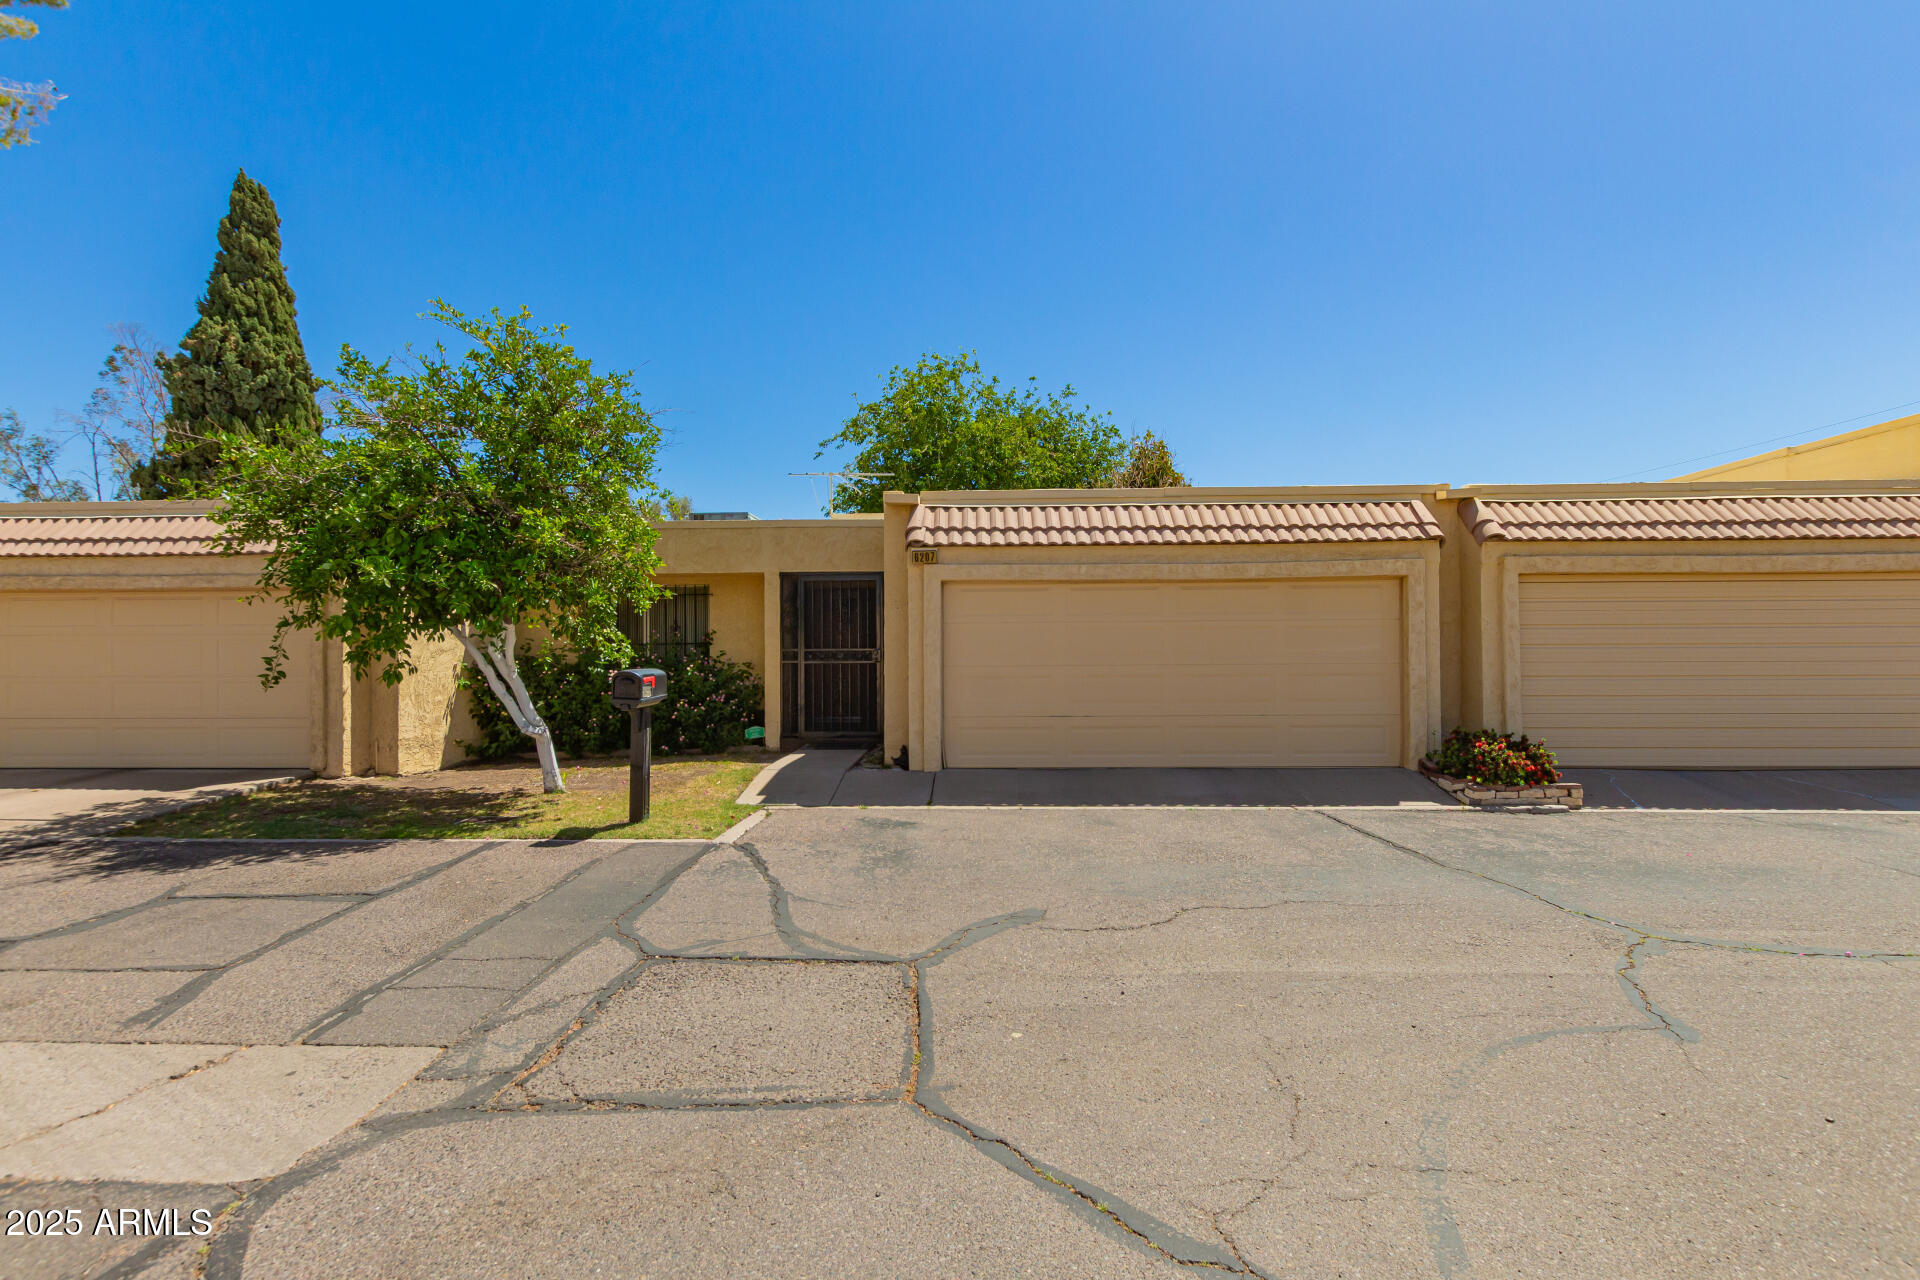
Active
$325,000
2
bds
|
2
ba
|
1,251
sqft
|
built
1974
6207 N 21st Dr, Phoenix, AZ 85015
$-675
Cash flow
-10.8%
Cash-on-Cash Return
3.2%
Cap rate
0.6%
Rent to Value Ratio

Active
$409,500
3
bds
|
3
ba
|
1,496
sqft
|
built
1966
3820 N 30th St, Phoenix, AZ 85016
$-618
Cash flow
-7.9%
Cash-on-Cash Return
3.9%
Cap rate
0.6%
Rent to Value Ratio
Active
$209,900
2
bds
|
2
ba
|
966
sqft
|
built
1973
4240 N 67th Ln, Phoenix, AZ 85033
$-204
Cash flow
-5.1%
Cash-on-Cash Return
4.5%
Cap rate
0.8%
Rent to Value Ratio
Active
$344,000
2
bds
|
2
ba
|
1,015
sqft
|
built
1979
1826 E Frier Dr, Phoenix, AZ 85020
$-877
Cash flow
-13.3%
Cash-on-Cash Return
2.6%
Cap rate
0.6%
Rent to Value Ratio
Active
$460,000
2
bds
|
2
ba
|
1,204
sqft
|
built
2003
706 E Washington St, Phoenix, AZ 85034
$-655
Cash flow
-7.4%
Cash-on-Cash Return
4.0%
Cap rate
0.6%
Rent to Value Ratio

Active
$569,950
3
bds
|
3
ba
|
2,108
sqft
|
built
2022
4344 E Granada Rd, Phoenix, AZ 85008
$-1,093
Cash flow
-10.0%
Cash-on-Cash Return
3.4%
Cap rate
0.5%
Rent to Value Ratio
Active
$290,000
2
bds
|
2
ba
|
1,152
sqft
|
built
1959
102 W Maryland Ave, Phoenix, AZ 85013
$-686
Cash flow
-12.3%
Cash-on-Cash Return
2.8%
Cap rate
0.6%
Rent to Value Ratio
Active
$549,000
3
bds
|
2
ba
|
1,417
sqft
|
built
1980
3154 E Clarendon Ave, Phoenix, AZ 85016
$-1,350
Cash flow
-12.8%
Cash-on-Cash Return
2.7%
Cap rate
0.4%
Rent to Value Ratio

Active
$659,600
2
bds
|
3
ba
|
1,658
sqft
|
built
2016
540 W Mariposa St, Phoenix, AZ 85013
$-975
Cash flow
-7.7%
Cash-on-Cash Return
3.9%
Cap rate
0.6%
Rent to Value Ratio
Active
$449,999
3
bds
|
3
ba
|
1,336
sqft
|
built
2008
2725 E Mine Creek Rd, Phoenix, AZ 85024
$-979
Cash flow
-11.4%
Cash-on-Cash Return
3.1%
Cap rate
0.5%
Rent to Value Ratio
Active
$450,000
2
bds
|
2
ba
|
1,290
sqft
|
built
1964
3650 E Montecito Ave, Phoenix, AZ 85018
$-1,155
Cash flow
-13.4%
Cash-on-Cash Return
2.6%
Cap rate
0.4%
Rent to Value Ratio
Active
$285,000
2
bds
|
2
ba
|
1,500
sqft
|
built
1965
4615 N 22nd St, Phoenix, AZ 85016
$-601
Cash flow
-11.0%
Cash-on-Cash Return
3.1%
Cap rate
0.6%
Rent to Value Ratio
Active
$315,000
3
bds
|
2
ba
|
1,216
sqft
|
built
1973
1622 E Campbell Ave, Phoenix, AZ 85016
$-284
Cash flow
-4.7%
Cash-on-Cash Return
4.6%
Cap rate
0.7%
Rent to Value Ratio
Active
$290,000
2
bds
|
2
ba
|
1,066
sqft
|
built
1973
6540 N 7th Ave, Phoenix, AZ 85013
$-555
Cash flow
-10.0%
Cash-on-Cash Return
3.4%
Cap rate
0.6%
Rent to Value Ratio