Phoenix, AZ Investment Properties for Sale
Browse homes for sale and investment properties in Phoenix, AZ. Refine your search by price, property type, or more.
Best cash flowing properties in Phoenix, AZ
Active
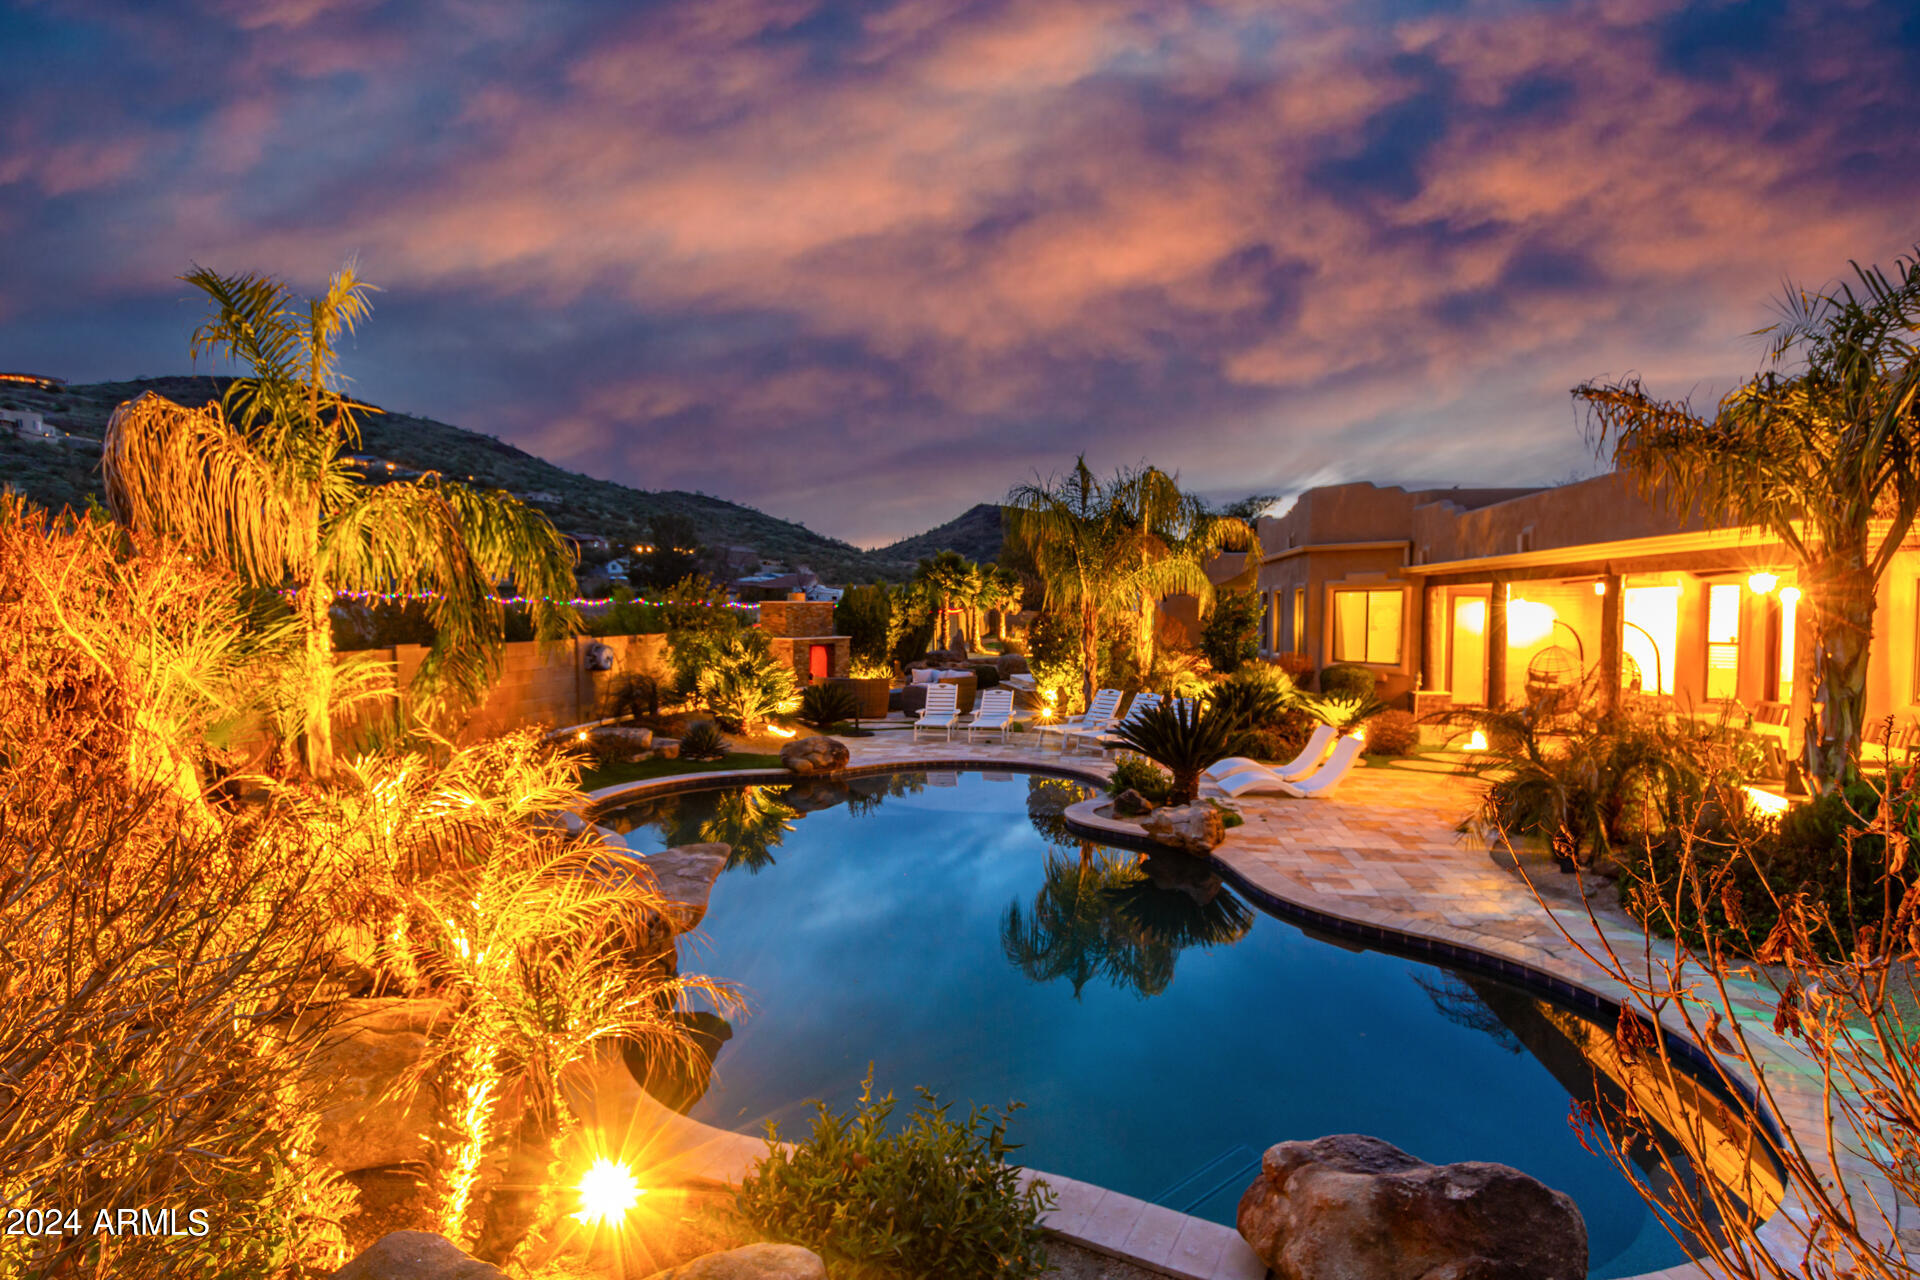
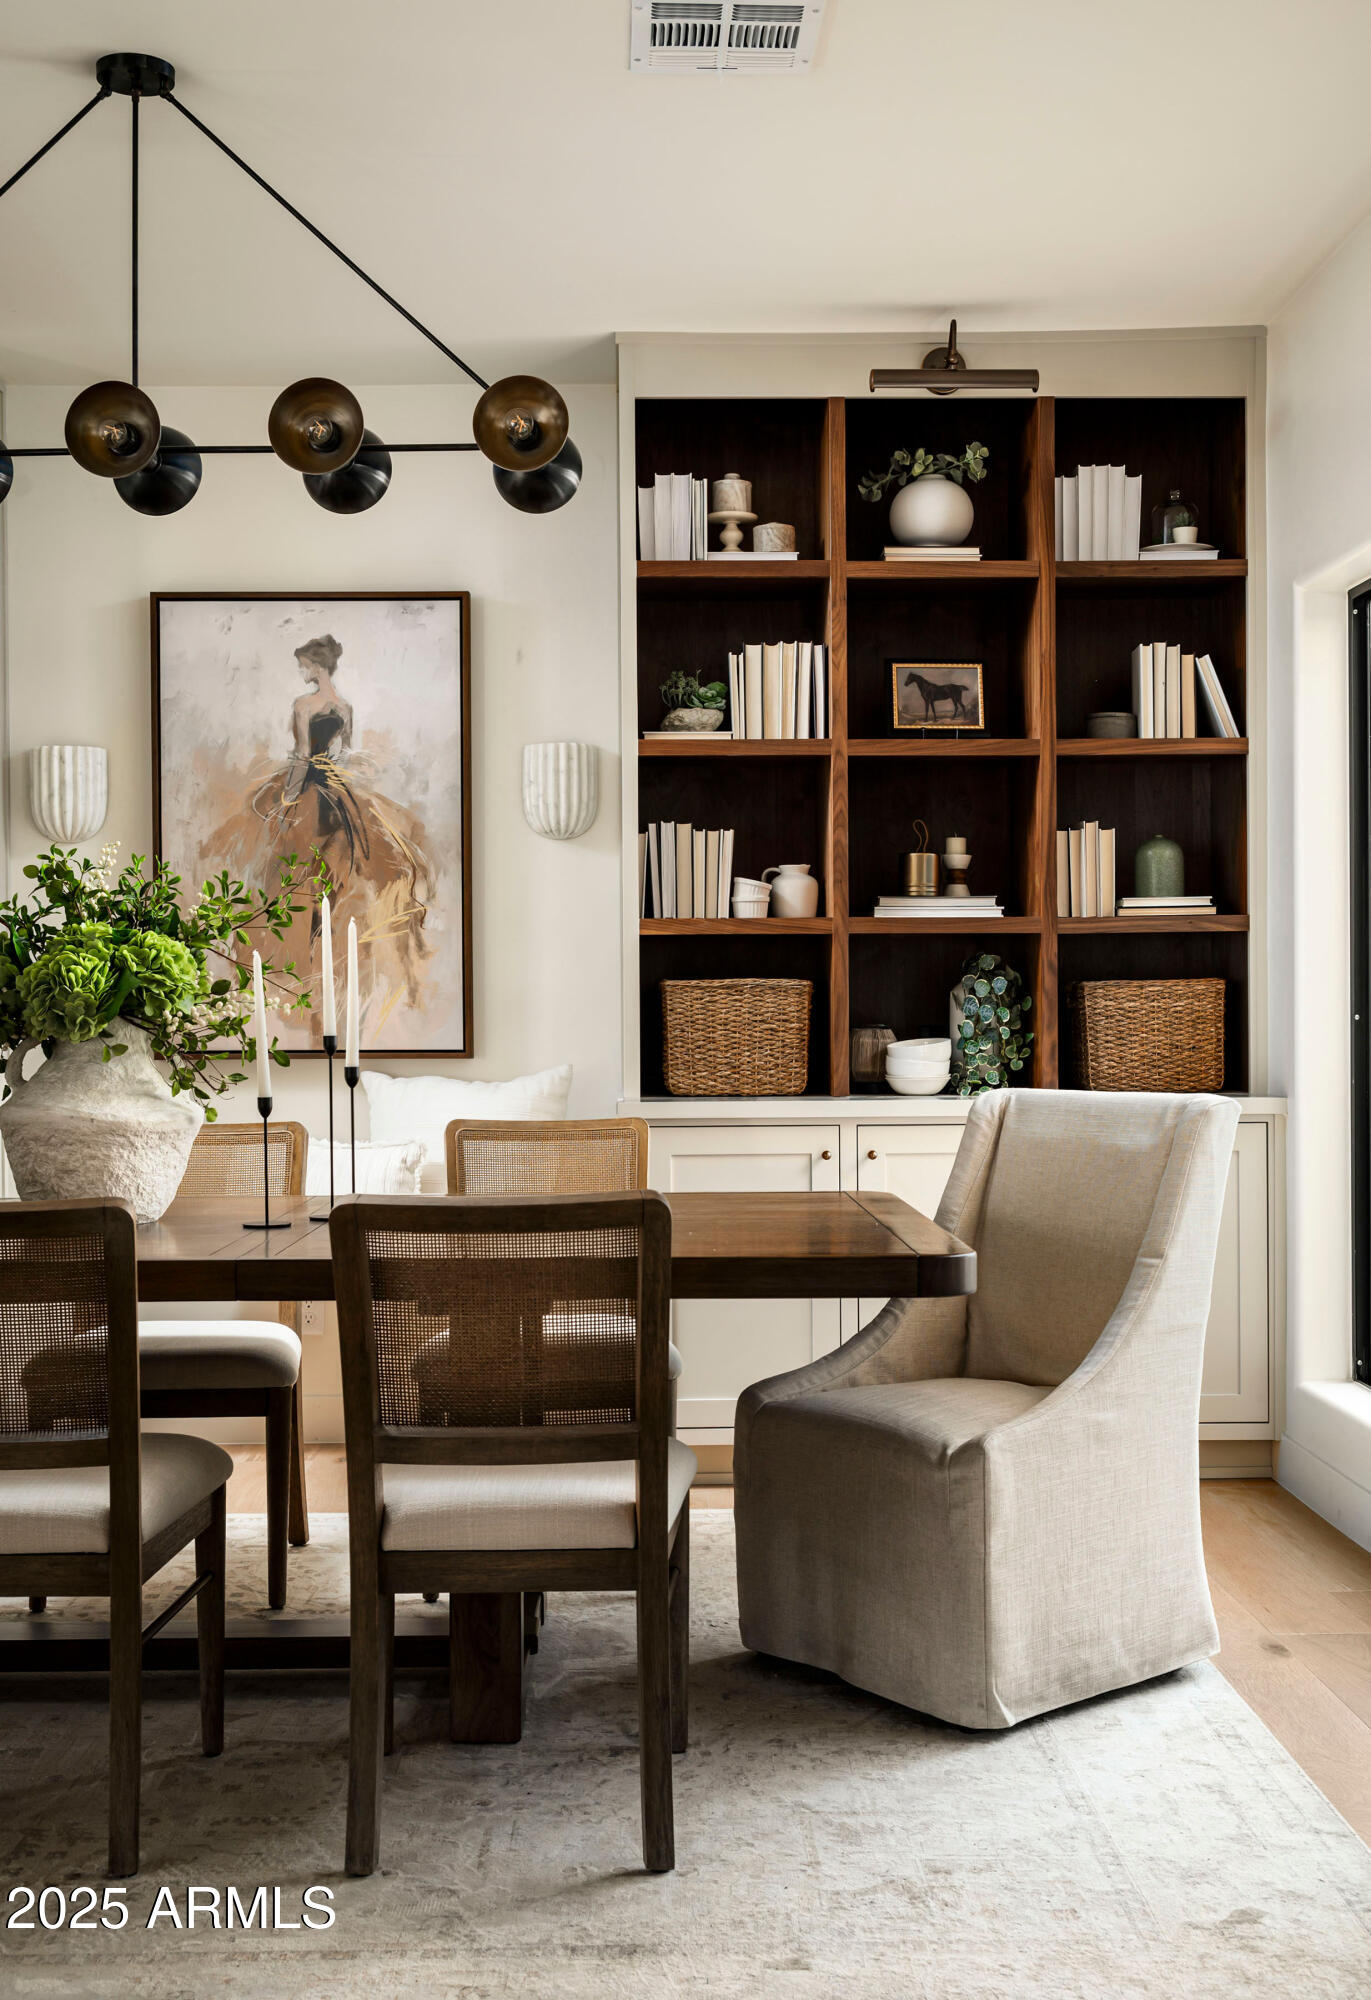
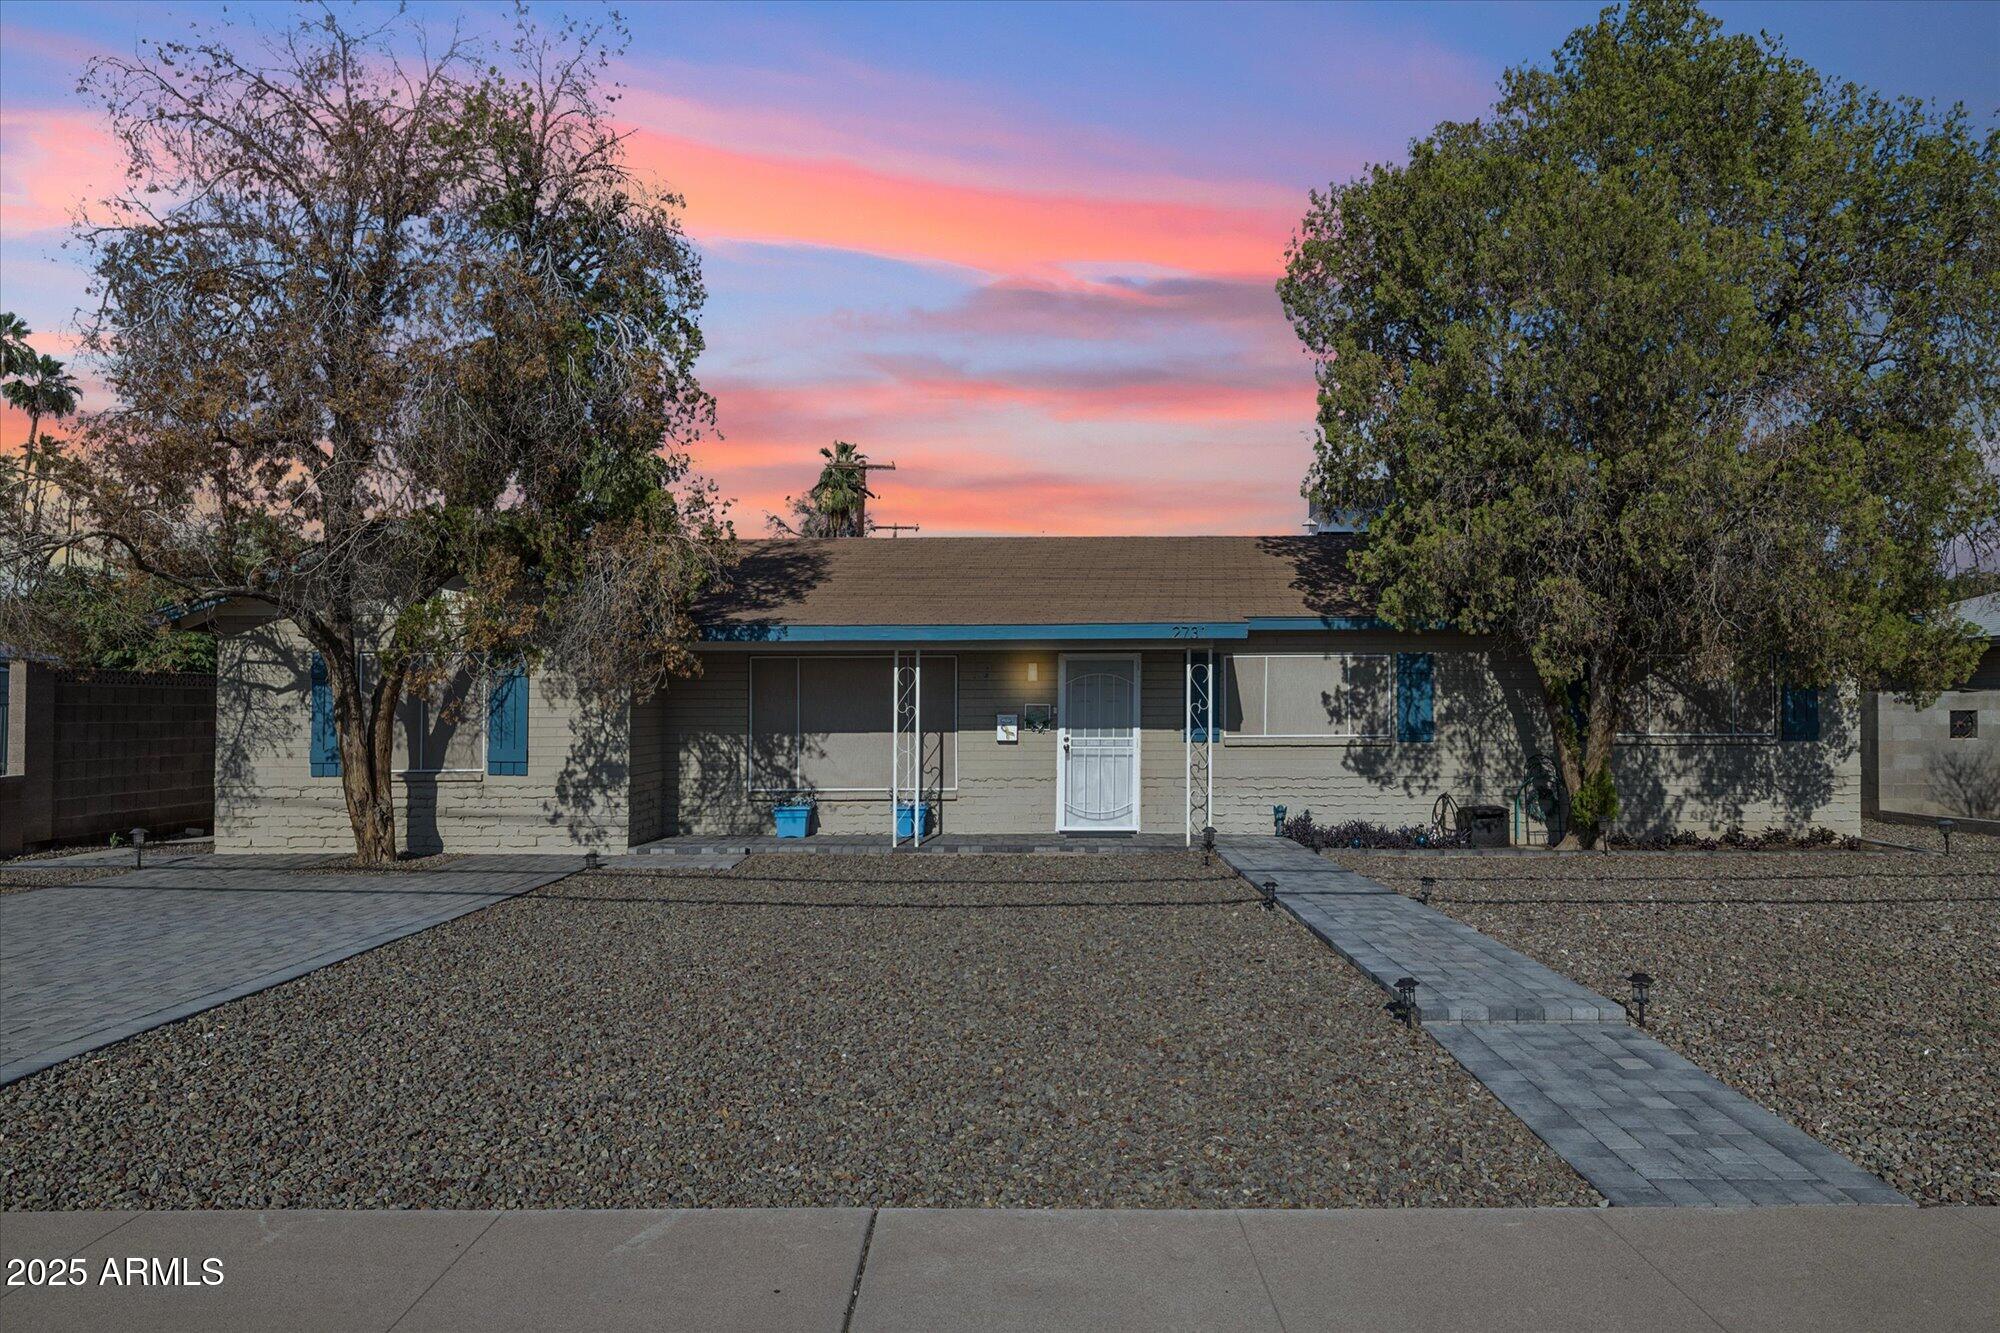
$1,175,000
5
bds
|
4
ba
|
3,068
sqft
|
built
2003
2731 W Desert Ranch Rd, Phoenix, AZ 85086
$1,381
Cash flow
6.1%
Cash-on-Cash Return
7.7%
Cap rate
1.0%
Rent to Value Ratio
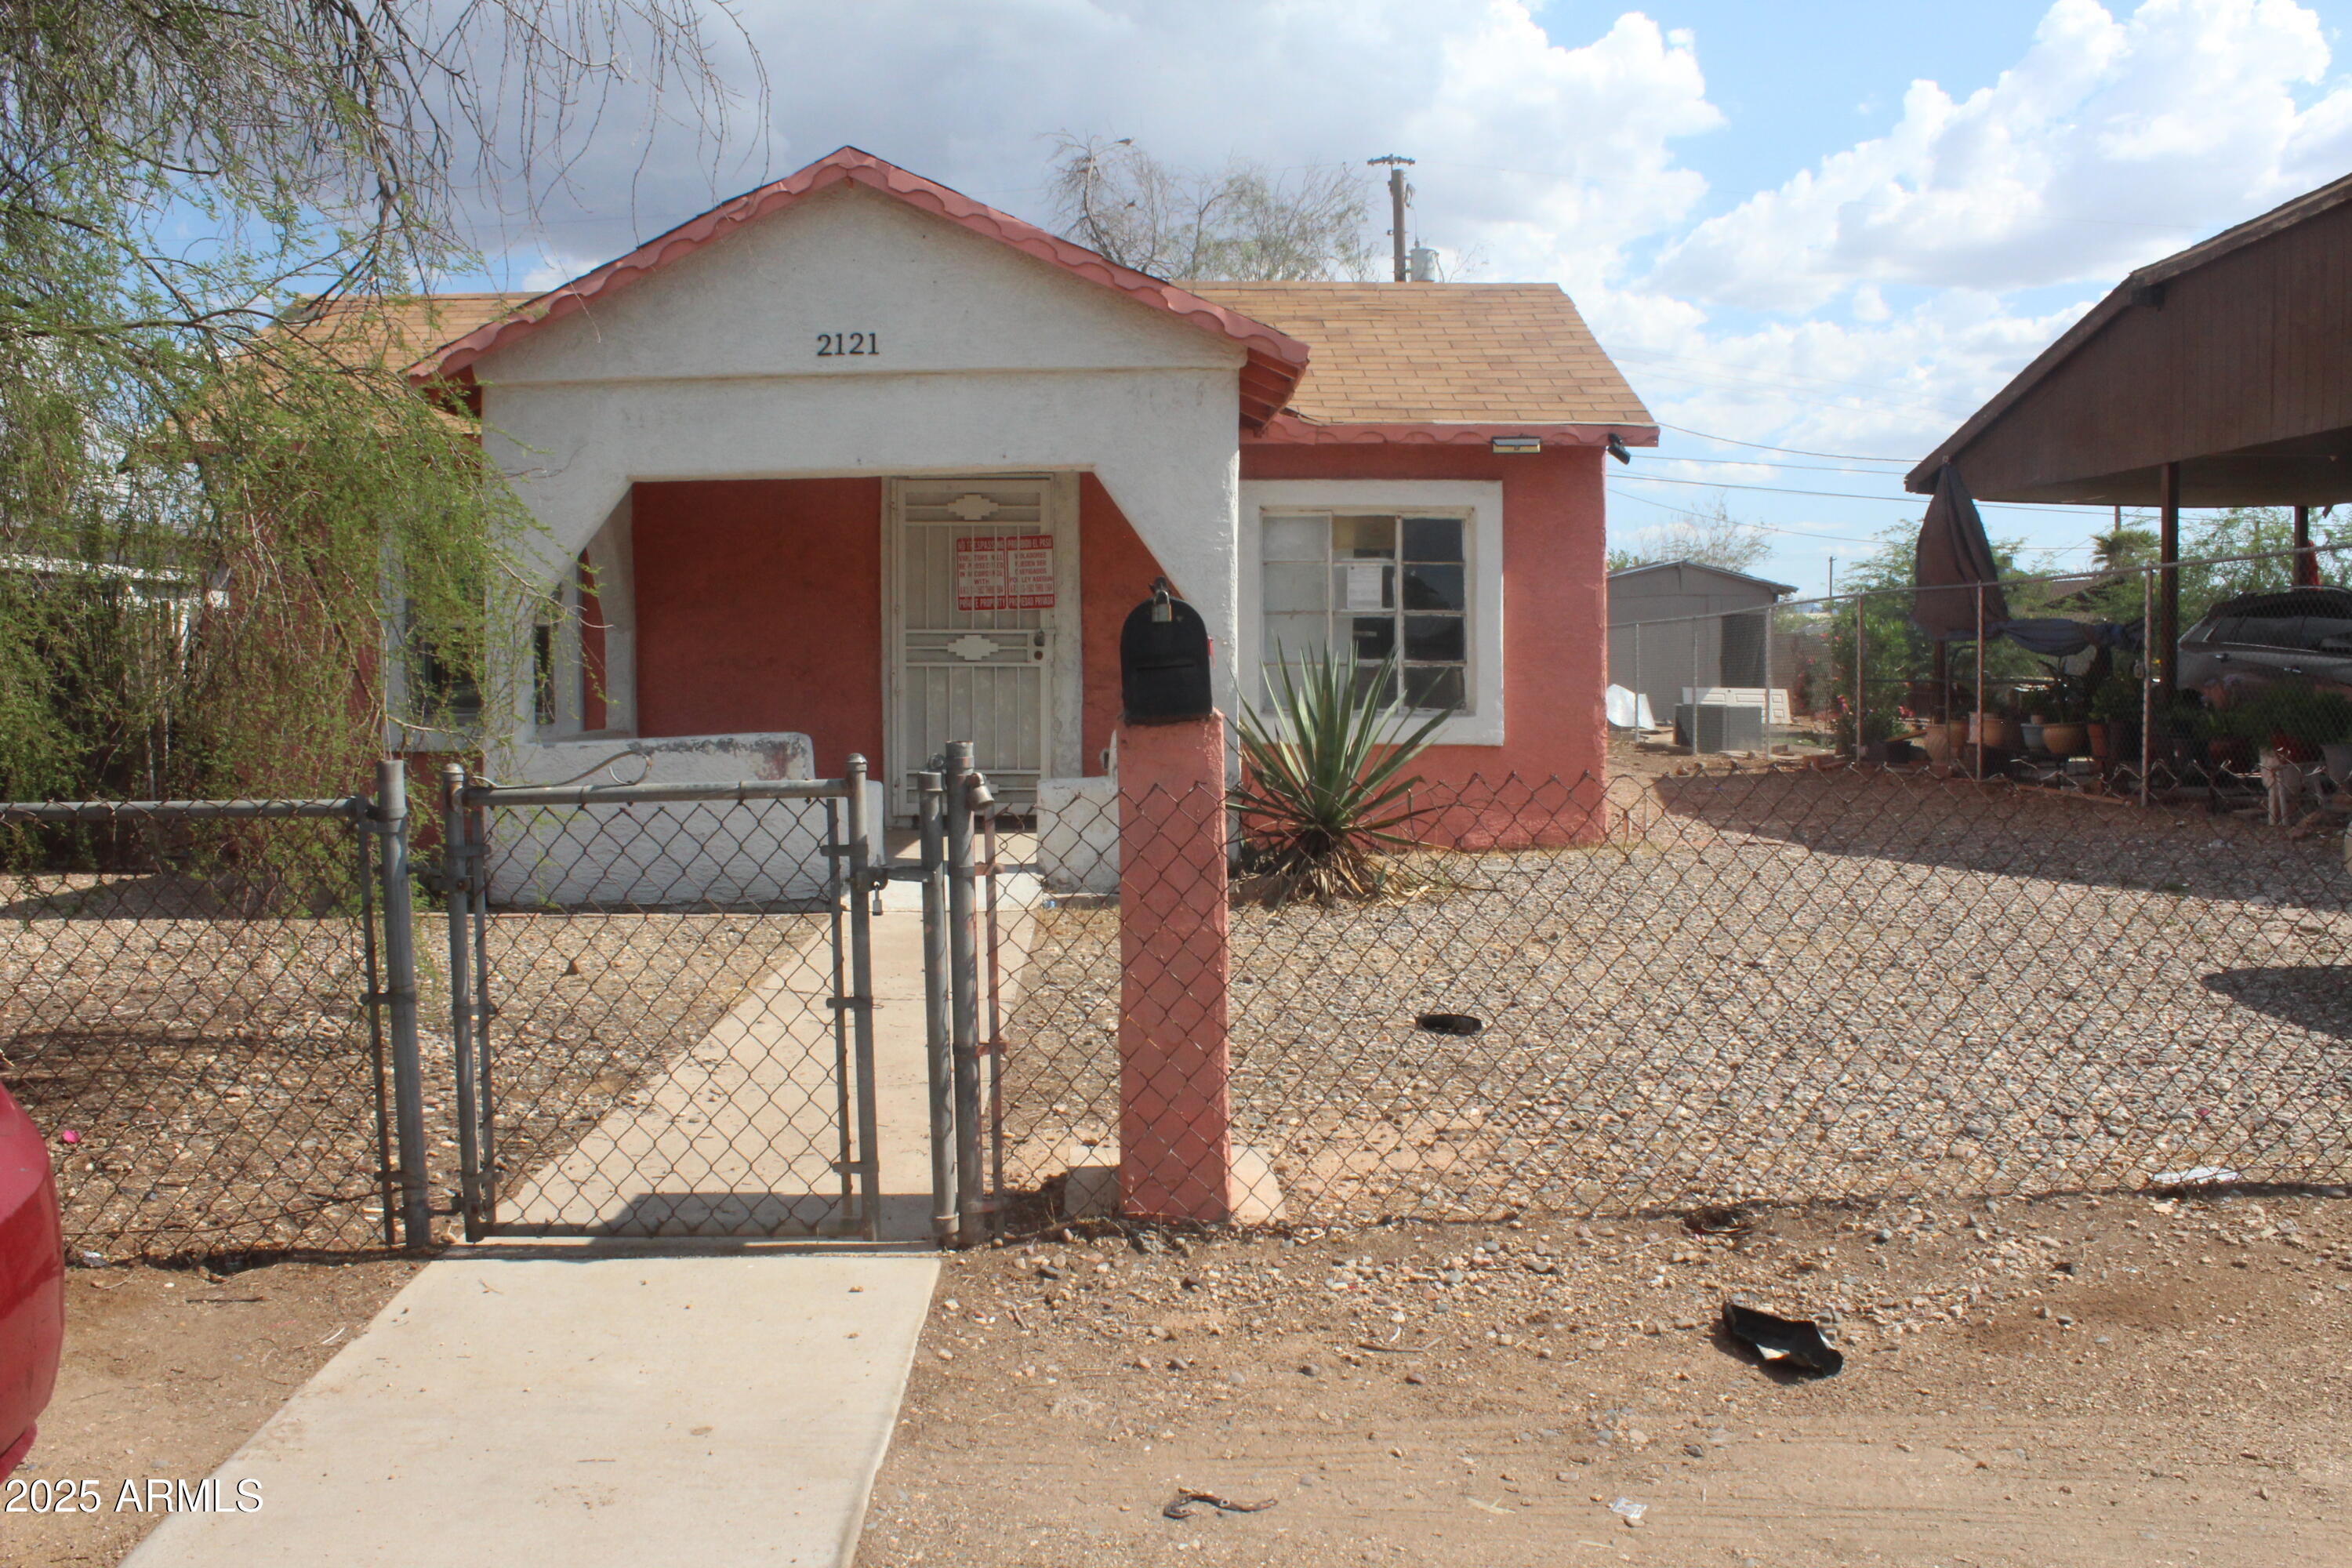
Active
$200,000
2
bds
|
2
ba
|
984
sqft
|
built
1946
2121 W Tonto St, Phoenix, AZ 85009
$-260
Cash flow
-6.8%
Cash-on-Cash Return
4.7%
Cap rate
0.6%
Rent to Value Ratio
3,571 out of 3,846 properties for sale in Phoenix, AZ
Limited Results Shown
Create a free account, or log in to reveal all property listings and enjoy the complete experience.
Active
$200,000
2
bds
|
2
ba
|
984
sqft
|
built
1946
2121 W Tonto St, Phoenix, AZ 85009
$-260
Cash flow
-6.8%
Cash-on-Cash Return
4.7%
Cap rate
0.6%
Rent to Value Ratio
Active
$499,000
2
bds
|
2
ba
|
1,343
sqft
|
built
2008
5450 E Deer Valley Dr, Phoenix, AZ 85054
$-1,435
Cash flow
-15.0%
Cash-on-Cash Return
2.8%
Cap rate
0.6%
Rent to Value Ratio
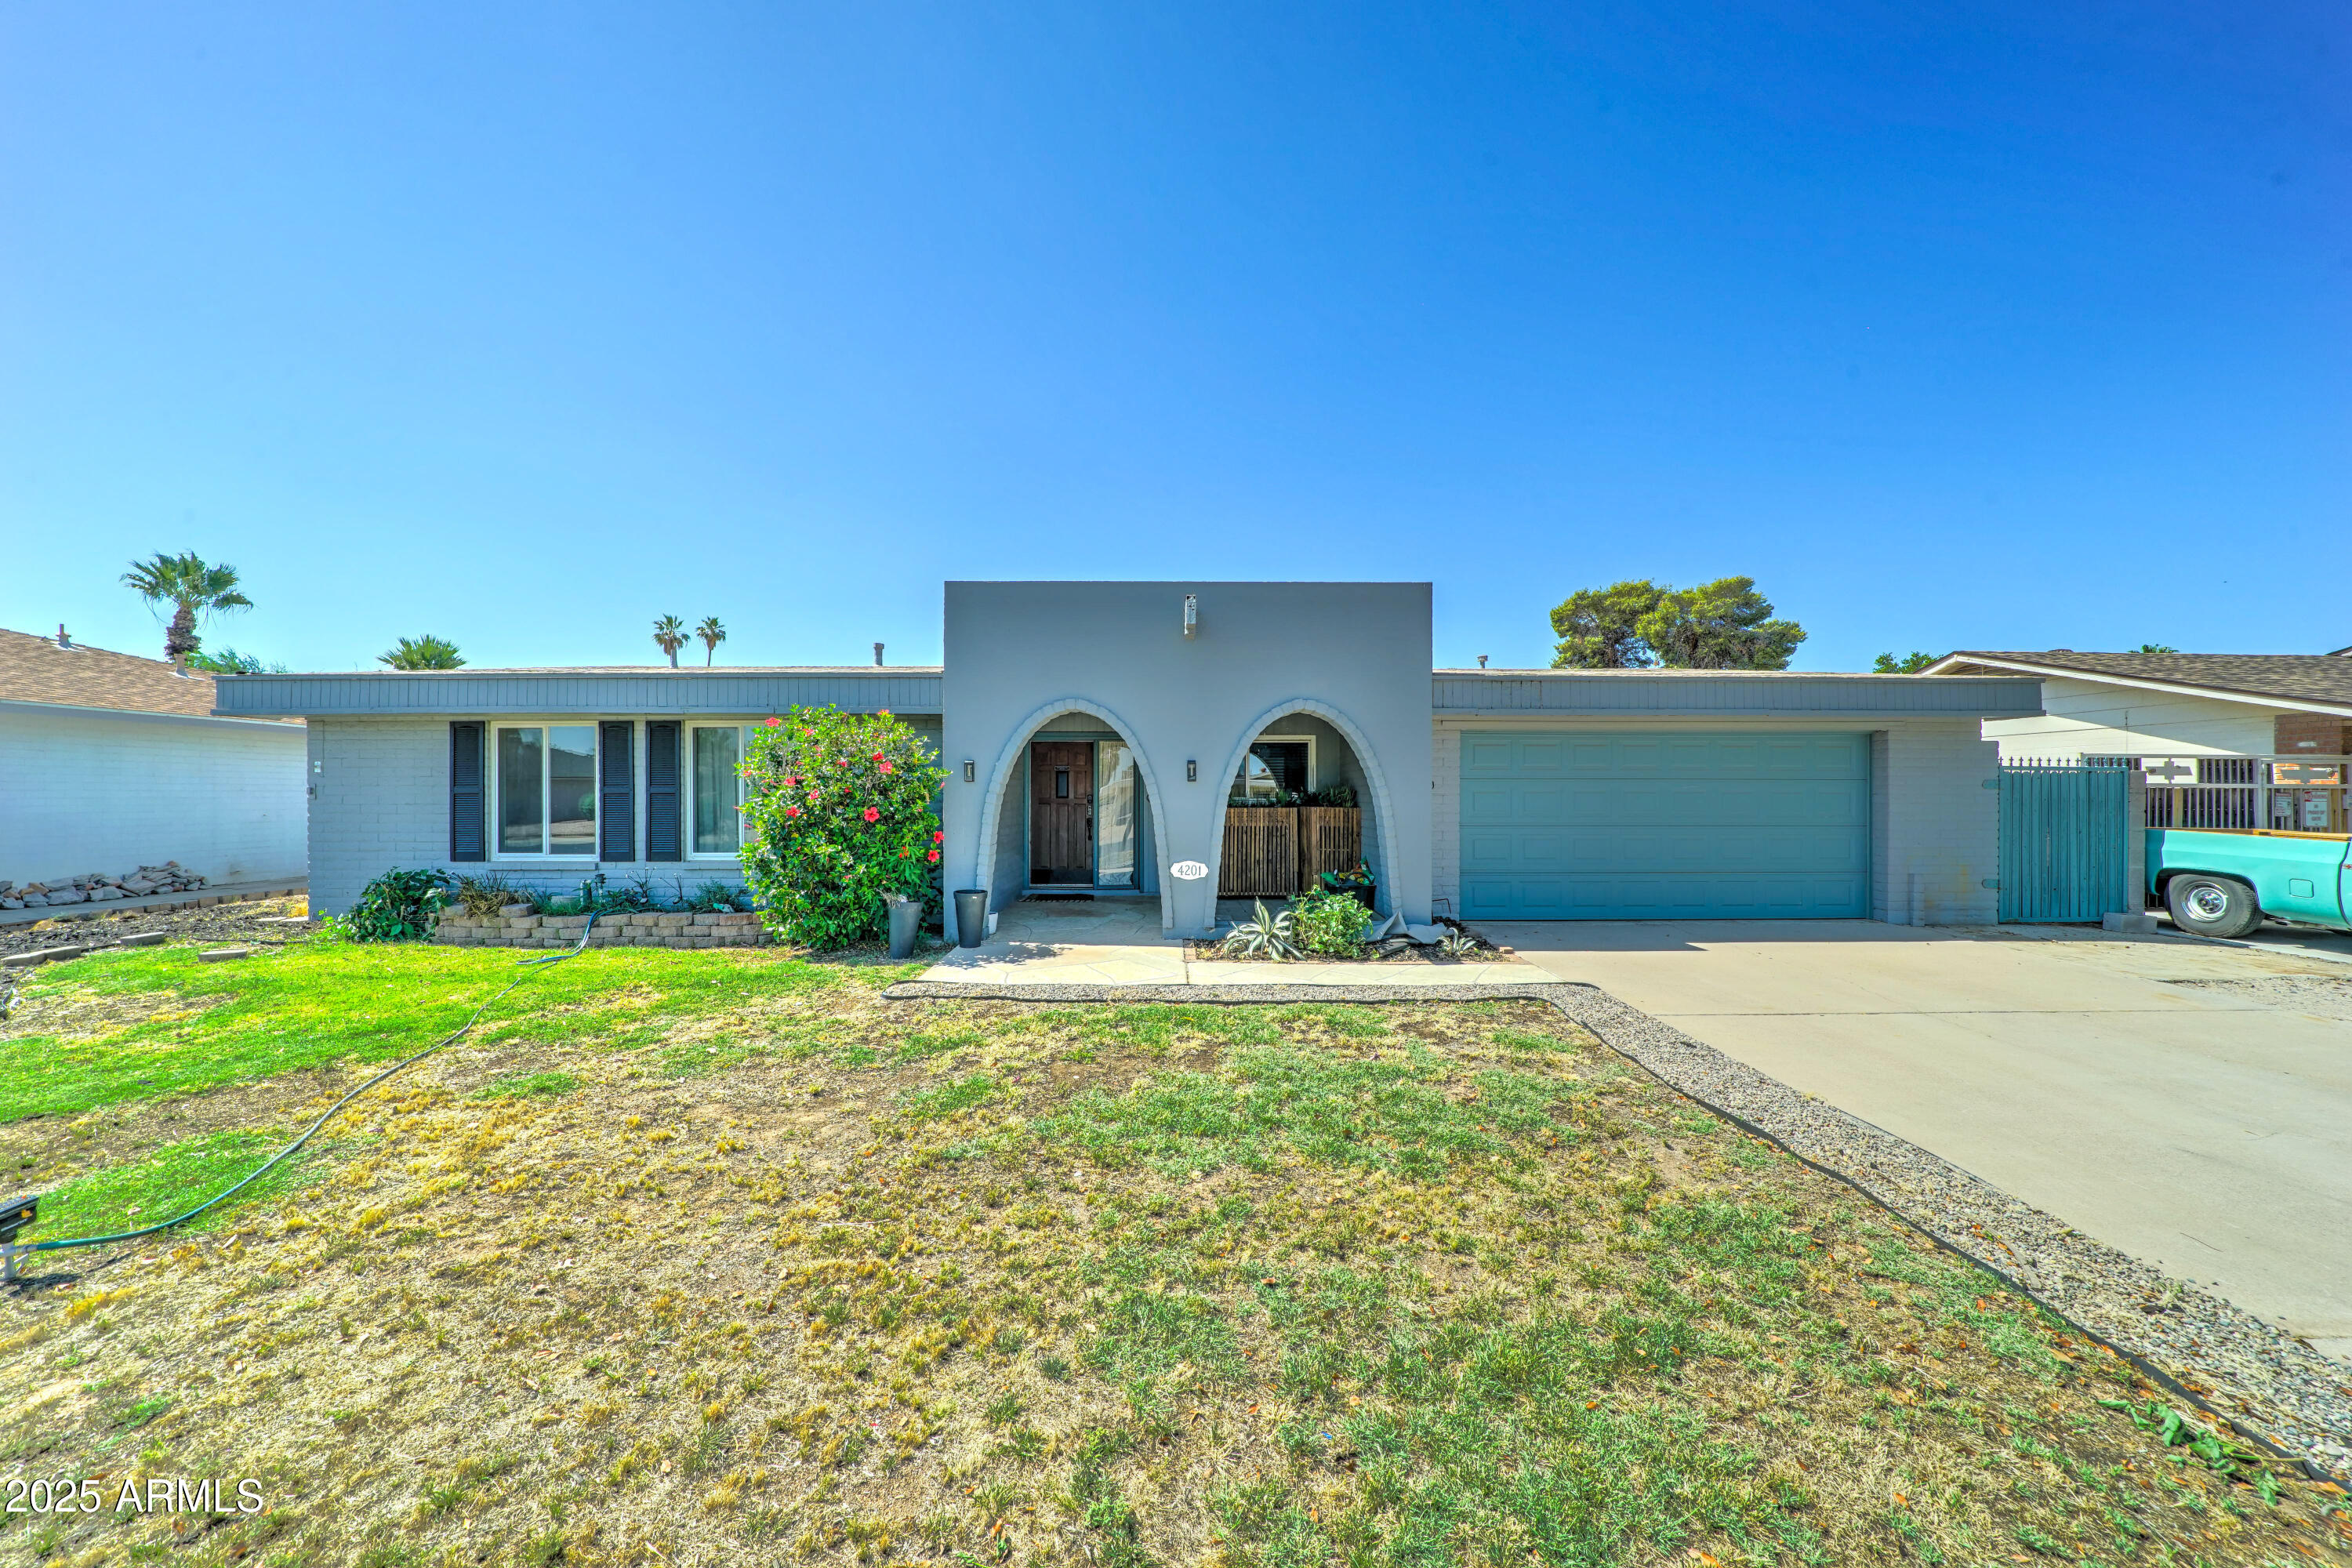
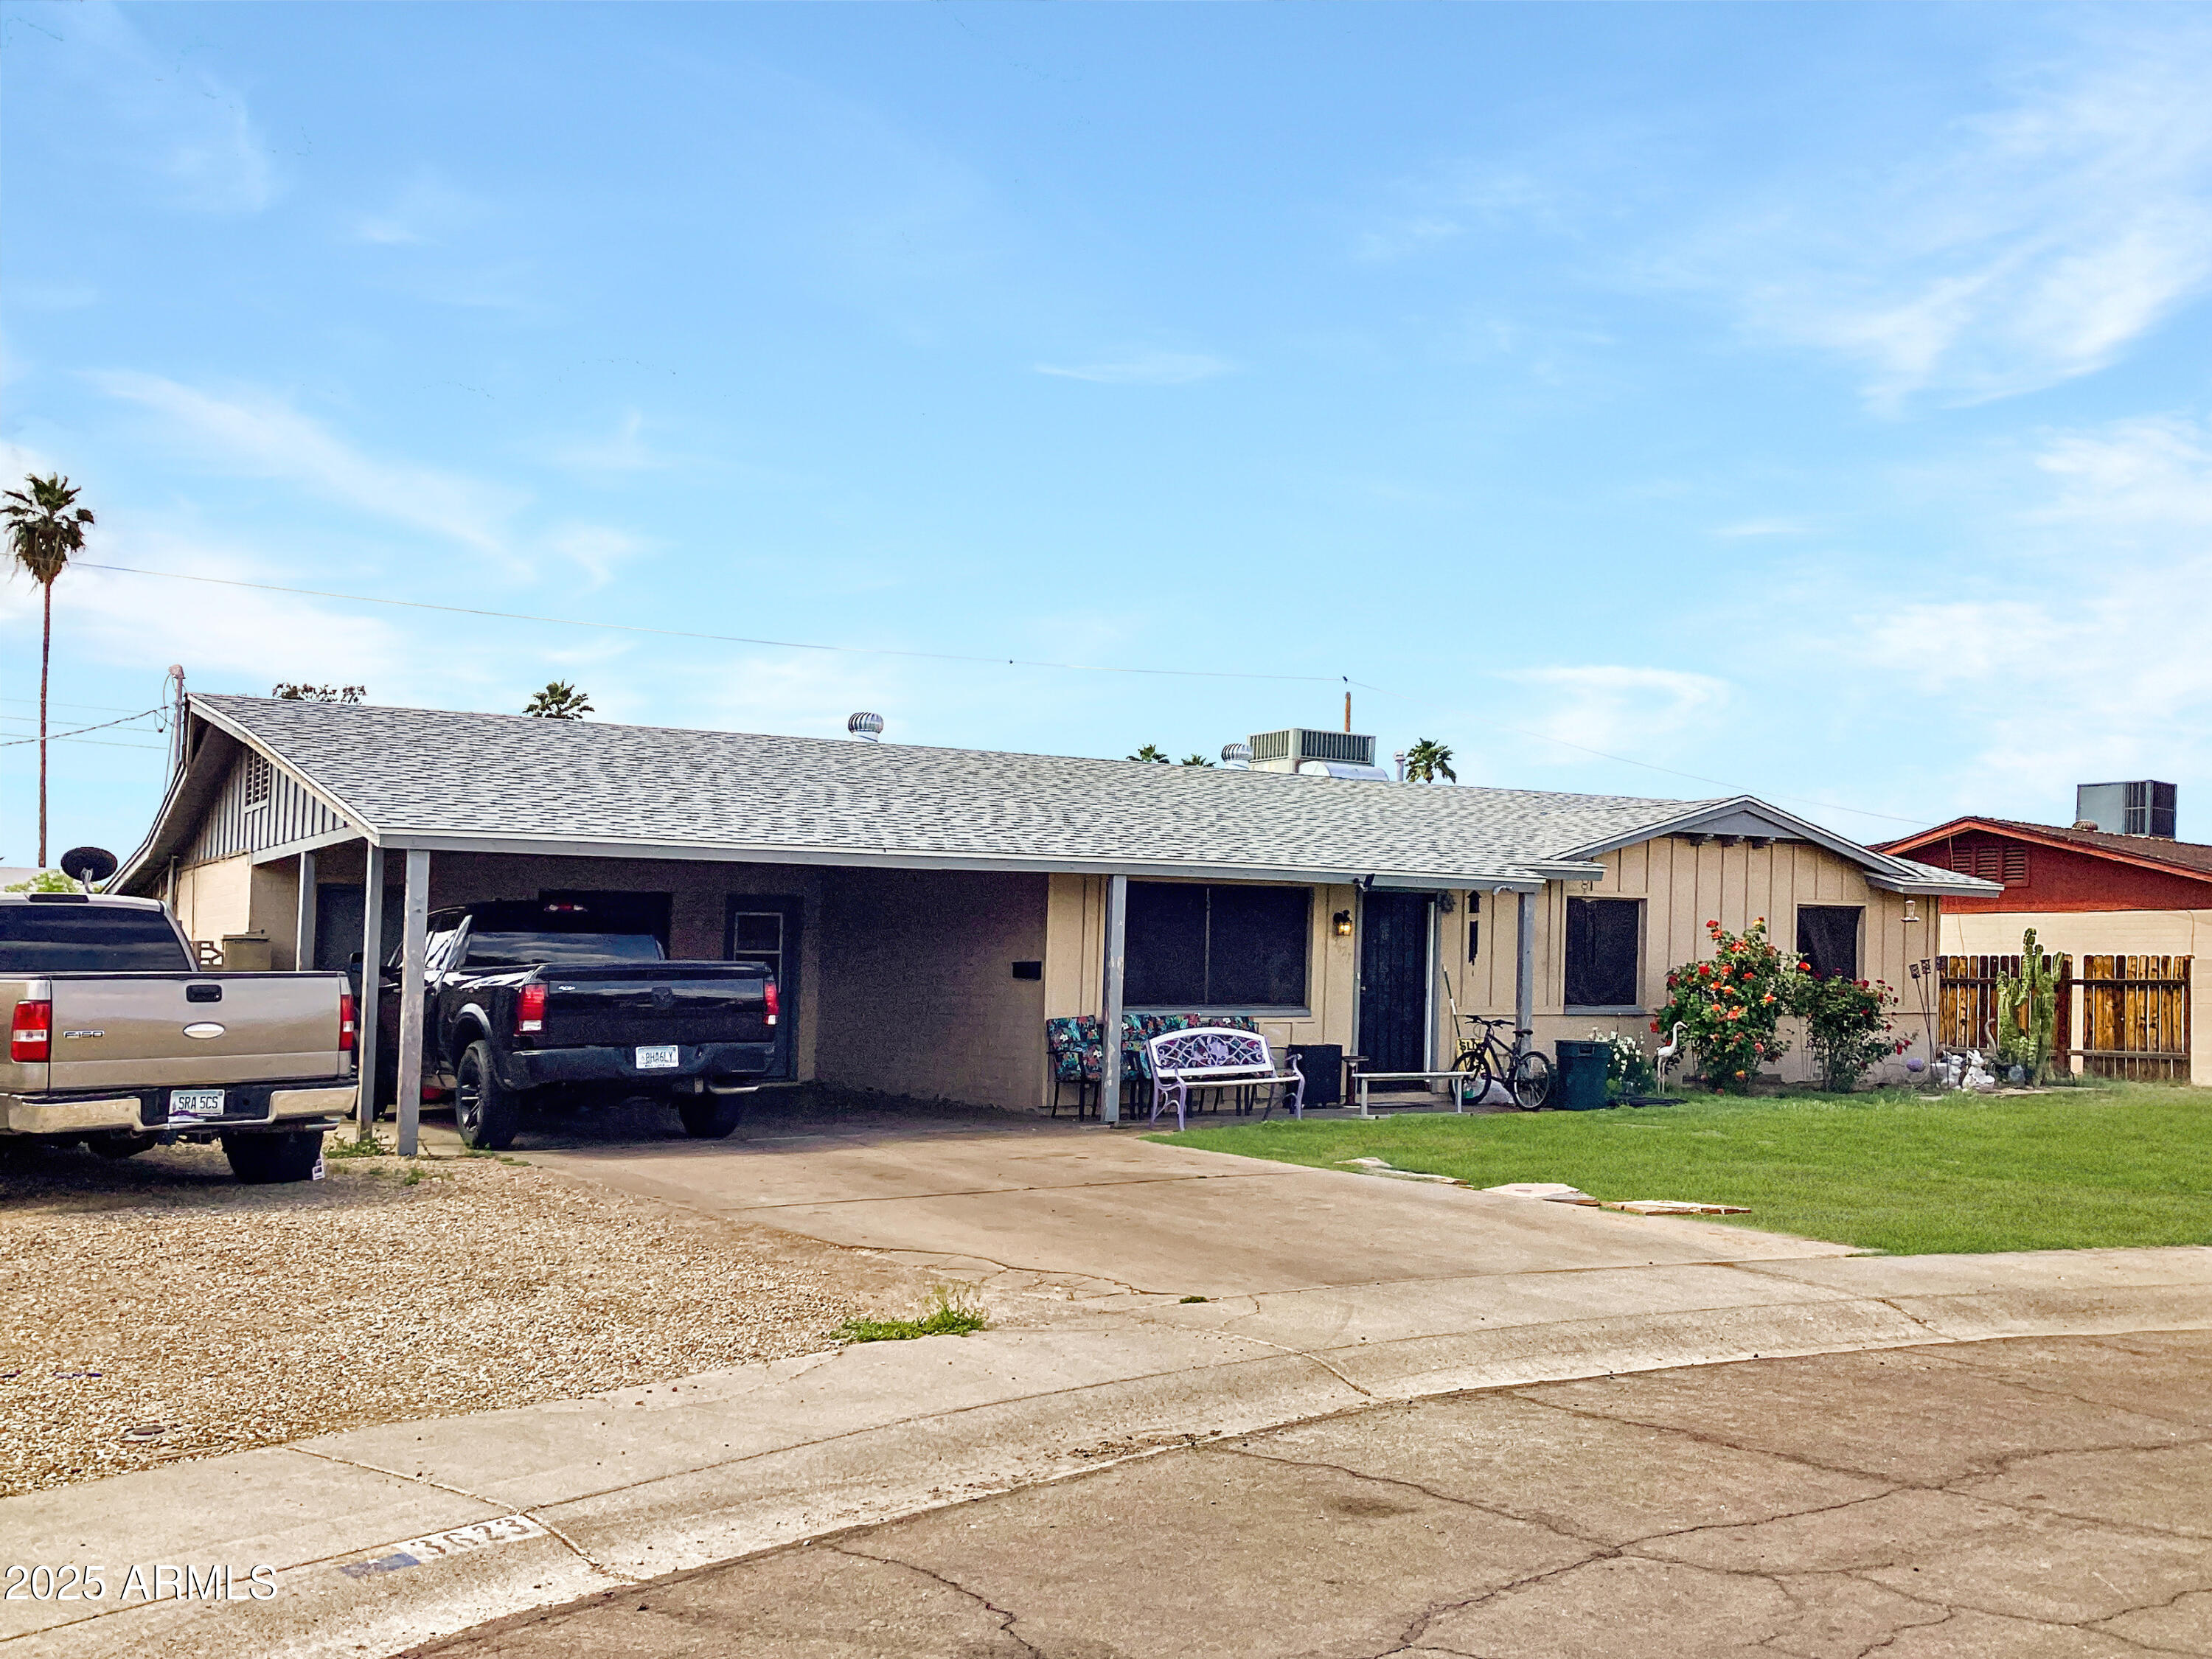
Active
$409,900
3
bds
|
2
ba
|
1,808
sqft
|
built
1968
4201 W Hatcher Rd, Phoenix, AZ 85051
$-871
Cash flow
-11.1%
Cash-on-Cash Return
3.7%
Cap rate
0.5%
Rent to Value Ratio
Active under contract
$610,000
3
bds
|
2
ba
|
1,735
sqft
|
built
1988
10838 N 10th St, Phoenix, AZ 85020
$-1,982
Cash flow
-17.0%
Cash-on-Cash Return
2.4%
Cap rate
0.4%
Rent to Value Ratio
Active under contract
$885,000
4
bds
|
3
ba
|
3,215
sqft
|
built
1995
13250 N 13th Ln, Phoenix, AZ 85029
$-1,567
Cash flow
-9.2%
Cash-on-Cash Return
4.2%
Cap rate
0.6%
Rent to Value Ratio
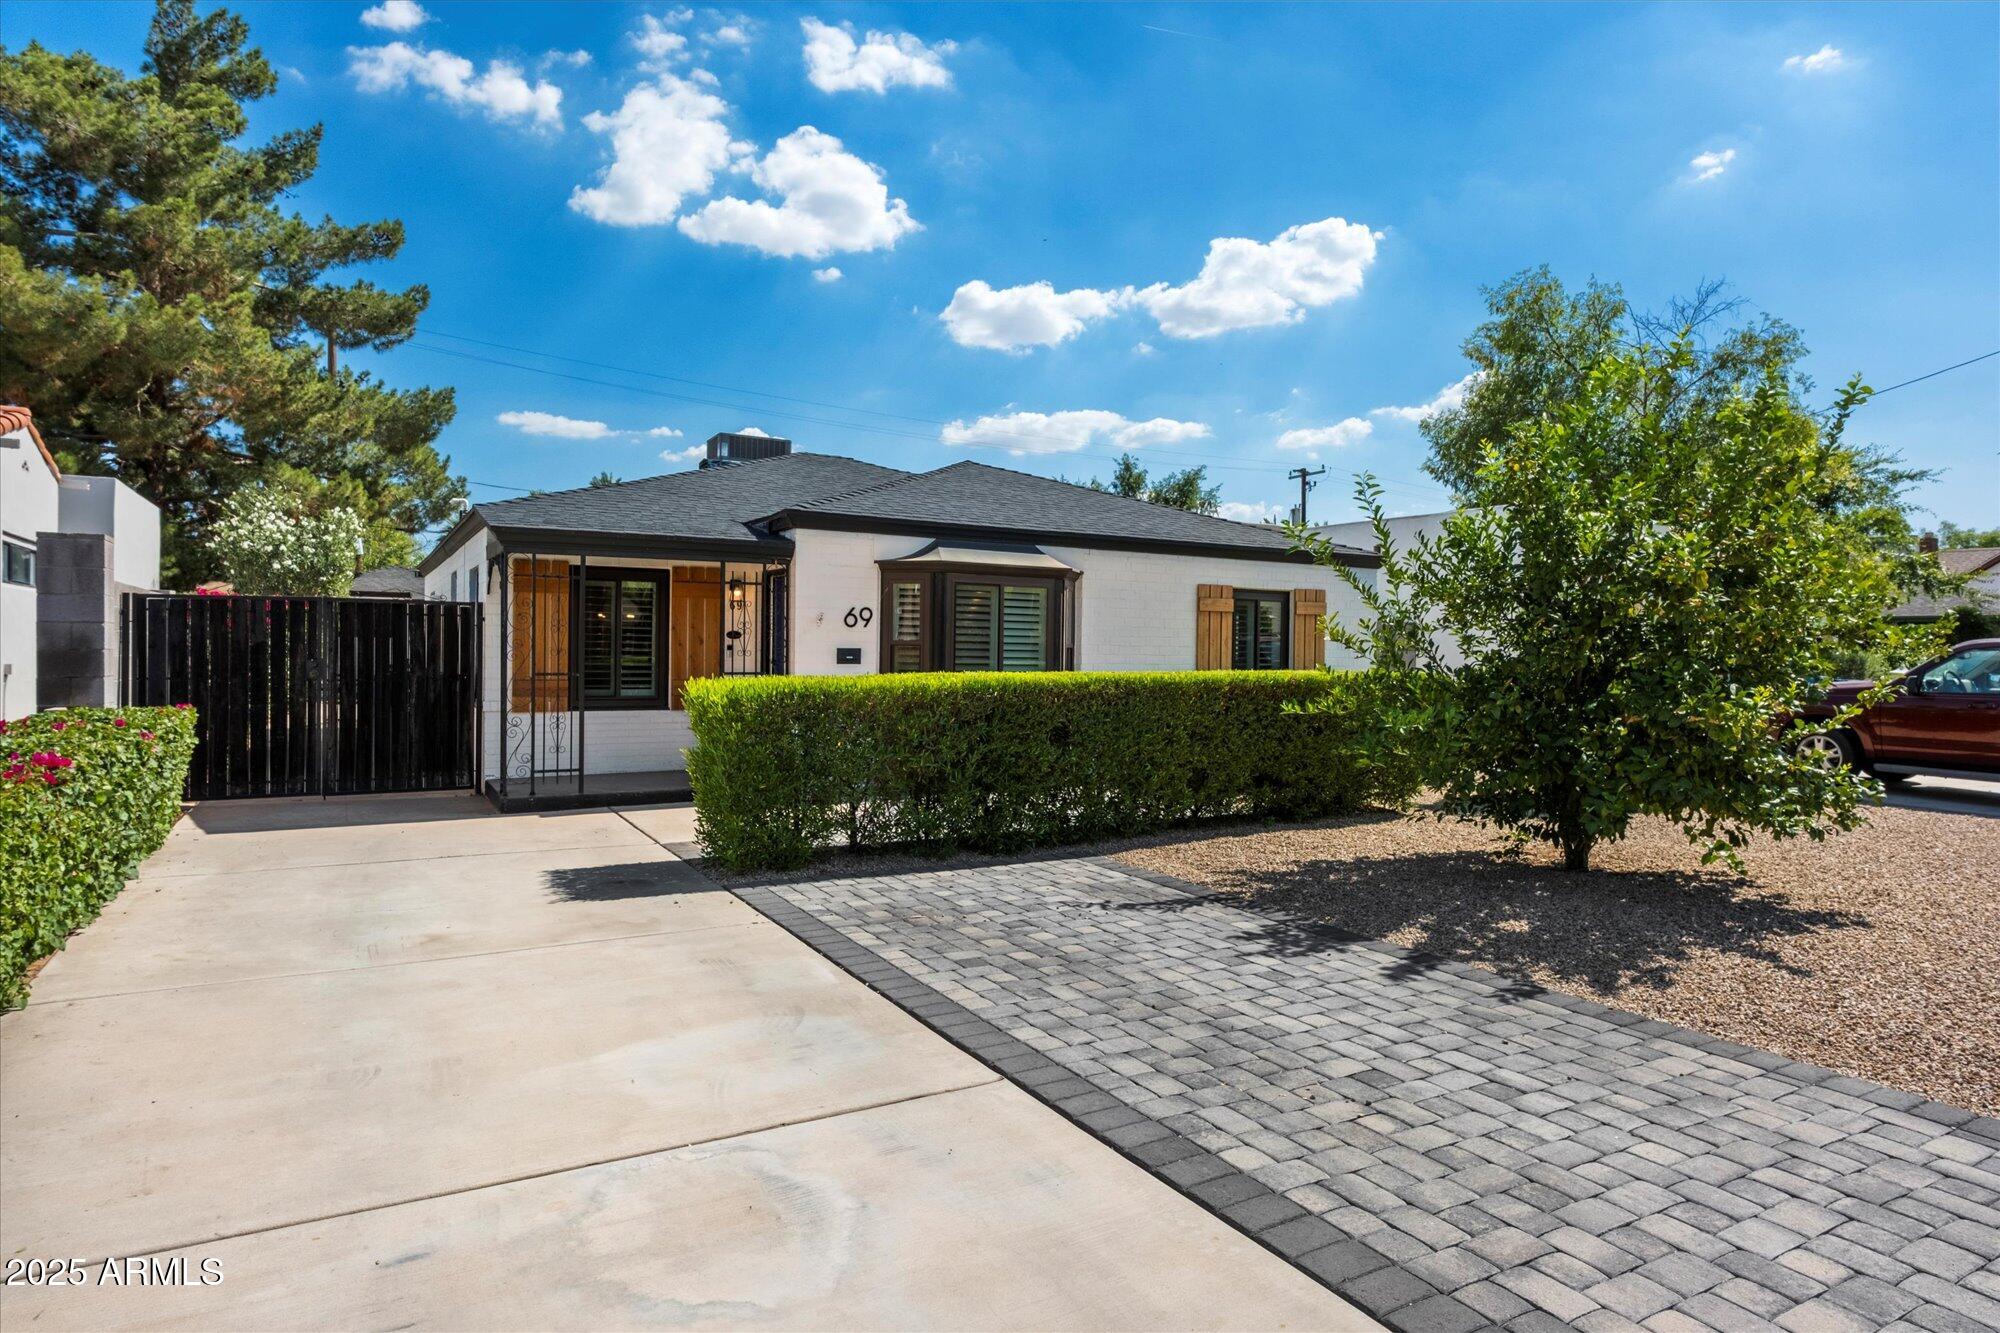
Active
$750,000
3
bds
|
3
ba
|
1,248
sqft
|
built
1946
69 W Virginia Ave, Phoenix, AZ 85003
$-1,735
Cash flow
-12.1%
Cash-on-Cash Return
3.5%
Cap rate
0.5%
Rent to Value Ratio
Active
$394,990
4
bds
|
2
ba
|
2,027
sqft
|
built
1965
3627 W Hayward Ave, Phoenix, AZ 85051
$-814
Cash flow
-10.8%
Cash-on-Cash Return
3.8%
Cap rate
0.5%
Rent to Value Ratio
Active
$539,000
3
bds
|
2
ba
|
1,312
sqft
|
built
1955
2214 N 7th Ave, Phoenix, AZ 85007
$-1,189
Cash flow
-11.5%
Cash-on-Cash Return
3.6%
Cap rate
0.5%
Rent to Value Ratio
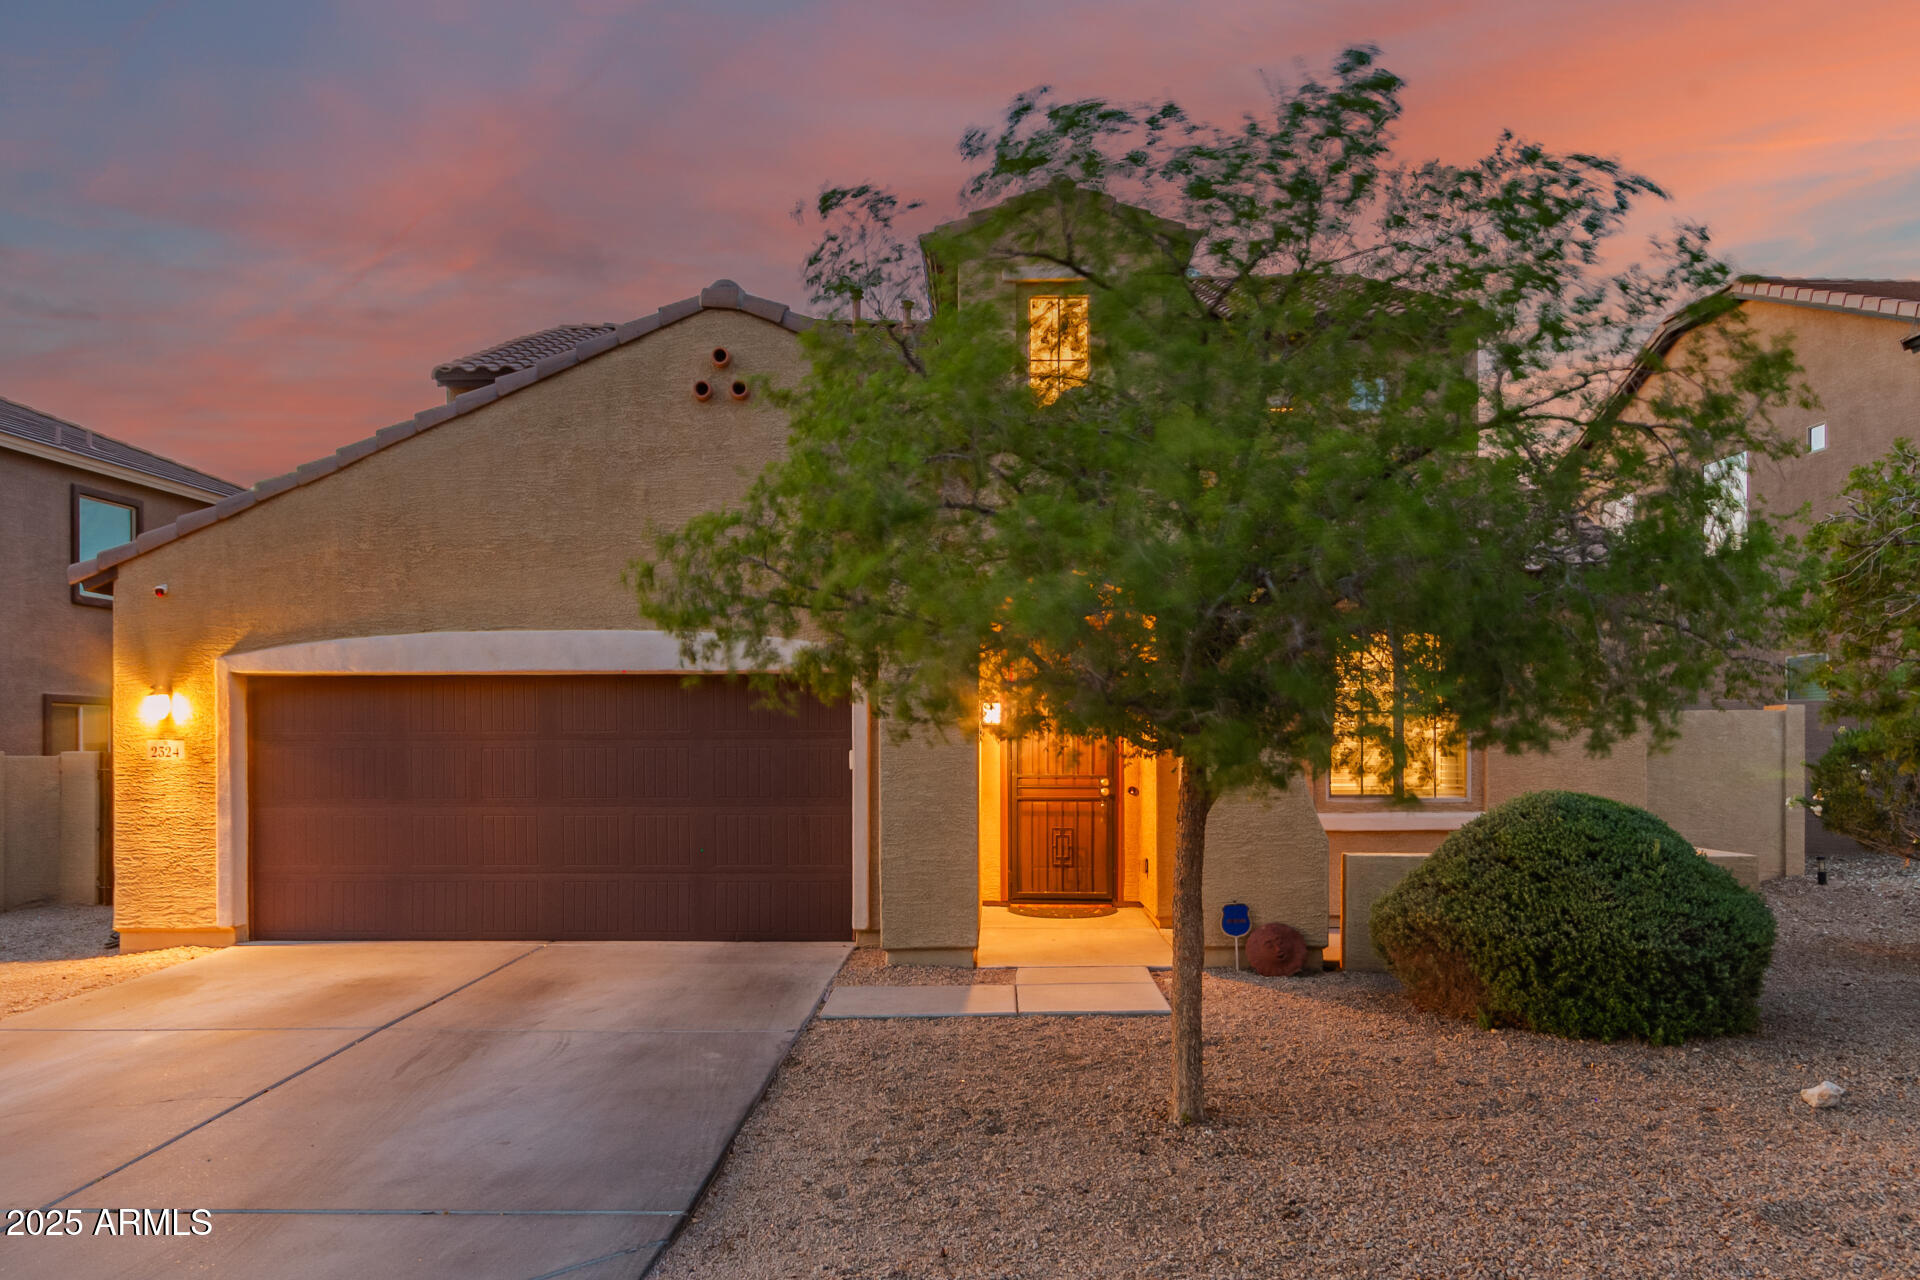
Active
$509,990
6
bds
|
4
ba
|
2,901
sqft
|
built
2012
2324 W Melody Dr, Phoenix, AZ 85041
$-1,035
Cash flow
-10.6%
Cash-on-Cash Return
3.8%
Cap rate
0.6%
Rent to Value Ratio
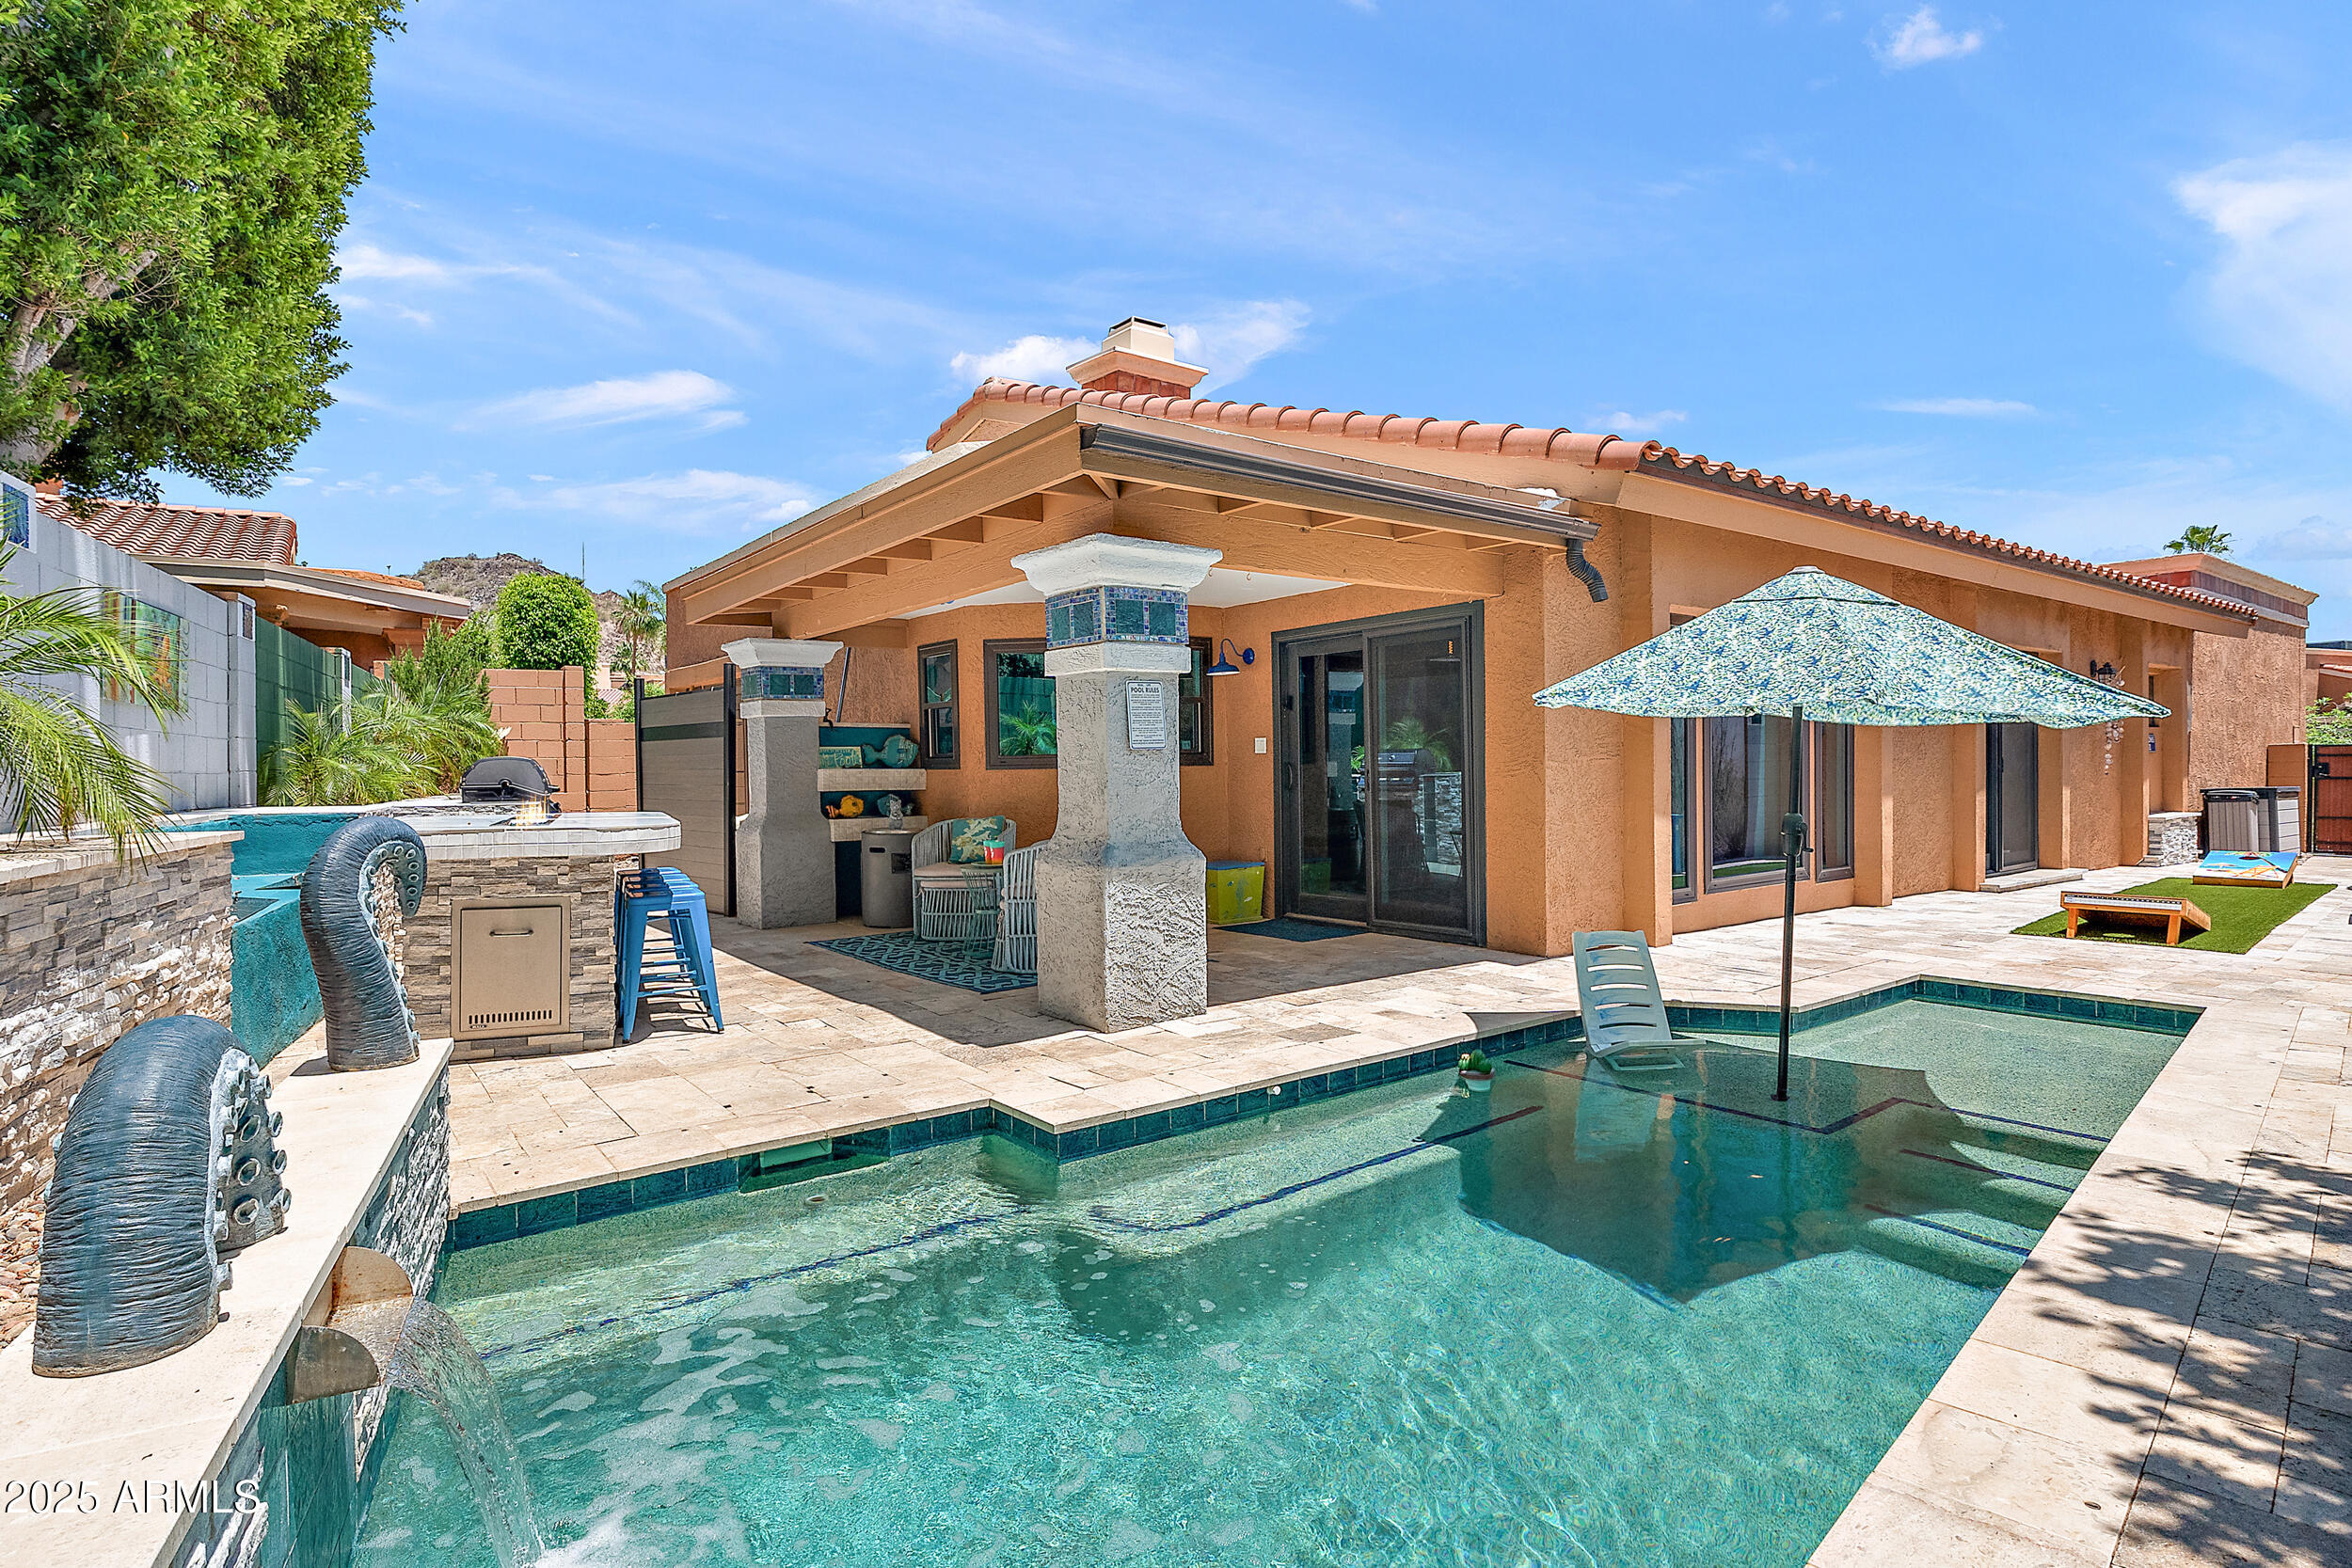
Active
$2,100,000
4
bds
|
3
ba
|
2,928
sqft
|
built
1987
3109 E Sierra Madre Way, Phoenix, AZ 85016
$-8,441
Cash flow
-21.0%
Cash-on-Cash Return
1.5%
Cap rate
0.3%
Rent to Value Ratio
Active
$574,900
3
bds
|
3
ba
|
2,102
sqft
|
built
1995
4530 E Desert Wind Dr, Phoenix, AZ 85044
$-1,467
Cash flow
-13.3%
Cash-on-Cash Return
3.2%
Cap rate
0.5%
Rent to Value Ratio
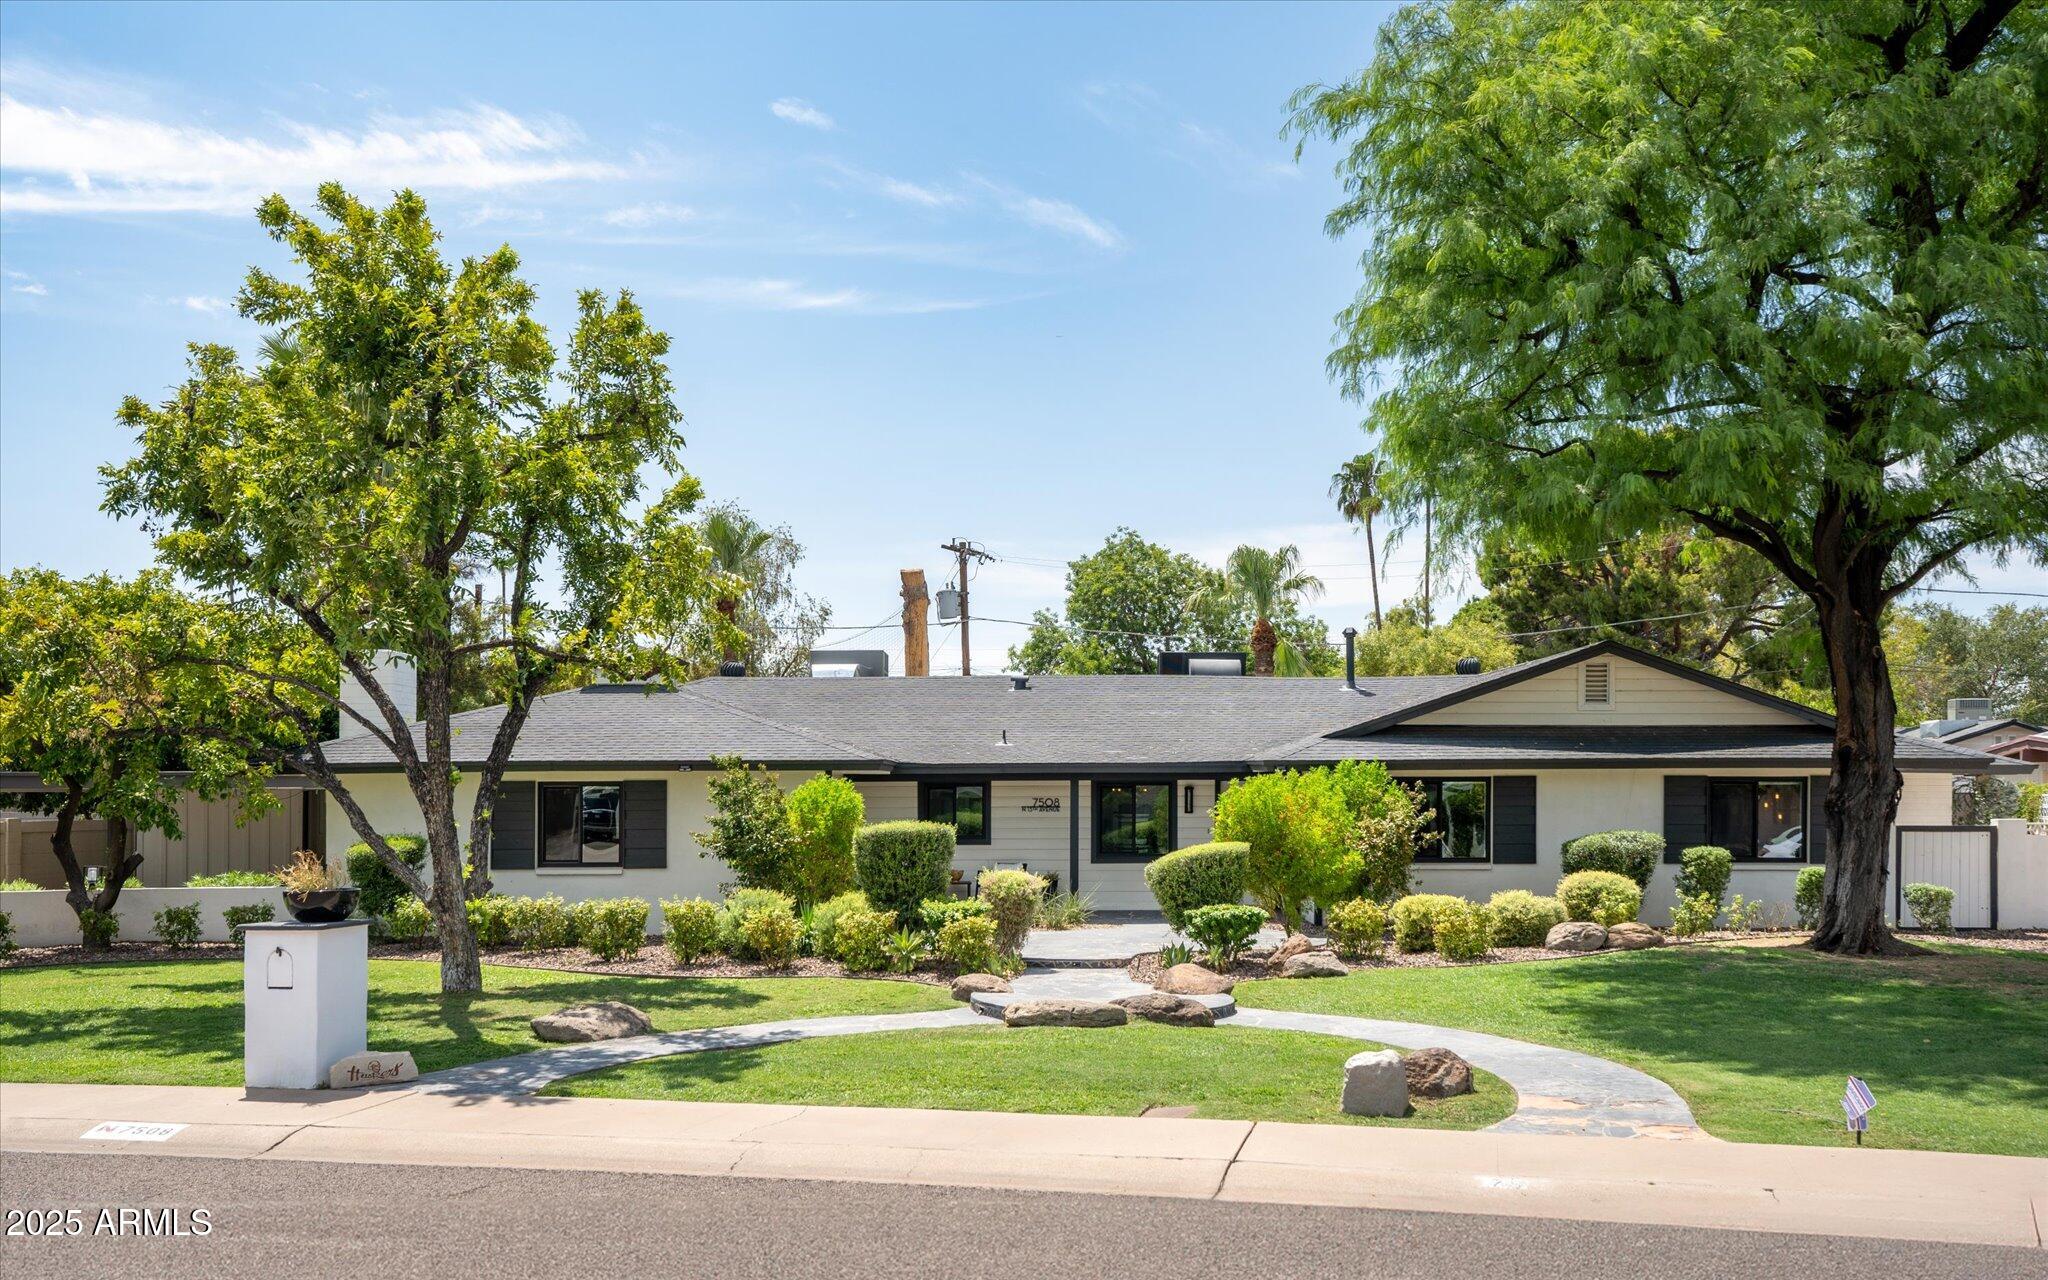
Active
$1,777,777
6
bds
|
5
ba
|
3,556
sqft
|
built
1959
7508 N 13th Ave, Phoenix, AZ 85021
$-4,173
Cash flow
-12.2%
Cash-on-Cash Return
3.5%
Cap rate
0.5%
Rent to Value Ratio
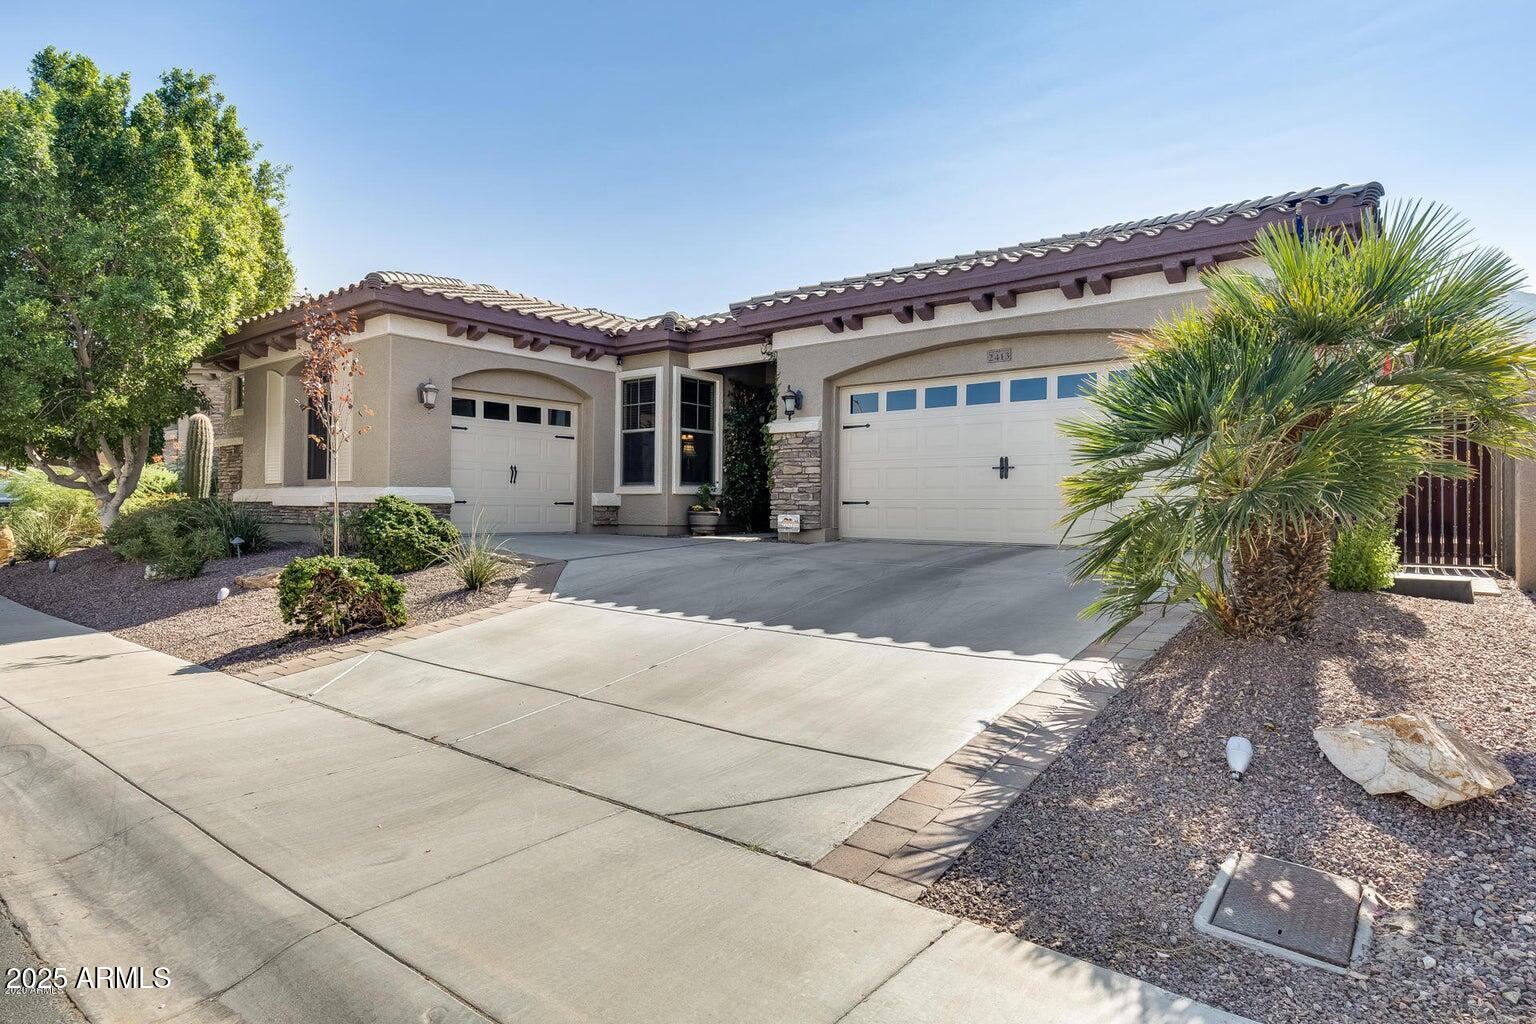
Active
$579,900
3
bds
|
3
ba
|
2,407
sqft
|
built
2007
2413 W Kachina Trl, Phoenix, AZ 85041
$-1,488
Cash flow
-13.4%
Cash-on-Cash Return
3.2%
Cap rate
0.5%
Rent to Value Ratio

Active
$425,000
3
bds
|
2
ba
|
1,611
sqft
|
built
1971
3009 W Christy Dr, Phoenix, AZ 85029
$-958
Cash flow
-11.8%
Cash-on-Cash Return
3.6%
Cap rate
0.5%
Rent to Value Ratio
Active
$595,000
3
bds
|
2
ba
|
1,871
sqft
|
built
1966
12835 N 16th Dr, Phoenix, AZ 85029
$-1,711
Cash flow
-15.0%
Cash-on-Cash Return
2.8%
Cap rate
0.4%
Rent to Value Ratio

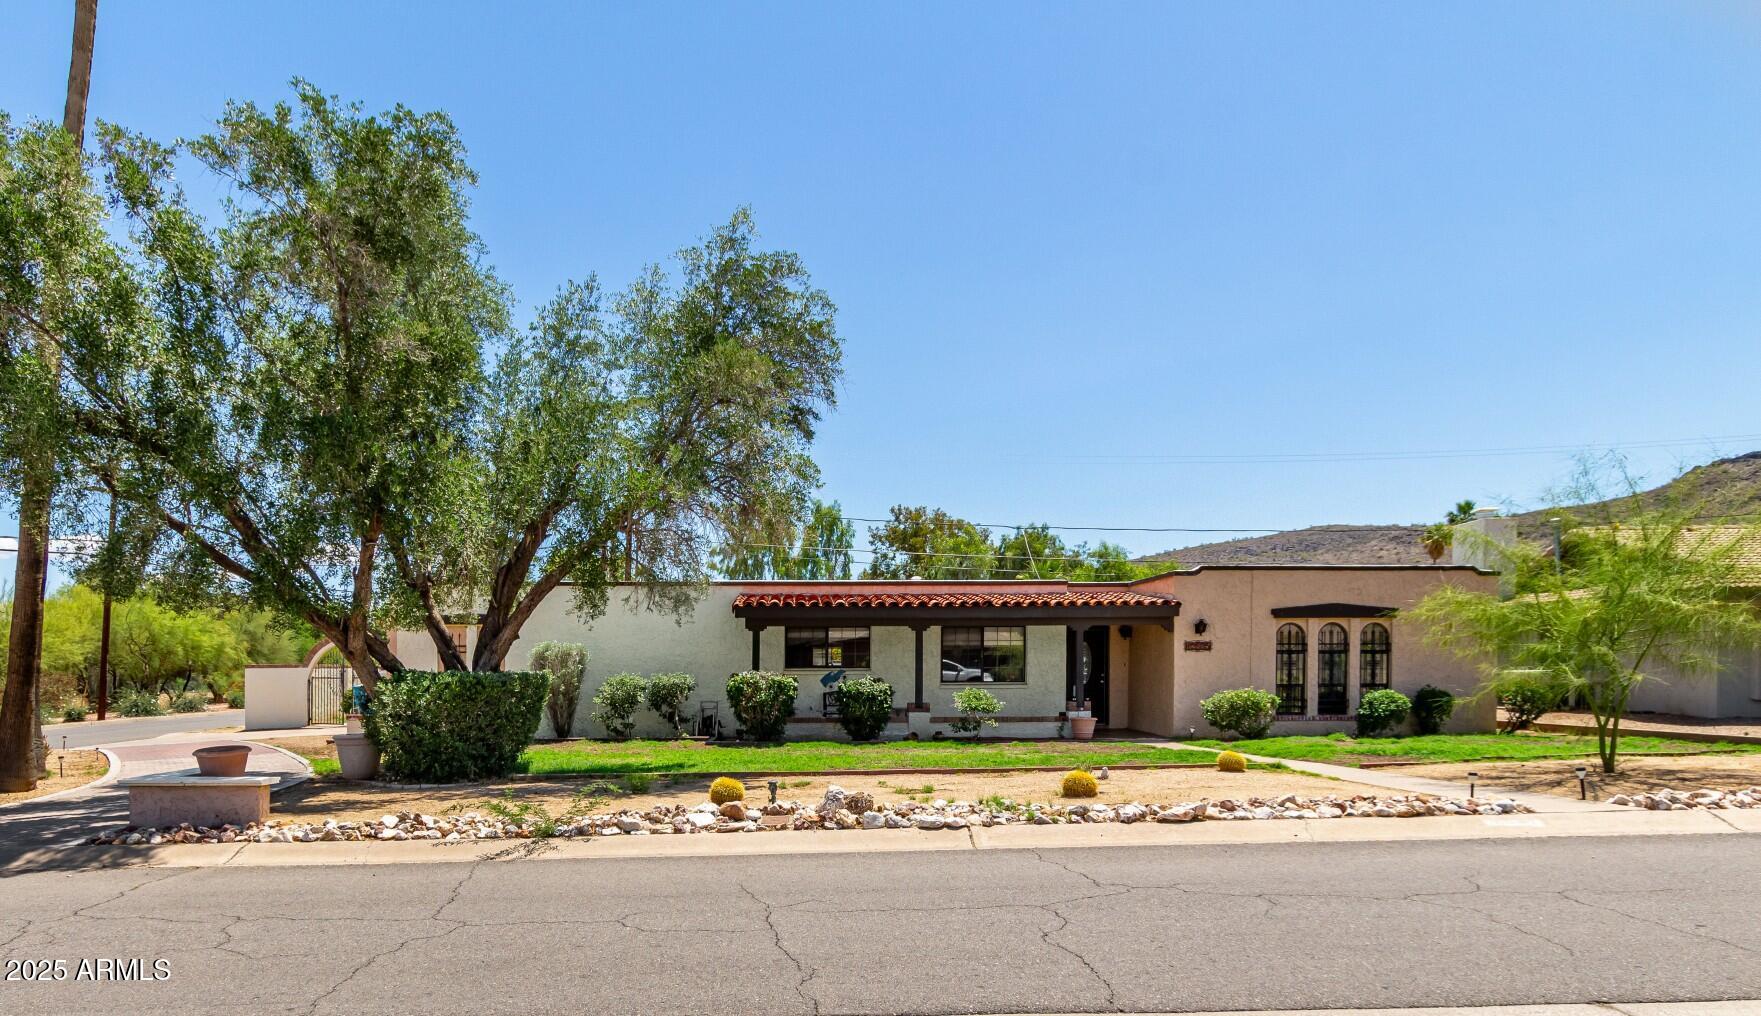
Active
$800,000
3
bds
|
2
ba
|
2,336
sqft
|
built
1998
1307 E Galvin St, Phoenix, AZ 85086
$-2,201
Cash flow
-14.4%
Cash-on-Cash Return
3.0%
Cap rate
0.4%
Rent to Value Ratio
Active
$1,175,000
5
bds
|
4
ba
|
3,068
sqft
|
built
2003
2731 W Desert Ranch Rd, Phoenix, AZ 85086
$1,381
Cash flow
6.1%
Cash-on-Cash Return
7.7%
Cap rate
1.0%
Rent to Value Ratio
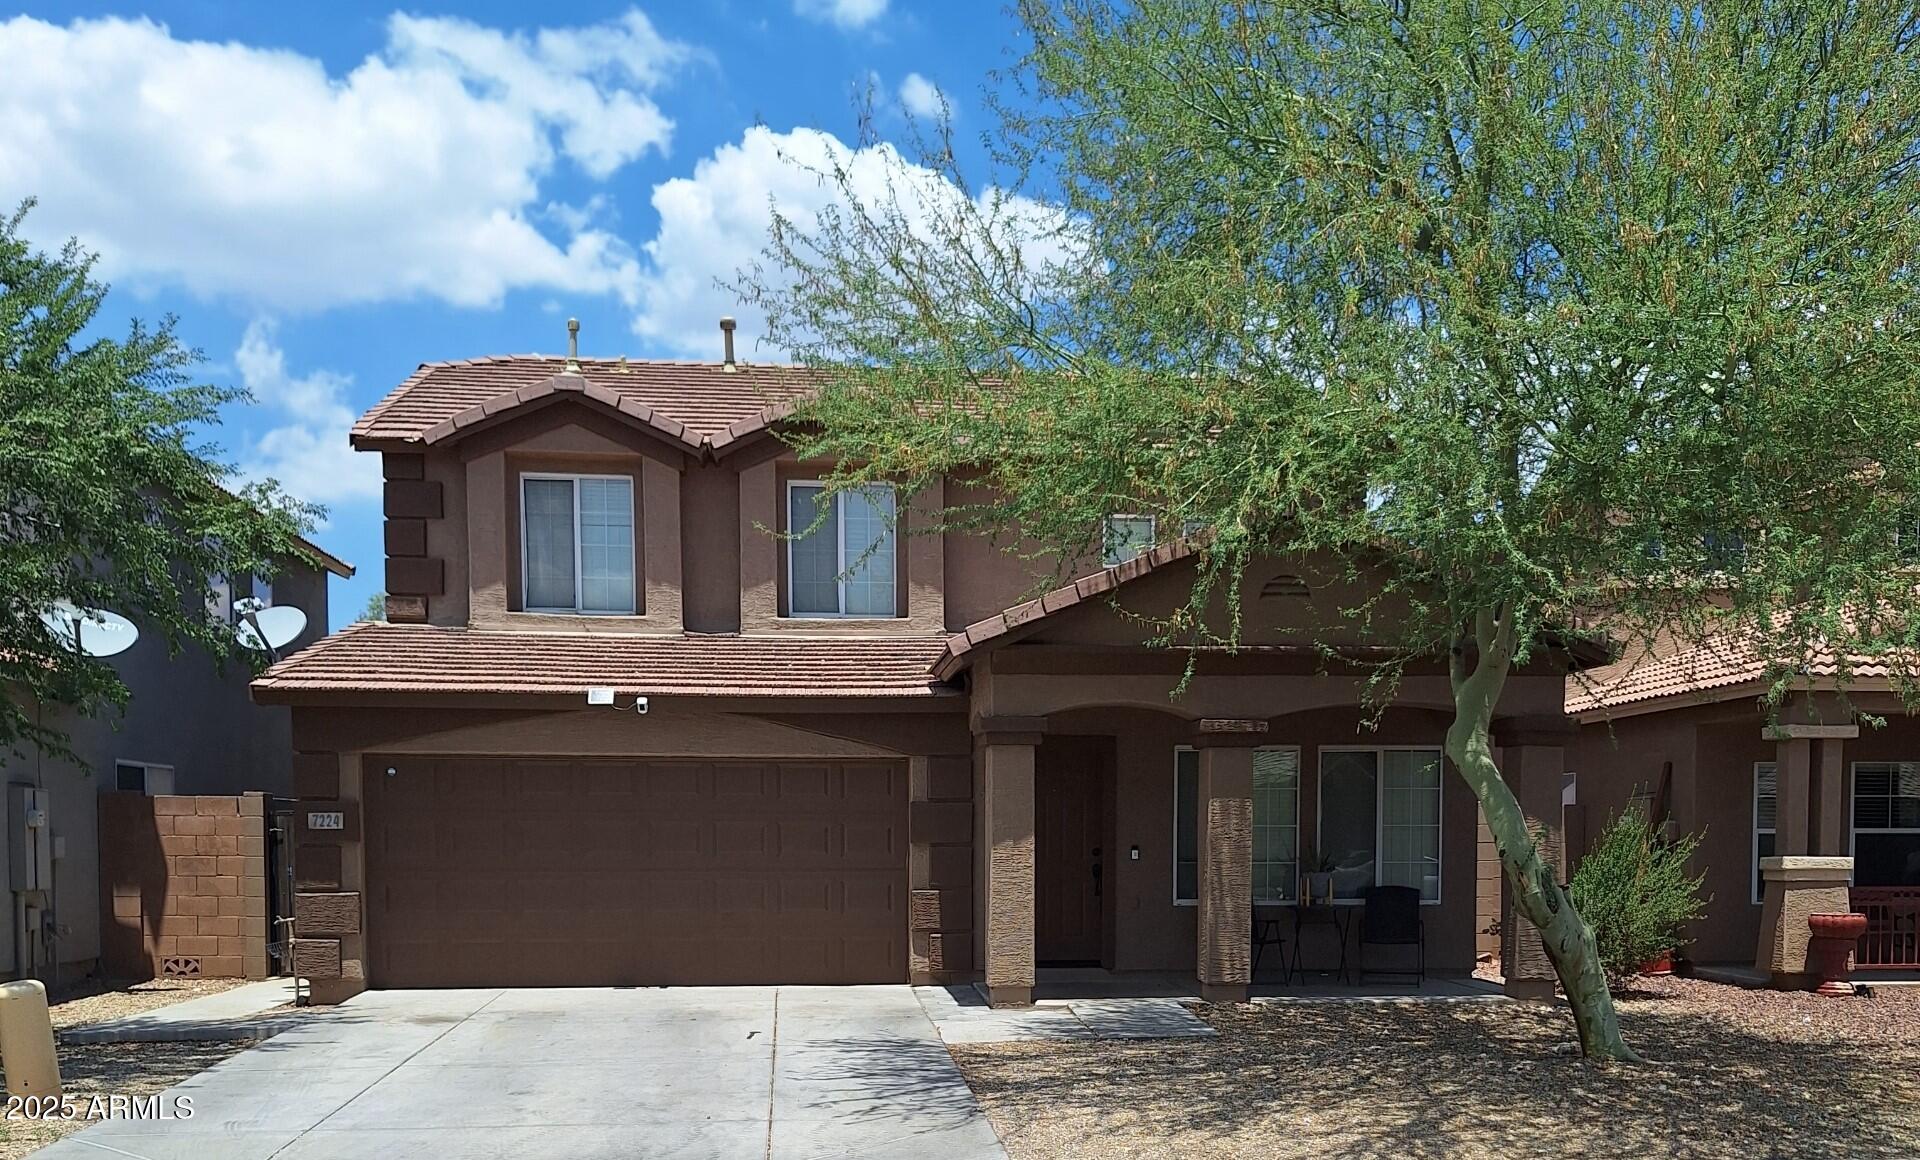
Active
$400,000
4
bds
|
3
ba
|
2,162
sqft
|
built
2005
7224 W Pioneer St, Phoenix, AZ 85043
$-779
Cash flow
-10.2%
Cash-on-Cash Return
3.9%
Cap rate
0.5%
Rent to Value Ratio
Active
$425,000
3
bds
|
3
ba
|
1,519
sqft
|
built
2005
2363 W Dusty Wren Dr, Phoenix, AZ 85085
$-1,081
Cash flow
-13.3%
Cash-on-Cash Return
3.2%
Cap rate
0.5%
Rent to Value Ratio
Active
$540,000
4
bds
|
2
ba
|
2,185
sqft
|
built
1974
5101 E Toniko Dr, Phoenix, AZ 85044
$-1,307
Cash flow
-12.6%
Cash-on-Cash Return
3.4%
Cap rate
0.5%
Rent to Value Ratio

Active
$1,325,000
5
bds
|
4
ba
|
3,783
sqft
|
built
1980
5621 N 13th St, Phoenix, AZ 85014
$-2,931
Cash flow
-11.5%
Cash-on-Cash Return
3.6%
Cap rate
0.5%
Rent to Value Ratio
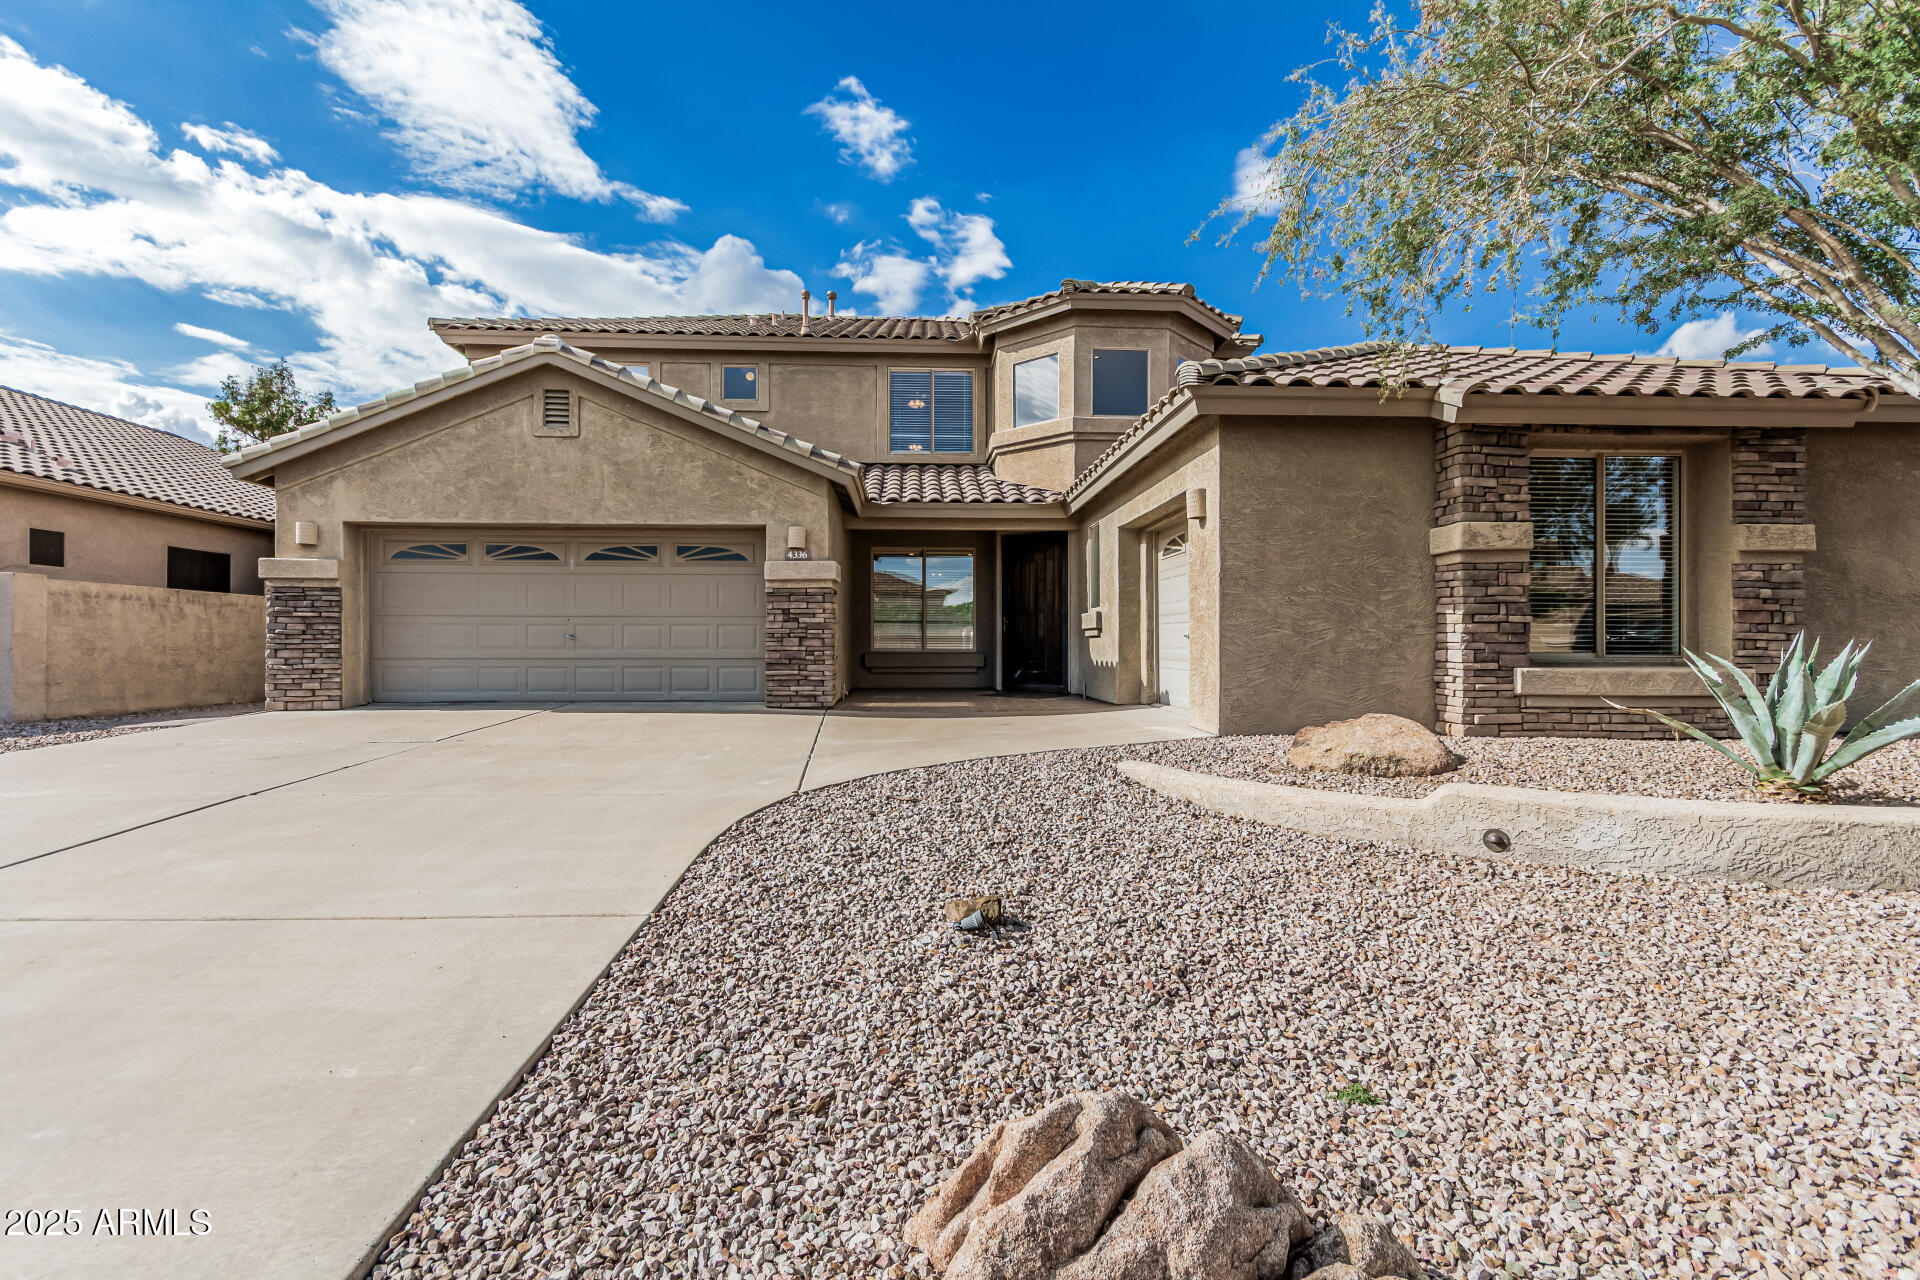
Active
$710,000
4
bds
|
4
ba
|
3,250
sqft
|
built
2000
4336 W Hackamore Dr, Phoenix, AZ 85083
$-1,930
Cash flow
-14.2%
Cash-on-Cash Return
3.0%
Cap rate
0.4%
Rent to Value Ratio
Active
$385,000
2
bds
|
1
ba
|
1,044
sqft
|
built
1923
1424 E Garfield St, Phoenix, AZ 85006
$-971
Cash flow
-13.2%
Cash-on-Cash Return
3.3%
Cap rate
0.4%
Rent to Value Ratio

Active
$1,499,900
5
bds
|
5
ba
|
4,319
sqft
|
built
2006
42037 N Bradon Way, Phoenix, AZ 85086
$-3,849
Cash flow
-13.4%
Cash-on-Cash Return
3.2%
Cap rate
0.5%
Rent to Value Ratio

Active
$1,535,000
6
bds
|
4
ba
|
5,028
sqft
|
built
1984
12015 S Tuzigoot Dr, Phoenix, AZ 85044
$-3,801
Cash flow
-12.9%
Cash-on-Cash Return
3.3%
Cap rate
0.5%
Rent to Value Ratio
Active
$489,900
2
bds
|
1
ba
|
875
sqft
|
built
1953
2223 E Roma Ave, Phoenix, AZ 85016
$-1,471
Cash flow
-15.7%
Cash-on-Cash Return
2.7%
Cap rate
0.4%
Rent to Value Ratio

Active
$975,000
4
bds
|
4
ba
|
3,143
sqft
|
built
2020
1337 E Paseo Way, Phoenix, AZ 85042
$-3,213
Cash flow
-17.2%
Cash-on-Cash Return
2.3%
Cap rate
0.4%
Rent to Value Ratio
Active
$470,000
4
bds
|
2
ba
|
1,813
sqft
|
built
1976
19013 N 18th Ave, Phoenix, AZ 85027
$-1,181
Cash flow
-13.1%
Cash-on-Cash Return
3.3%
Cap rate
0.4%
Rent to Value Ratio
Active
$600,000
4
bds
|
3
ba
|
2,345
sqft
|
built
1987
1813 E Sheena Dr, Phoenix, AZ 85022
$-1,391
Cash flow
-12.1%
Cash-on-Cash Return
3.5%
Cap rate
0.5%
Rent to Value Ratio

Active
$530,000
5
bds
|
3
ba
|
2,224
sqft
|
built
1960
19615 N 18th Dr, Phoenix, AZ 85027
$-1,479
Cash flow
-14.6%
Cash-on-Cash Return
2.9%
Cap rate
0.4%
Rent to Value Ratio
Active
$600,000
3
bds
|
3
ba
|
2,275
sqft
|
built
1987
16805 S 29th Pl, Phoenix, AZ 85048
$-1,236
Cash flow
-10.7%
Cash-on-Cash Return
3.8%
Cap rate
0.5%
Rent to Value Ratio

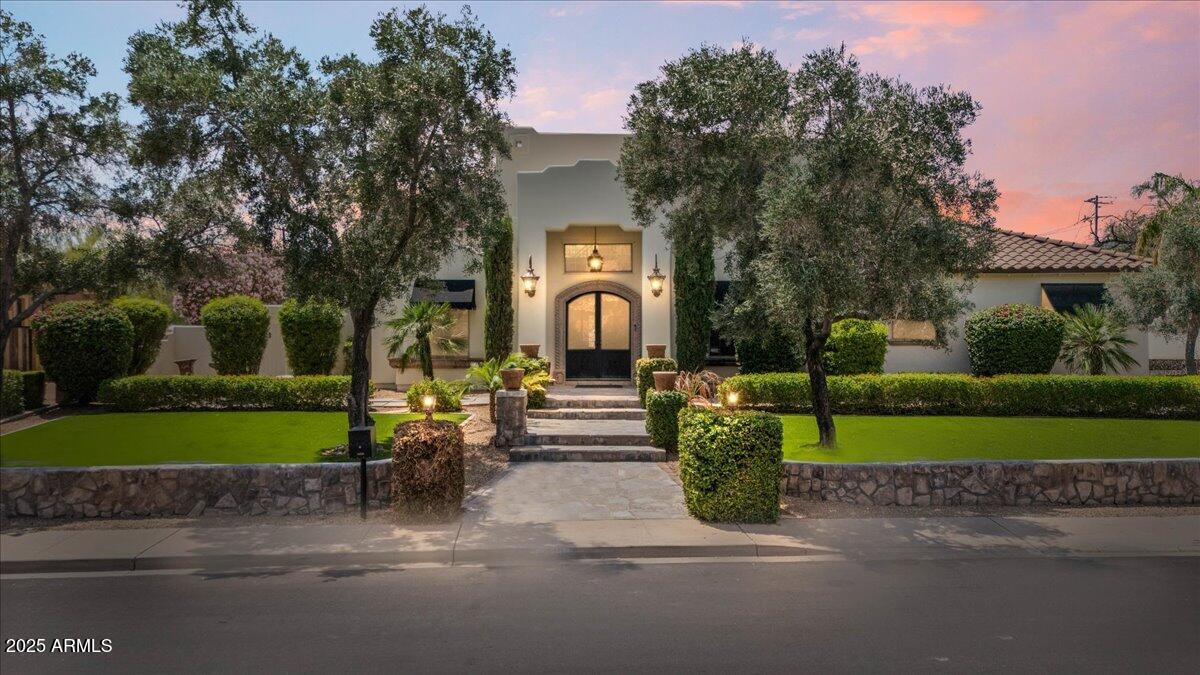
Active
$950,000
3
bds
|
2
ba
|
1,730
sqft
|
built
1958
4320 N 35th St, Phoenix, AZ 85018
$-2,148
Cash flow
-11.8%
Cash-on-Cash Return
3.6%
Cap rate
0.5%
Rent to Value Ratio
Active
$3,150,000
3
bds
|
4
ba
|
3,196
sqft
|
built
1986
3186 E Stella Ln, Phoenix, AZ 85016
$-14,789
Cash flow
-24.5%
Cash-on-Cash Return
0.7%
Cap rate
0.1%
Rent to Value Ratio
Active
$649,000
4
bds
|
3
ba
|
2,060
sqft
|
built
1957
2731 N 23rd Ave, Phoenix, AZ 85009
$-1,414
Cash flow
-11.4%
Cash-on-Cash Return
3.7%
Cap rate
0.5%
Rent to Value Ratio

Active
$1,199,999
2
bds
|
3
ba
|
1,781
sqft
|
built
2023
5250 E Deer Valley Dr, Phoenix, AZ 85054
$-5,391
Cash flow
-23.4%
Cash-on-Cash Return
0.9%
Cap rate
0.3%
Rent to Value Ratio
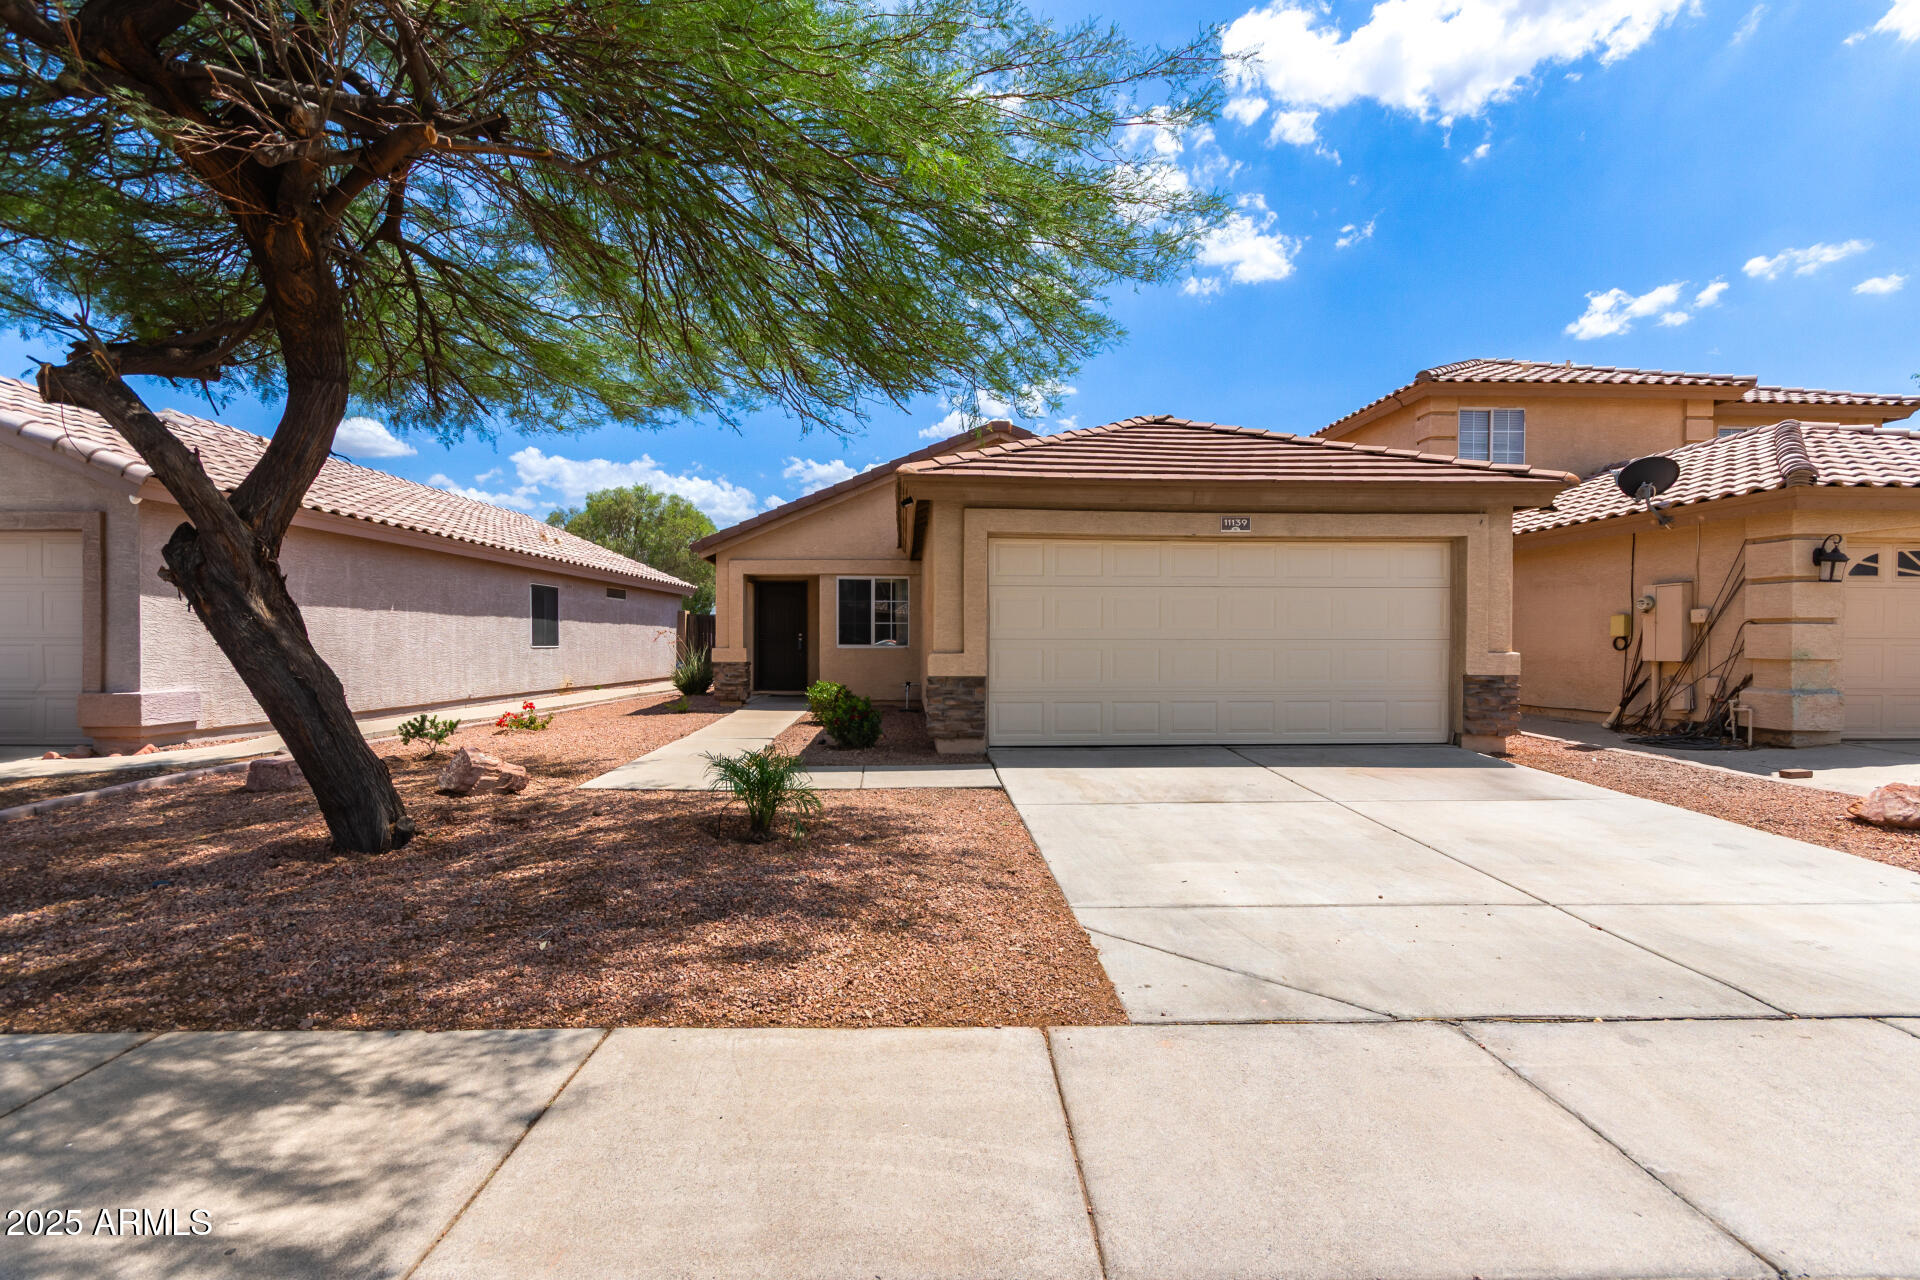
Pending
$342,500
3
bds
|
2
ba
|
1,090
sqft
|
built
1999
11139 W Devonshire Ave, Phoenix, AZ 85037
$-693
Cash flow
-10.6%
Cash-on-Cash Return
3.9%
Cap rate
0.5%
Rent to Value Ratio
Active
$739,000
5
bds
|
3
ba
|
2,986
sqft
|
built
1990
15829 S 13th Pl, Phoenix, AZ 85048
$-2,026
Cash flow
-14.3%
Cash-on-Cash Return
3.0%
Cap rate
0.4%
Rent to Value Ratio
Active
$1,265,000
5
bds
|
3
ba
|
2,779
sqft
|
built
2021
2028 E Chama Dr, Phoenix, AZ 85024
$-3,523
Cash flow
-14.5%
Cash-on-Cash Return
2.9%
Cap rate
0.4%
Rent to Value Ratio
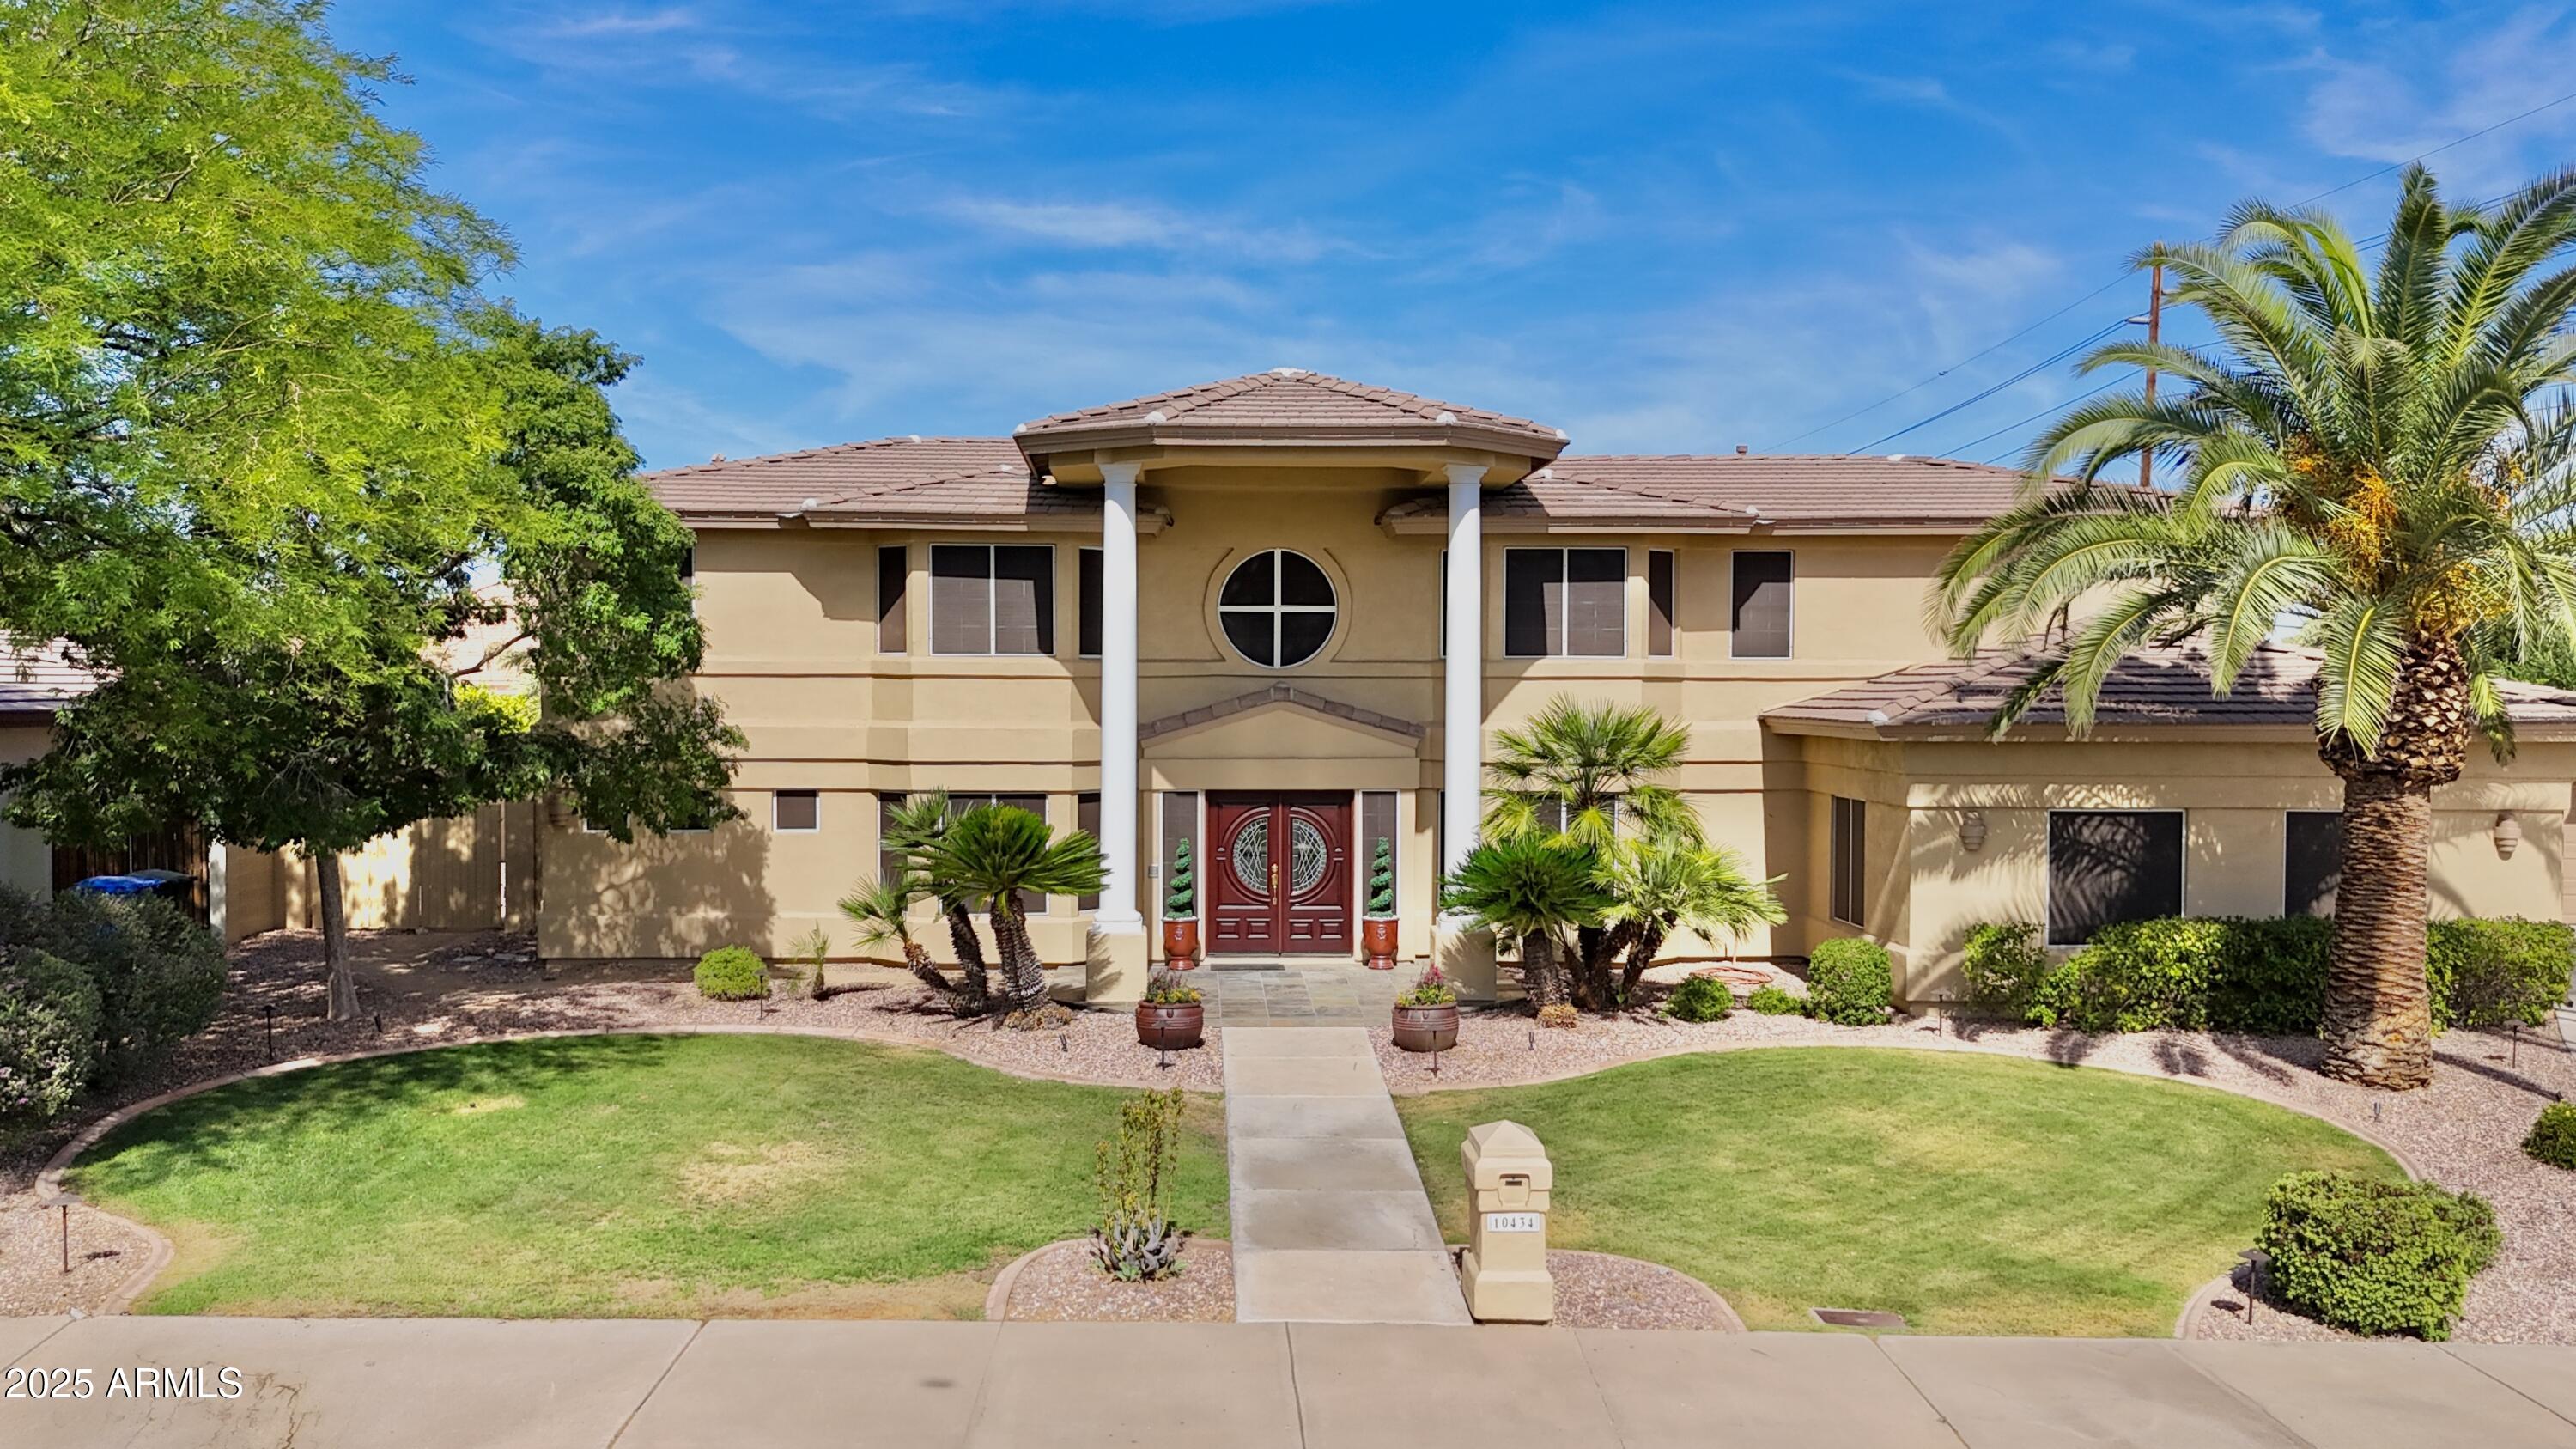
Active
$1,970,000
5
bds
|
6
ba
|
4,459
sqft
|
built
2001
10434 N 44th St, Phoenix, AZ 85028
$-5,928
Cash flow
-15.7%
Cash-on-Cash Return
2.7%
Cap rate
0.4%
Rent to Value Ratio
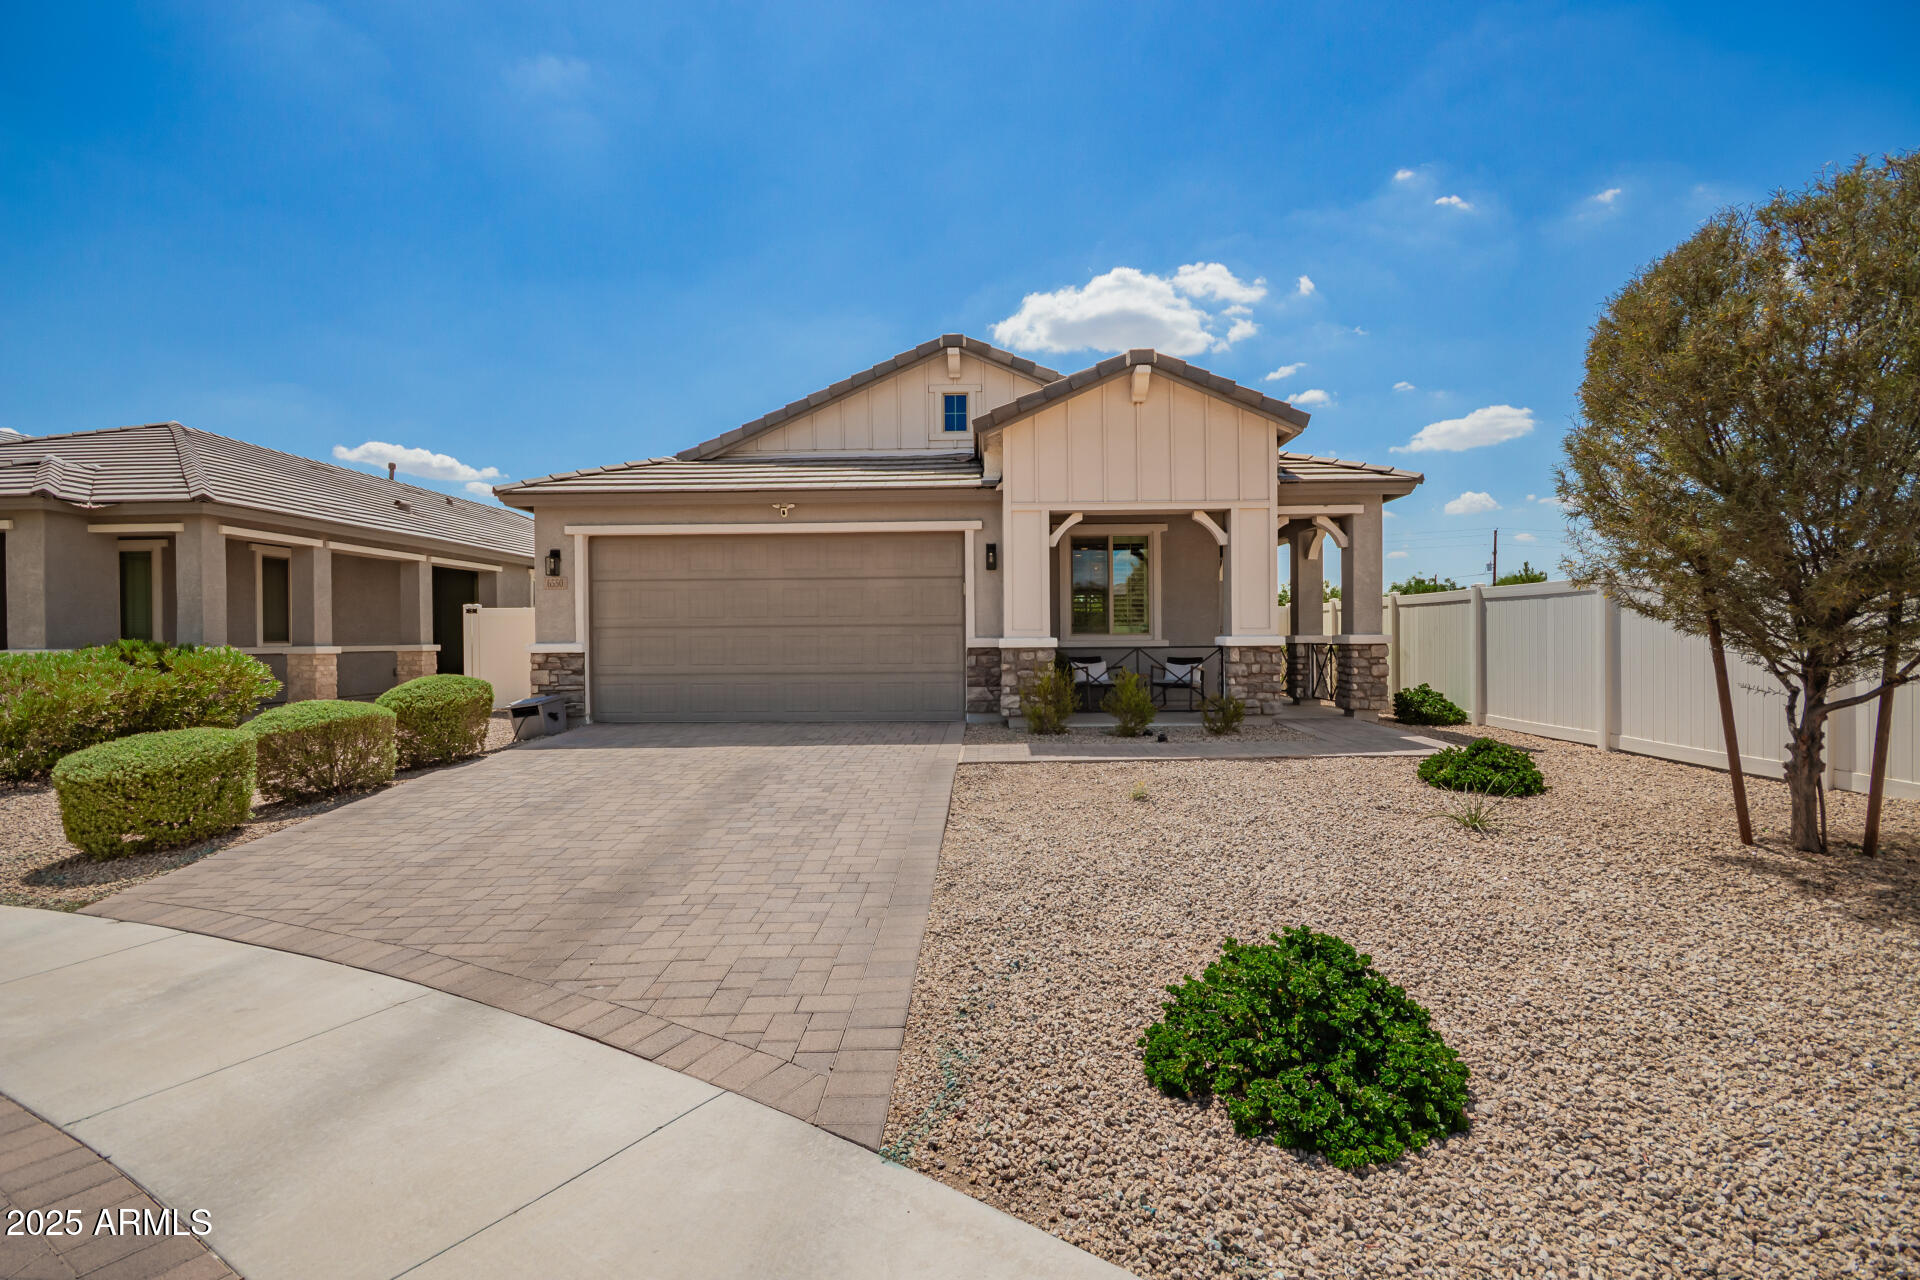
Active
$479,000
4
bds
|
2
ba
|
1,879
sqft
|
built
2019
6550 S 24th Pl, Phoenix, AZ 85042
$-1,218
Cash flow
-13.3%
Cash-on-Cash Return
3.2%
Cap rate
0.5%
Rent to Value Ratio