Port Richey, FL Investment Properties for Sale
Browse homes for sale and investment properties in Port Richey, FL. Refine your search by price, property type, or more.
Best cash flowing properties in Port Richey, FL

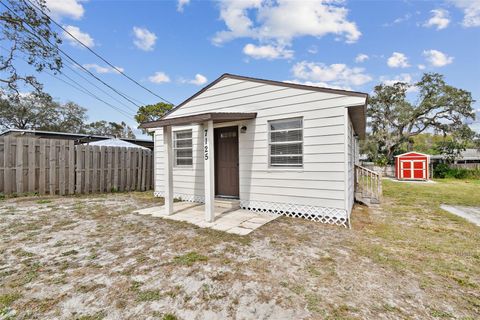
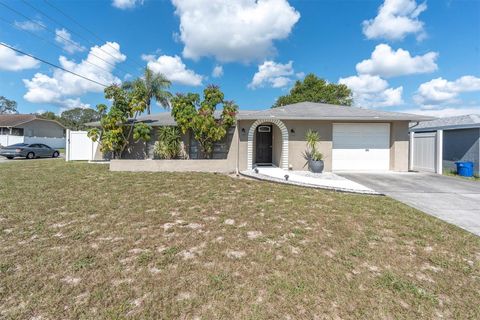
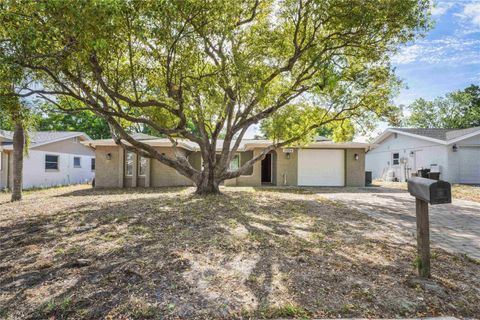
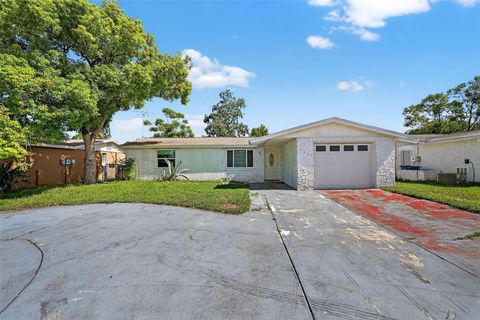
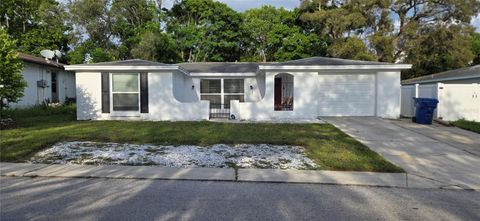
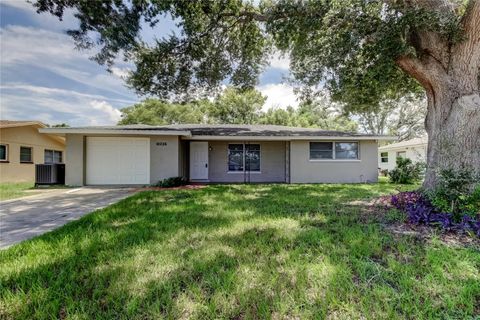
Active
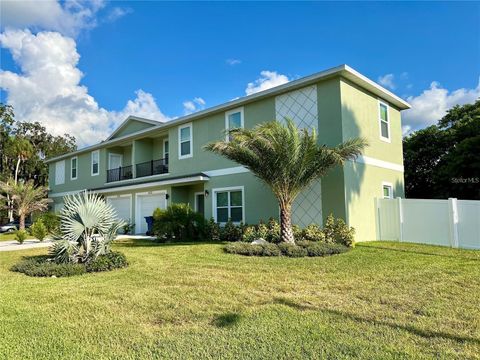
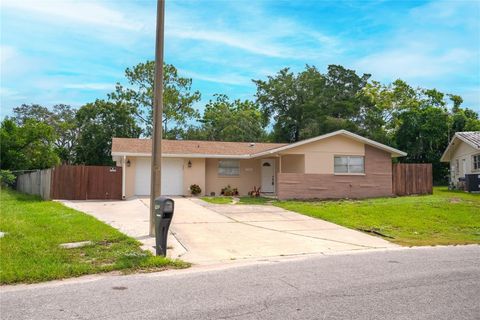
$104,900
3
bds
|
1
ba
|
1,156
sqft
|
built
1974
5549 Quist Dr, Port Richey, FL 34668
$469
Cash flow
23.3%
Cash-on-Cash Return
11.5%
Cap rate
1.7%
Rent to Value Ratio
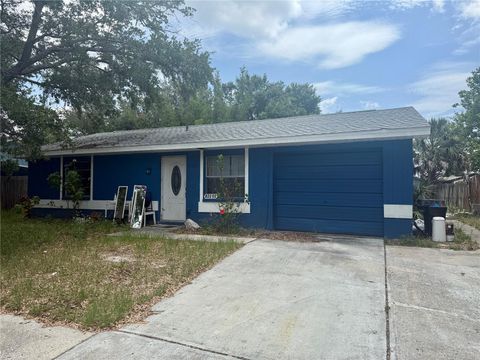
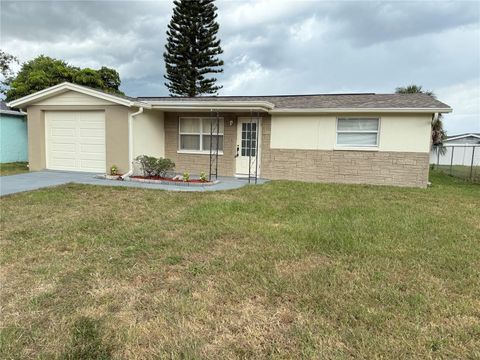
Active
$149,000
1
bds
|
1
ba
|
600
sqft
|
built
1960
7125 Colfax Dr, Port Richey, FL 34668
$115
Cash flow
4.0%
Cash-on-Cash Return
7.1%
Cap rate
0.9%
Rent to Value Ratio
185 out of 185 properties for sale in Port Richey, FL
Limited Results Shown
Create a free account, or log in to reveal all property listings and enjoy the complete experience.
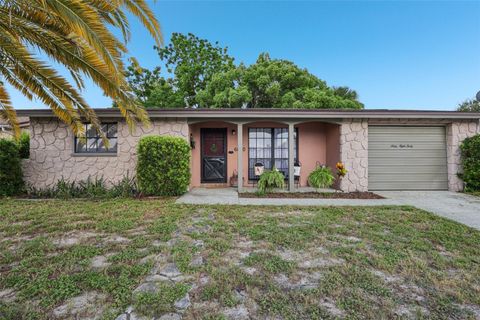
Active
$180,000
2
bds
|
2
ba
|
1,025
sqft
|
built
1982
8150 Brent St, Port Richey, FL 34668
$114
Cash flow
3.3%
Cash-on-Cash Return
6.9%
Cap rate
1.1%
Rent to Value Ratio
Active
$264,900
2
bds
|
2
ba
|
1,497
sqft
|
built
1974
7425 Buchanan Dr, Port Richey, FL 34668
$-236
Cash flow
-4.6%
Cash-on-Cash Return
5.1%
Cap rate
0.8%
Rent to Value Ratio
Active
$289,000
3
bds
|
2
ba
|
1,562
sqft
|
built
1972
9826 Lehigh Dr, Port Richey, FL 34668
$-323
Cash flow
-5.8%
Cash-on-Cash Return
4.8%
Cap rate
0.6%
Rent to Value Ratio

Active
$274,900
2
bds
|
2
ba
|
1,234
sqft
|
built
1973
7700 Birchwood Dr, Port Richey, FL 34668
$-170
Cash flow
-3.2%
Cash-on-Cash Return
5.4%
Cap rate
0.7%
Rent to Value Ratio
Active
$299,000
2
bds
|
2
ba
|
1,254
sqft
|
built
1979
9005 Hermitage Ln, Port Richey, FL 34668
$-495
Cash flow
-8.6%
Cash-on-Cash Return
4.2%
Cap rate
0.6%
Rent to Value Ratio
Active
$279,000
3
bds
|
2
ba
|
1,467
sqft
|
built
1977
7311 San Moritz Dr, Port Richey, FL 34668
$-220
Cash flow
-4.1%
Cash-on-Cash Return
5.2%
Cap rate
0.8%
Rent to Value Ratio
Active
$325,000
3
bds
|
2
ba
|
1,442
sqft
|
built
1978
9720 Gray Fox Ln, Port Richey, FL 34668
$-618
Cash flow
-9.9%
Cash-on-Cash Return
3.9%
Cap rate
0.6%
Rent to Value Ratio
Active
$289,000
2
bds
|
2
ba
|
1,260
sqft
|
built
1977
10404 Loquat Dr, Port Richey, FL 34668
$-240
Cash flow
-4.3%
Cash-on-Cash Return
5.1%
Cap rate
0.8%
Rent to Value Ratio

Active
$494,900
3
bds
|
2
ba
|
1,752
sqft
|
built
1979
9811 San Mateo Way, Port Richey, FL 34668
$-329
Cash flow
-3.5%
Cash-on-Cash Return
5.3%
Cap rate
0.8%
Rent to Value Ratio

Active
$349,900
4
bds
|
2
ba
|
1,270
sqft
|
built
1957
5808 Sun Glo Ave, Port Richey, FL 34668
$-783
Cash flow
-11.7%
Cash-on-Cash Return
3.5%
Cap rate
0.5%
Rent to Value Ratio
Active
$285,000
3
bds
|
2
ba
|
1,454
sqft
|
built
1973
10824 Oldham Rd, Port Richey, FL 34668
$-169
Cash flow
-3.1%
Cash-on-Cash Return
5.4%
Cap rate
0.8%
Rent to Value Ratio
Active
$179,900
2
bds
|
1
ba
|
744
sqft
|
built
1984
10320 County Lake Dr, Port Richey, FL 34668
$-36
Cash flow
-1.0%
Cash-on-Cash Return
5.9%
Cap rate
0.9%
Rent to Value Ratio

Active
$250,000
2
bds
|
1
ba
|
1,040
sqft
|
built
1975
9035 Sterling Ln, Port Richey, FL 34668
$-235
Cash flow
-4.9%
Cash-on-Cash Return
5.0%
Cap rate
0.7%
Rent to Value Ratio

Active
$165,000
2
bds
|
2
ba
|
1,025
sqft
|
built
1982
8150 Brent St, Port Richey, FL 34668
$-718
Cash flow
-22.7%
Cash-on-Cash Return
0.9%
Cap rate
1.3%
Rent to Value Ratio
Active
$320,000
5
bds
|
3
ba
|
1,950
sqft
|
built
1988
8124 Cormel St, Port Richey, FL 34668
$-1,376
Cash flow
-22.4%
Cash-on-Cash Return
1.0%
Cap rate
0.4%
Rent to Value Ratio
Active
$250,000
2
bds
|
1
ba
|
682
sqft
|
built
1981
9015 Westby Ln, Port Richey, FL 34668
$-381
Cash flow
-8.0%
Cash-on-Cash Return
4.3%
Cap rate
0.6%
Rent to Value Ratio
Active
$669,000
4
bds
|
6
ba
|
3,104
sqft
|
built
2023
5630 Queener Ave, Port Richey, FL 34668
$-2,533
Cash flow
-19.8%
Cash-on-Cash Return
1.6%
Cap rate
0.4%
Rent to Value Ratio
Active
$240,000
2
bds
|
2
ba
|
1,184
sqft
|
built
1977
8739 Lido Ln, Port Richey, FL 34668
$-344
Cash flow
-7.5%
Cash-on-Cash Return
4.4%
Cap rate
0.7%
Rent to Value Ratio

Active
$220,000
2
bds
|
2
ba
|
1,120
sqft
|
built
1974
8650 Congress St, Port Richey, FL 34668
$-158
Cash flow
-3.7%
Cash-on-Cash Return
5.3%
Cap rate
0.8%
Rent to Value Ratio
Active
$209,900
2
bds
|
2
ba
|
1,051
sqft
|
built
1973
6840 Mesa Verde St, Port Richey, FL 34668
$-128
Cash flow
-3.2%
Cash-on-Cash Return
5.4%
Cap rate
0.8%
Rent to Value Ratio
Active
$1,150,000
5
bds
|
4
ba
|
3,761
sqft
|
built
1994
8100 Brighton Dr, Port Richey, FL 34668
$-4,149
Cash flow
-18.8%
Cash-on-Cash Return
1.8%
Cap rate
0.3%
Rent to Value Ratio
Active
$219,900
3
bds
|
2
ba
|
1,190
sqft
|
built
1974
7015 Oakshire Dr, Port Richey, FL 34668
$-11
Cash flow
-0.3%
Cash-on-Cash Return
6.1%
Cap rate
0.8%
Rent to Value Ratio
Active
$325,000
3
bds
|
2
ba
|
1,479
sqft
|
built
1975
9239 Palm Ave, Port Richey, FL 34668
$-530
Cash flow
-8.5%
Cash-on-Cash Return
4.2%
Cap rate
0.6%
Rent to Value Ratio
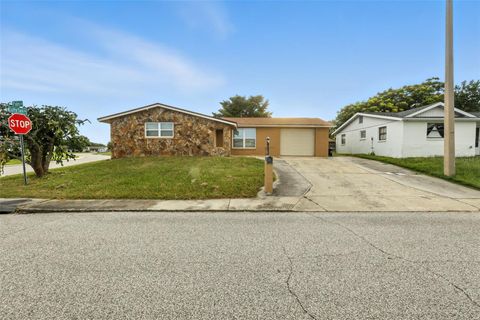
Active
$242,000
3
bds
|
1
ba
|
1,256
sqft
|
built
1967
11031 Martha Ave, Port Richey, FL 34668
$-71
Cash flow
-1.5%
Cash-on-Cash Return
5.8%
Cap rate
0.7%
Rent to Value Ratio

Active
$265,000
2
bds
|
2
ba
|
1,017
sqft
|
built
1970
7317 Rhinebeck Dr, Port Richey, FL 34668
$-471
Cash flow
-9.3%
Cash-on-Cash Return
4.0%
Cap rate
0.6%
Rent to Value Ratio
Active
$250,000
2
bds
|
2
ba
|
1,413
sqft
|
built
1982
9641 Morehead Ln, Port Richey, FL 34668
$-296
Cash flow
-6.2%
Cash-on-Cash Return
4.7%
Cap rate
0.7%
Rent to Value Ratio
Active
$289,999
2
bds
|
2
ba
|
1,492
sqft
|
built
1979
9116 Gray Fox Ln, Port Richey, FL 34668
$-218
Cash flow
-3.9%
Cash-on-Cash Return
5.2%
Cap rate
0.8%
Rent to Value Ratio
Active
$425,000
2
bds
|
2
ba
|
1,500
sqft
|
built
1982
9910 Island Harbor Dr, Port Richey, FL 34668
$-1,139
Cash flow
-14.0%
Cash-on-Cash Return
2.9%
Cap rate
0.5%
Rent to Value Ratio
Active
$199,500
2
bds
|
1
ba
|
846
sqft
|
built
1974
7311 Brentwood Dr, Port Richey, FL 34668
$-121
Cash flow
-3.2%
Cash-on-Cash Return
5.4%
Cap rate
0.8%
Rent to Value Ratio
Active
$365,000
3
bds
|
3
ba
|
1,942
sqft
|
built
1980
10401 Alice M Ct, Port Richey, FL 34668
$-510
Cash flow
-7.3%
Cash-on-Cash Return
4.5%
Cap rate
0.6%
Rent to Value Ratio
Active
$335,000
3
bds
|
2
ba
|
1,282
sqft
|
built
1970
7931 Bracken Dr, Port Richey, FL 34668
$-663
Cash flow
-10.3%
Cash-on-Cash Return
3.8%
Cap rate
0.5%
Rent to Value Ratio

Active
$224,900
2
bds
|
2
ba
|
1,152
sqft
|
built
1980
8020 Norwich Dr, Port Richey, FL 34668
$-134
Cash flow
-3.1%
Cash-on-Cash Return
5.4%
Cap rate
0.8%
Rent to Value Ratio

Active
$197,000
2
bds
|
1
ba
|
1,032
sqft
|
built
1978
9926 Gray Fox Ln, Port Richey, FL 34668
$13
Cash flow
0.3%
Cash-on-Cash Return
6.2%
Cap rate
0.9%
Rent to Value Ratio
Active
$305,000
3
bds
|
2
ba
|
1,423
sqft
|
built
1978
7102 Cherry Laurel Dr, Port Richey, FL 34668
$-473
Cash flow
-8.1%
Cash-on-Cash Return
4.3%
Cap rate
0.7%
Rent to Value Ratio
Active
$369,999
3
bds
|
2
ba
|
1,797
sqft
|
built
1984
8843 Aruba Ln, Port Richey, FL 34668
$-344
Cash flow
-4.9%
Cash-on-Cash Return
5.0%
Cap rate
0.7%
Rent to Value Ratio
Active
$275,000
3
bds
|
2
ba
|
1,344
sqft
|
built
1987
7822 Bahama Ave, Port Richey, FL 34668
$-391
Cash flow
-7.4%
Cash-on-Cash Return
4.4%
Cap rate
0.7%
Rent to Value Ratio
Active
$236,500
3
bds
|
2
ba
|
1,100
sqft
|
built
1971
10226 Willow Dr, Port Richey, FL 34668
$-308
Cash flow
-6.8%
Cash-on-Cash Return
4.6%
Cap rate
0.7%
Rent to Value Ratio
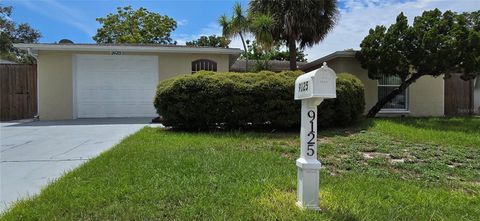
Active
$359,000
3
bds
|
2
ba
|
1,720
sqft
|
built
1979
9125 Lunar Ln, Port Richey, FL 34668
$-473
Cash flow
-6.9%
Cash-on-Cash Return
4.6%
Cap rate
0.7%
Rent to Value Ratio